
In the last article on endurance performance we talked about training zones – what they are and how to set your zones. If you haven’t had a chance to read the article on training zones, you can check it out here.
What is training intensity distribution?
Training intensity distribution refers to the time spent in different training zones within an endurance training programme. Research in the area typically uses a 3-zone model (which was explained in more detail in the previous article), however, it is possible to carry out a similar sort of analysis with 5 and 7-zone models. Training intensity distribution helps provide a global overview of an endurance training programme but this should not take away from the planning of individual training sessions.
How do you calculate your training intensity distribution?
Once you have set up your three zones either using lactate thresholds or critical power and an estimate of LT1, there are a number of different methods you can use to calculate your training intensity distribution. We’ll touch on two methods in this article: time-in-zone and session goal approach.
Time-In-Zone
The time-in-zone approach takes each session you complete and provides the total amount of time spent in each training zone. Typically, this will be done using heart rate as it is accessible to all endurance athletes, though the amount of time spent in power or speed zones is an alternative approach.
For example, below is the heart rate distribution from (1) a 2-hour low-intensity endurance session and (2) a 4 x 8-minute high-intensity interval session (as a percentage of the total training duration). Over time (weeks, months, years), you’ll be able to see the time accumulated in the different zones. An advantage of the time-in-zone approach is that many commonly-used online platforms will complete this analysis for you.
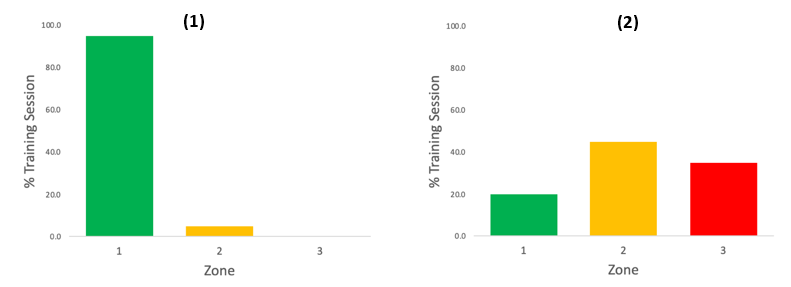
Depending on whether you analyse your sessions using heart rate or power/speed, you’ll likely get slightly different distributions. Typically, you’ll get a smaller percentage of time spent in zone 3 if you base your analysis on heart rate due to the heart rate lag associated with high-intensity efforts. This is something to bear in mind when you are making training intensity distribution comparisons – make sure you’re comparing apples with apples!
Session Goal Approach
The session goal approach takes the entire session and assigns it into zone 1, 2 or 3, based on the main characteristics of the session. For example, low-intensity endurance training would be a zone 1 session, sweetspot intervals would be a zone 2 workout, and high-intensity interval sessions would be in zone 3. A disadvantage of the session goal approach is that it doesn’t consider the duration of the training session and fails to capture the subtler details of the session (e.g. if you complete a mixture of zone 2 and 3 efforts). Nevertheless, if you don’t have access to an online training platform, this simple method of analysis provides you with an alternative. Once you have assigned your sessions into zone 1, 2 and 3, you can determine the percentage of training sessions in each zone.
What can we learn from elite endurance athletes?
Whilst the majority of us aren’t elite endurance athletes, there may be lessons we can learn from high-performing athletes and their coaches who have tinkered with training methods over time in search of optimal training approaches. When it comes to training intensity distribution, we see a consistent trend across endurance sports: approximately 80% of training is completed in zone 1 and the remaining 20% of training is completed in zones 2 and 3.
The figure below presents the training intensity distribution from different sports. The researchers in each sport have used slightly different methods to determine the training zones but they are still grouping the intensity continuum in the same way: low (green), moderate (yellow) and high (red) intensity training.
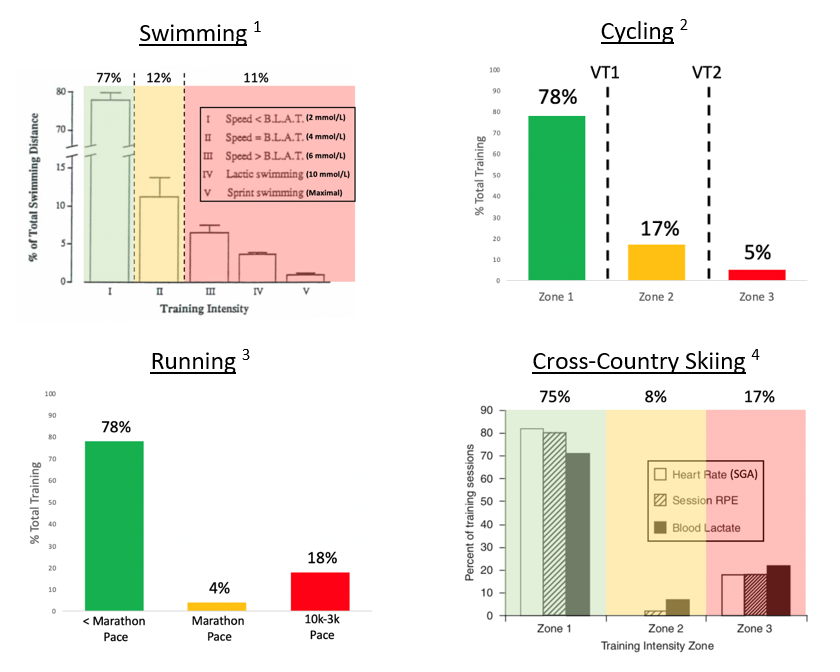
The examples from swimming and cycling would be referred to as a pyramidal training intensity distribution with Zone 1 > Zone 2 > Zone 3. On the other hand, the examples from running and cross-country skiing display a polarized training intensity distribution with Zone 1 > Zone 2 < Zone 3.
What happens when you compare training intensity distributions against each other?
When the initial research suggested athletes train with an 80-20 approach, researchers decided to compare this approach to other commonly used training intensity distributions. A study conducted by an Austrian research group compared the following training intensity distributions 5 (the training plans can be seen in the figure below – they repeated the cycle three times):

Following nine weeks of training, the athletes who followed the polarized training plan demonstrated the greatest improvements in key determinants of endurance performance (VO2max and lactate threshold) – proving additional support for the polarized approach to training.
Why does the 80-20 approach appear to work?
When training for any sport, there is a fine balance between the adaptive stimulus (which drives the beneficial adaptations to training) and systemic stress (which can lead to fatigue and overtraining).
By implementing an 80-20 approach to training, you can accumulate both training volume and training intensity. Both of these factors are thought to be important for stimulating beneficial adaptations such as mitochondrial biogenesis 6 and angiogenesis 7. Mitochondria are often referred to as the ‘powerhouses of the cell’ – important in providing energy during endurance exercise. Angiogenesis refers to the formation of new blood vessels – an important adaptation for transporting oxygen to working muscles.
When looking at systemic stress, there appears to be a clear difference when we cross the boundary from zone 1 to zone 2 and 3 8. Following a zone 1 training session, research suggests we are able to recover quickly. Following a zone 2 or 3 session, we produce a greater systemic stress response from which it takes longer to recover. When we think about training from a long-term standpoint, we must be careful about the number of zone 2 and 3 sessions we complete so we don’t fall into a state of excessive fatigue and, in the worst-case scenario, overtraining. Whilst doing lots of high-intensity interval training might provide a great training stimulus, it will come with lots of systemic stress and leave you feeling extremely fatigued. Similarly, training in zone 2 when you had initially planned to do a recovery session will further increase the accumulation of fatigue – not a sustainable approach long-term.
What are the practical take-home messages to improve your performance?
Whilst it might be tempting to push a little harder than you planned on your easy sessions, thinking you’ll be getting a better training response, it appears this may actually have negative impact on performance in the long-term. Instead, having the training intensity discipline to keep your zone 1 session within zone 1 so you are able to push hard on your zone 2/3 interval sessions later in the week is really important. Training intensity discipline means avoiding the urge to complete another Zwift race (and spending another hour in zone 2) or racing your training partner at the end of an easy recovery run.
In terms of scaling an 80-20 approach back for athletes training 5-10 hours per week (rather than 20-30 hours for elite athletes), the approach still provides benefit 9. Completing 1-2 high-intensity interval training sessions in zones 2/3 alongside zone 1 endurance sessions appears to offer an optimal, sustainable approach in the longer term.
To keep the message super simple, this quote from Dr Michael Joyner (an expert on human performance) is timely.
“Make your hard days hard and your easy days easy!”
Article written by Paddy Harrison, PhD student and Cycling Coach
References
- Mujika et al. (1995) Effects of Training on Performance in Competitive Swimming
- Lucia et al. (2000) Metabolic and Neuromuscular Adaptations to Endurance Training in Professional Cyclists: A Longitudinal Study
- Billat (2001) Physical and training characteristics of top-class marathon runners
- Seiler & Kjerland (2006) Quantifying training intensity distribution in elite endurance athletes: is there evidence for an “optimal” distribution?
- Stöggl & Sperlich (2014) Polarized training has greater impact on key endurance variables than threshold, high intensity, or high-volume training
- Granata et al. (2018) Training-Induced Changes in Mitochondrial Content and Respiratory Function in Human Skeletal Muscle
- Gliemann (2016) Training for skeletal muscle capillarization: a Janus-faced role of exercise Intensity?
- Seiler et al. (2007) Autonomic Recovery after Exercise in Trained Athletes: Intensity and Duration Effects
- Muñoz et al. (2014) Does Polarized Training Improve Performance in Recreational Runners?