Most traditional approaches combine two or three indicators at the same time, such as income with sex and ethnic identity. This project explores how the multiple elements defining class, gender, and ethnicity interact with one another—a concept known as intersectionality.
By examining them together, academics can gain a deeper and more accurate understanding of inequality. This approach helps to reveal patterns that may be overlooked when we consider demographic and identity categories separately.
For example, people from specific ethnic backgrounds, who do not speak English as their first language, who have low educational attainment, who are also family carers and who are female could face higher rates of discrimination, poorer health outcomes and limited access to support services.
This analytical approach could help policymakers and service providers design more targeted interventions and ensure that the proper support reaches the people who need it most.
Dr Adrian Leguina, who is leading the project, A new paradigm of quantitative intersectional analysis using geometric data analysis, said: “Instead of just saying ‘people with low-income struggle’, we can say something more detailed like, ‘people identifying with a specific combination of class, ethnic and gender categories are much more likely to face several challenges at once’. It gives us a much clearer picture of who is being left behind in society – and why.
“By mapping how class, ethnicity and gender combine to shape people’s lives, we can identify communities facing overlapping challenges, such as discrimination, poor health, or limited access to education.
“These insights can help public services target support more effectively. For example, suppose we know that certain ethnic groups are more at risk of discrimination. By intersecting this with further cultural and economic factors, we can design initiatives that are more responsive to their needs.
“Better insights don’t just mean more numbers — it means smarter decisions. This approach can lead to more inclusive policies, fairer resource distribution, and ultimately, services that are built around people’s real experiences rather than one-size-fits-all assumptions.”
The project builds on long-standing methods used in sociology to explore class divisions.
One such method, known as Multiple Correspondence Analysis (MCA) – illustrated below – turns categorical data into coordinates, allowing researchers to plot people’s identities and social experiences in a shared space.
The closer the points are on the map, the more alike those groups are. And just like with a geographic map, some areas are more exposed to risk – whether that’s discrimination, poverty, or health inequalities.
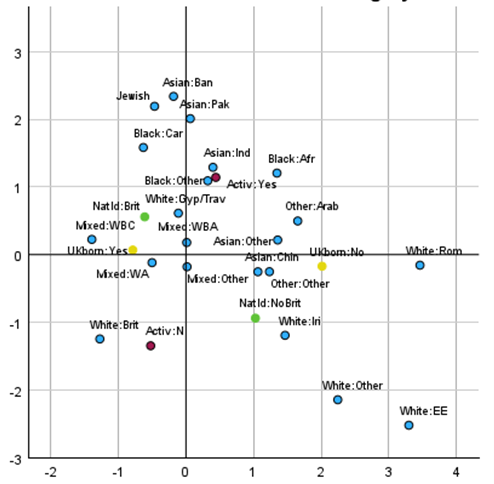
The map shows (above) how different ethnic and national identity groups relate to each other. Groups on the right are more closely linked with British national and White ethnic identities, while those on the left reflect more distinct or minority backgrounds.
The vertical axis highlights how culturally active or visible different minority groups are – those higher up tend to be more engaged in cultural or community activities.
The map was produced using data from the UK’s Evidence for Equality National Survey and is part of learning material that will be openly available for students, researchers and practitioners interested in learning about multiple correspondence analysis.
Beyond the research itself, the project aims to open up these tools to a broader audience. Dr Leguina and his team have developed an annotated bibliography, hosted an international workshop on statistics and intersectionality, and developed an open resource to help other researchers, students and even policymakers use these methods in their work.
ENDS