12. SEND Postcode Lottery Map
Prof. Louise Holt and Dr Fran Azpitarte
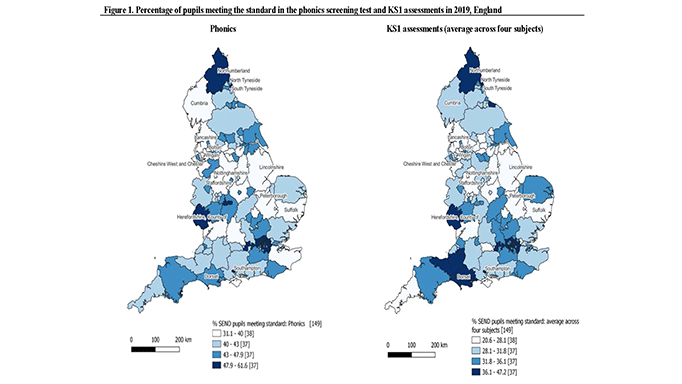
This map shows data from the English National Pupil Database of results of children with labels of Special Educational Needs and Disabilities at primary school Key Stage One (aged 7).
It is clear from the map that there is a spatial pattern to the outcomes of children with Special Educational Needs and Disabilities, with many metropolitan and large urban areas having the best outcomes. Look closely and you will see that even in the best performing areas, only 28.1% of children with these labels or experiences reach age expected standards in all elements of the testing. This includes young people with physical and sensory impairments, as well as those with learning differences.
We argue that this data adds further weight and evidence to a growing recognition, even from government, that the SEND system needs to change, and that the ambitious aims of the transformation of education and care for children with SEND in 2014 and 2015 are not being realised. We suggest that readers suspend notions of who is more and less ‘able’ to learn to consider how learning, what and how we are expected to learn, is situated in cultural and social expectations. Difficulties in learning are as much a product of these expectations as they are the ‘differences’ of children.
We argue that society has a responsibility to ensure that all children reach their full potential, and yet young people with SEND are being systematically failed, and their outcomes differ according to where they happen to live.