Monitoring of water supply coverage
Author: Kristof Bostoen, February 2005
Quality assurance: Sandy Cairncross
Monitoring of water supply coverage will help to ensure water supply for the millions of people who still lack convenient access to a ‘safe’, reliable and affordable water source. According to the WHO/UNICEF Joint Monitoring Programme, more than one in four people in the developing world lack access to water (WHO/UNICEF 2004). Targets have been set in the Millennium Development Goals (MDG) to accelerate the improvement of this situation. Quantifying access through monitoring will be essential to attain such goals, although the process to achieve these goals will be as important in order to achieve sustainable coverage.
This fact sheet aims to clarify different steps involved in measuring access to water by water coverage surveys and highlight some of the problems that may affect current monitoring.
There is a common misconception that monitoring should only be done by specialised professionals. However, everybody uses similar techniques in their daily lives. When we buy fruit or vegetables we look at them, feel them or even smell them to assess the quality of the product. When all of them cannot be checked individually, we examine a small sample and consider it representative enough to give the buyer confidence in what is being purchased. Monitoring uses a similar process of sampling when a number of households is asked in a survey about their access to water. While, monitoring statistics may often appear daunting, they are in reality only a small part of the monitoring process, as shown below. Despite their small role, the statistics are often given a central place.
Different steps in the monitoring process cycle
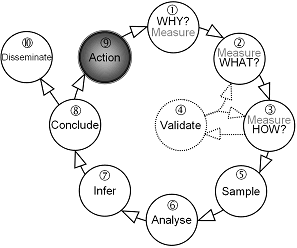
Monitoring is not a stand-alone activity but a tool used to feed information into other activities. It can be divided into different steps as shown in Figure 1 . The first four steps ( Why, ‚ What, ƒ How and „ Validate) relate to the definition and indicators to be measured, while the three following steps (… Sample, † Analyse and ‡ Infer) are about the representative data collection and analysis. Often statistics is seen as the central part of monitoring, but in fact only one step in the whole process, step † (analyse), uses statistical formulae. Steps ˆ, ‰,, and Š follow the data analysis and feed back to the need ( Why Measure?) for a future round of data collection.
The rest of this document will cover the various steps of Figure 1 in more detail.

Figure 1: Steps in monitoring of coverage
1. Why measure water supply coverage
Monitoring can help to do any of the following:
- Set goals, targets, policies and tariffs;
- Quantify how many people or households have access to water;
- Make regional, national or international comparisons.
- Appraise water supply targets set by public and private authorities;
- Understand why people do not have access to water;
- Target those people lacking access by identifying and locating them;
- Measure sustainability of access for people who do have a water supply;
- Plan more effective targeting of resources (equity and scaling up);
- Identify coverage deficiencies;
- Make better management decisions;
- Target pro-poor and gender-sensitive policies and actions;
- Engage in sector advocacy at regional, national and international level;
- Control costs;
- Plan operation and maintenance
Despite the importance of collecting information it is surprising how little measuring actually happens and how often monitoring is used only for reporting.
2. What do we want to measure?
First of all we need to define clearly what to measure. In terms of water coverage, possible definitions could be:
Water in adequate quantity for hygiene purposes and of adequate quality for human consumption.
or
Although these definitions seem clear, they still cannot be measured as they lack clear measurable outcomes. Terms like convenient, reliable, a source, adequate quantity and adequate quality need to be defined so they become objectively measurable.
One of the factors of a ‘reliable’ source might be that it is not intermittent. A measurable definition of ‘reliable’ could be a source that is available ‘without a day of interrupted supply in the past 7 days’. This might not be a complete description of a ‘reliable’ source, but it is a clear and satisfactory measurable definition for monitoring.
It is often impossible to measure a variable of interest in large household surveys. For instance, to assess water quality might require expensive laboratory tests. The ‘type of water source’ such as ‘piped water’ (often good quality) or ‘river water’ (often bad quality) could then be used as an indicator being ‘close’ to the information required. The ‘type of water source’ is referred to as a measurable proxy indicatorfor water quality. Although this is not always a perfect proxy it helps to get a better idea of water quality through a measurable indicator.
Households do not always use a single source of water. In rural areas in particular, seasonal changes often occur. Where seasonality and multiple sources are relevant to coverage, definitions and measurable indicators might have to take this into account. An indicator can be built up from multiple answers, as often a single question cannot elicit all the critical aspects of access.
Definitions are context-specific. The poor would have a different definition for access from the more affluent, a government or a funding agency. Women, involved in the day-to-day water collection, will define access to water differently from men. Involving the target population in defining access (and how to collect the necessary information) will promote a consensus among the target population and give a better understanding into the local water access problems.
Benefits from water supply can only be achieved if water sources are used. In measuring coverage there is often discussion about whether use (which is practice) should be measured, or access (Which is more theoretical, but for which providers can more easily be accountable)

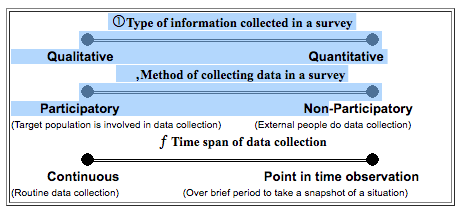
Figure 2: Aspects of data collection for water coverage monitoring in a survey
3. How to measure water coverage
There are different ways of collecting water-related data and the methodology will depend largely on the purpose of the monitoring work and the resources available for it. No single data collection method will be able to provide all the information needed for projects as different types of information will be collected in different ways.
There are two main and complementary methodologies in data collection; qualitative and quantitative methods. Quantitative methods aim to measure a small number of quantitative indicators and characterise these in figures. Quantitative data such as water coverage are often expressed in percentages of people or households having or not having access. Qualitative methods are more exploratory and analytic, seeking a diagnosis or description of a problem. They are also better able to discover information that was unexpected and therefore not explicitly asked for in the survey.
- Typical Quantitative information could be: 35% of people have access to 'improved' water sources. In Urban areas this becomes 52% (+/-10%) while in rural areas the coverage is 27% (+/-15%)
- Qualitative information could be: 'households struggle with daily water payments at the beginning of each month after paying the rent, which makes them use river water for drinking at that time'.
Some qualitative approaches have been proposed lately, which aim to quantify qualitative data to facilitate interpretation and comparison (van Wijk 2001) . This blurs the line between the two approaches.
Other aspects of data collection are:
Participatory methods aim for a high involvement of the target population in the process of data collection, while non-participatory methods use mainly professional ‘external’ people for data collection.
Continuous or routine data collection is a continuous process of collecting and updating information, which is in contrast with point in time activities such as surveys which aim to collect information over a short period.
Survey methodologies often use a mix of approaches to collect data and the way each factor will be used can vary on a scale between the extremes shown in Figure 2. Often coverage data will be collected over a short period to obtain a point estimate. They generally are quantitative, non-participatory cross-sectional survey (as illustrated in the right column of the scale in Figure 2.). This is also the focus of this fact sheet, but it is not the only or preferred way of obtaining accurate data.
Usually water coverage surveys are done in a non-participatory way by an interviewer asking questions. However people can or do not always answer the questions accurately, so other methods of data collection like spot observations and demonstrations, should be considered. Information collected through different methods can be compared to check its validity. This is called “triangulation”.
4. Validate
Validation is the part where what is measured and how it is measured is scrutinised to make sure that it can give the information for which the data were collected. Validation is often not a part of a survey as it needs far more information and rigour in data collection than the basic data collection. However the collected data and the method of collection have to be based on some type of past validation before being included in a survey. Typically validation would compare the collected data with information which is judged to be as reliable as possible. This can be done during pre-testing, which is essential before any survey and consists of doing a small survey in a similar population under similar conditions. For example, if the type of water source is used as a proxy for water quality, a sub-sample during the survey can be submitted to more rigorous tests such as water quality tests to determine if water quality is related to the type of water source as has been assumed.
Validation should not be limited to what is being measured, but how it is collected. When data are collected by asking a question, validation involves checking whether the people are able or inclined to give accurate information.
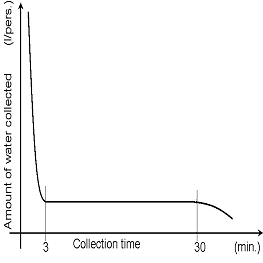
Water collection time is often used as a proxy for water quantity according to the relationship shown in. However, it might be useful to measure both, in order to confirm this relationship for a local context. It is also essential to verify if interviewees estimate correctly the time required for a water collection journey. The question can compare water collection time to the duration of certain day-to-day activities, such as the cooking of certain foods, to obtain more reliable results. Validation feeds back into what and how to measure until indicators are suitable to be used.

Figure 3: Water quantity and collection time
5. Representative sampling
The basic sampling unit is the unit on which the data are collected. A practical basic sampling unit for water coverage can be ‘the household’ because all people in the household are likely to use the same water source at home. However for some aspects such as ‘sustainability of water source’ or ‘number of beneficiaries per source’ the water source can be a more suitable basic sampling unit.
Collecting data from every household is often impossible or impractical, so a sample of households is taken from the target population. The conclusion based on the sample can apply to the total population if the sample was representative.
To take a representative sample it will be essential to:
- Clearly define the target population from which the sample is collected;
- Clearly define the basic sampling unit;
- Make sure each basic sampling unit has an equal or known chance of being included in the sample.
Taking representative samples is often complex, particularly in low income countries. It is seldom straightforward to make a list of households which is needed in traditional sampling methods, because of a lack of addresses or other household locators. Also people who have access to water are usually clustered around a water source. This geographical clustering of people with access to water causes bias in the sample, and even if this bias is controlled, it requires increased sample sizes. To make data collection more accessible for management and evaluation of projects, more suitable sampling methods need to be developed.
Practical implementation
Although practical implementation of a survey will be crucial to the validity of the collected data, it does not always get the attention it deserves. Practical implementation starts with the decision to do a survey until the data are analysed and made available. At each level the convenience of implementation and the level of training received for the task ahead will determine how valid the outcome will be. Three particular points can be identified:
- If it is difficult to identify each household included in the sample, the interviewer might select an alternative household which can make the sample unrepresentative
- Data that are difficult for the surveyor to collect or which are not properly and promptly noted down can make this information unreliable
- Coding the work from a paper to an electronic format for analysis can be tedious work which can introduce errors in the data and into the analysis
6. Analyse
Before any data are collected or even any pilot survey is done, it is important to think how the collected data will be used, what assumptions have to be made (possibly checked) and what analysis will be done. Necessary information is often found to be lacking only during the analysis stage. A complete analysis of the pilot data might help to identify such problems in good time.
Various agencies invest in water and sanitation not because they are a basic right, but to improve public health. Often there is a temptation to measure the health impacts of water and sanitation in such programmes as the outcome. However this has many pitfalls, and often results in meaningless results.
(For more info see http://www.lboro.ac.uk/well/resources/fact-sheets-htm/mthiws.htm)
7. Infer
Once the sample is analysed, it becomes possible to apply the results to the whole of the target population. This is possible only if the sample was representative.
Questions worth asking include: Do all groups of people, even marginal groups, have an equal chance of being included in the sample? How could excluded groups affect the result? Also those values missing due to non-response are worth analysing when possible. It enables us to document limitations of the methods used and problems encountered, which will add credibility to the analysis.
In statistical jargon, the process of assuming that results from the sample are also true for the population is called inferring or inference.
8. Conclude 9. Action
There is a difference between analysing sample data (statistical work) and the analysing of results (a managerial responsibility). The conclusions drawn from the statistical results will feed into step ‰ ‘action’. One action will be to define the information for the next round of data collection which will feed back into step ‘why?’. An additional need in a consequent round of data collection could be to make the collected data comparable with data previously collected, in order to measure the extent of progress.
10. Storage, documentation and dissemination of data
Surveys are often done by people external to the surveyed population. The collected data are often not used outside the organisation for which they have been collected which makes them de facto the sole ‘owner’ of the data, despite the rights of the target population.
Information is crucial to any decision and advocacy process. Collected information should be documented for possible further use and where possible made accessible to a wider public. Water coverage data should be disseminated vertically, i.e. aggregated (upwards) or disaggregated (downwards) as well as disseminated horizontally among different sectors.
Documenting data and data analysis is essential but requires additional resources such as time and funding which have to be allocated. This is particularly true for data sets and data analysis that are made freely available to the public.
Cost-benefit of monitoring activities
With resources in short supply, authorities are often reluctant to get involved in data collection, as these activities appear to have no direct impact on beneficiaries. This is particularly true if the authorities are uncomfortable (or unfamiliar) with collecting such data. However, accurate data can allow better targeting of resources and can help to justify further investment. Monitoring can often help to make substantial savings and to avoid redundant activities. It can help to justify actions that are counter-intuitive.
Useful tools for surveys
Various simple tools are an invaluable help during surveys. For instance, an automatic numbering stamp ensures unique numbering of each questionnaire form.
Free software programs are available for entering data into a computer and for analysis. The most popular programs are:
EPIDATA (recommended)
Simple but powerful programme not requiring a powerful computer
EPI-info
http://www.cdc.gov/epiinfo/index.htm
CS-Pro
http://www.census.gov/ipc/www/cspro/index.html
Win-IDAMS
Remarks
The subject – Monitoring of coverage – discussed in this fact sheet is just a small part in the monitoring efforts of the water ‘sector’, which also includes other factors such as user demand, and satisfaction, institutional capacity and responsibilities, operation and maintenance as well as environmentally sustained services.
Further information on assessing hygiene improvements can be found on the Website of the former USAID Environmental Health Project:
http://www.ehproject.org/PDF/Strategic_papers/SR-8-HISGPaperVersion.pdf
Draft documents on the WaSH survey are available:
http://www.lshtm.ac.uk/dcvbu/hygienecentre/documentation/QForms_full.pdfis a draft questionnaire while
http://www.lshtm.ac.uk/dcvbu/hygienecentre/documentation/KDiscussion.pdfis a discussion document on indicator. Updated documents in the form of a survey manual are expected by mid 2005.
Bibliography
- Patton, M. Q. (1990). Qualitative evaluation and research methods. Newbury Park, CA, Sage Publications.
- van Wijk, C. (2001). The Best of Two Worlds? Methodology for Participatory Assessment of Community Services, IRC
- WHO/UNICEF (2004). Meeting the MDG drinking water and sanitation target, a mid-term assessment of progess www.unicef.org/publications/index_23223.html
