Monitoring of water supply coverage – Regional Annex Ghana
Author: Bernard Akanbang and Eugene Larbi, TREND, January 2006
Quality assurance: Kristof Bostoen
Introduction
This factsheet contains information on monitoring the coverage of water supply in the Ghanaian water sector. It aims at giving a contextual dimension to a WELL Fact Sheet on the same subject. It highlights the usefulness of monitoring information in achieving the country’s MDGs target. Furthermore, it describes some monitoring practices available in country and analyses the problems and challenges with current monitoring procedures and frameworks. Finally, the factsheet comes up with key capacity issues on improving current monitoring practices.
Why monitoring information is important
Monitoring is very important in helping government and stakeholders to track the progress in the achievement of the water and sanitation targets.. Monitoring information is also required for the general development of the Sector in the following ways:
Uses requiring formative data
- Helps communities to take corrective actions to ensure reliable and sustainable service;
- Serves as key resource for ensuring transparent and accountable development in the sector;
- Helps identify critical weaknesses and potential bottlenecks likely to hinder achievement of goals and objectives of the sector.
Uses requiring summative data
- Provides the baseline for evidence-based local/international advocacy;
- Provides a baseline for the systematic review of the implementation and allows for measuring progress based on such baseline.
Sector monitoring practices in Ghana
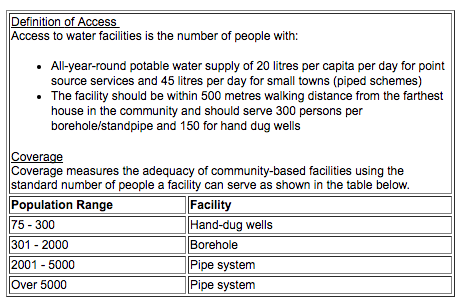
The most reliable source of national monitoring data is in the central Agency for Community Water and Sanitation (CWSA). Systems and processes for monitoring urban services are not well developed. The CWSA has a National Monitoring System (NMS) which it shares with all its regional offices. The system captures implementation data such as the number of facilities, who provided what facility and the names and population of communities served. Information generated from this database is used to compute coverage figures and in the development of a Strategic Investment Plan (SIP).
Box 1: CWSA Definitions for monitoring

The NMS provides data for the annual national coverage reporting. In addition to the NMS, there is the CWSA InfoSys at the regional level. This system is intended to be a standard Regional database for CWSA, for capturing detailed data on daily operations/activities e.g. Borehole drilling, Small towns’ water supply system, capacity building, O & M activities. Data for the monitoring systems originates from the districts and communities and is assembled by sector staff of the district assembly- the District Water and Sanitation Teams (DWSTs) and presented in district summary reports to Regional Water and Sanitation Teams (RWSTs) of the CWSA. RWST aggregates the district report to obtain a cumulative report for the region and submits the cumulative report to the Management Information System (MIS) Officer within the CWSA Head office. The regional inputs are compiled to obtain national reports and coverage rates at the various levels. CWSA monitoring information is disaggregated from the national to the regional, district and even community levels. This enables the data to be usable in lower level planning activities.
The key problem within the process is limited capacity of the CWSA to monitor the process at the district and sub-district levels. The reliability of the information generated has often been brought into question by members of the Coalition of Non Governmental Organisations in Water and Sanitation (CONIWAS) and its members at sector fora such as the Annual “Mole” Conference and the MDGs workshop organised jointly by TREND and IRC under WELL in February 2004. It is known that District level data is often under-reported and activities of NGOs and Civil Society Organisations (CSOs) for example have often not been included in district reports and are therefore likely to be missing on the NMS. For instance the SIP of CWSA in capturing the achievement of the sector in the past ten years did not contain information on activities of NGOs and CSOs. www.cwsagh.org/documents/sip_2005-2015.pdf
Another major constraint is the cumulative reporting of new facilities without taking into account breakdowns, failures and unsustainable supply systems. This would lead to an over estimation of access by the CWSA.
Monitoring activities at project level
A lot of donor-sponsored Projects and local/international NGOs also maintain their own (stand-alone) Management Information Systems. These mostly capture data on the implementation progress. Little effort has been made in the past to harmonise these different project systems. For both the national system and the project databases, the emphasis is on issues that relate to project efficiency. The MIS systems mostly capture quantitative aspects that relate to numbers of facilities, number of project staff trained, costs of various aspects of the projects etc. There is little information on the non- infrastructural aspects that describe the functioning and performance and use of facilities.
The Danish International Development Agency (DANIDA) is a sponsor of one of the large sector programmes. In its project, it places much emphasis on monitoring and is pioneering efforts at developing monitoring systems that include elements of effectiveness of systems. It places much emphasis on promoting maintenance and repair.
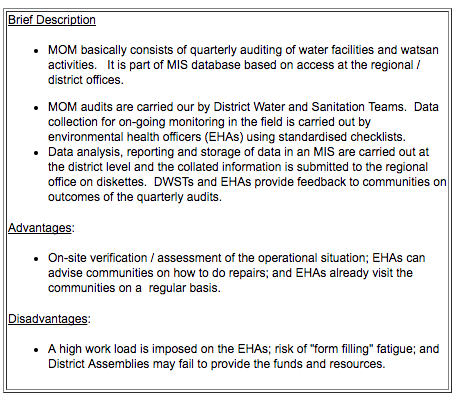
Box 2: Monitoring of Operation and Maintenance (MOM) in the DANIDA sponsored Water and Sanitation Project in the Volta Region of Ghana

Monitoring of MDG Progress in Ghana
In recent years monitoring has become a much discussed issue at the sector level largely due to the problems regarding progress monitoring for MDGs. A recent sector study confirmed that knowledge about the MDGs is very low at the decentralised level (regional and district levels). Most of the discussions on MDGs have been concentrated at the national level. Generally MDG monitoring and reporting occurs at two levels:
National reports by the National Development Planning Commission (NDPC);
The joint Monitoring Programme (JMP) of UNICEF and WHO which reports on national level progress towards the MDG targets..
NDPC monitoring system
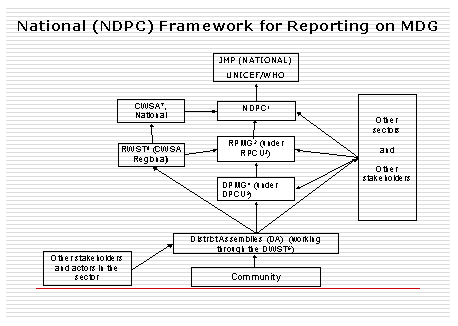
In the case of the NDPC, MDG reporting is carried out as part of the general effort to monitor progress of the Ghana Poverty Reduction Strategy (GPRS). Monitoring of the progress in the water and sanitation sector relies heavily on data from the National Monitoring system of the CWSA. The outcomes thus depend on the strengths and weaknesses of the CWSA system.

1. National Development Planning Commission
2. Regional Poverty Monitoring Group
3. Regional Planning Coordinating Unit
4. District Poverty Monitoring Group
5. District Planning Coordinating Unit
6. District Water and Sanitation Team
7. Community Water and Sanitation Agency
8. Regional Water and Sanitation Team
The JMP Monitoring System
JMP data collection comes from two main sources:
- Assessment questionnaires sent to WHO country representatives, to be completed in liaison with local UNICEF staff and national agencies involved in the sector;
- Household survey results collected from several sources, including Demographic Health Surveys (DHS), UNICEF's Multiple Indicator Cluster Surveys (MICS), World Health Surveys (WHS) and national demographic censuses.
The reports generated by the JMP have a key shortcoming and limitation:
- The MDG monitoring reports by the JMP only disaggregates by rural and urban but does not disaggregate to a sub national level. It is therefore not very suitable for decentralised planning purposes;
- JMP data based on assessment questionnaires contain more information than coverage only. However, it is not clear what happens with all that information after all the efforts that go in to filling these forms.
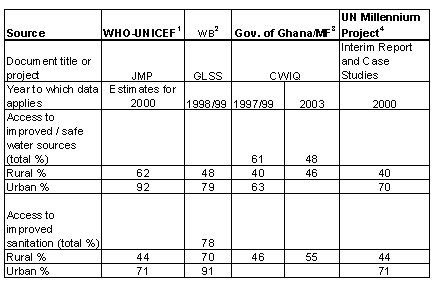
The efforts at these two levels (JMP and National) are not coordinated and experience shows that reports from these JMP and National Surveys are often different. Table 1 below illustrates the marked differences between the coverage levels projected from the different levels:
Table 1: Comparison of Coverage from Different Sources, Ghana

1 http://www.wssinfo.org/pdf/country/GHA_san.pdf (July 2004 update) Access 12/11/05)
2 http://www4.worldbank.org/afr/stats/StdFiles/bulletin01_gha_1998.pdf
3 http://www.imf.org/external/pubs/ft/scr/2004/cr04207.pdf and http://poverty.worldbank.org/files/ghana%20iprsp.pdf
4 http://www.unmillenniumproject.org/documents/mp_ccspaper_jan1704.pdf
The difference in coverage levels arises from variations in:
- the sources of the data;
- the methodology for evaluating coverage and;
- definition of what constitutes access by the various agencies involved
Summary of problems, challenges with monitoring of the MDG
Inconsistencies in data
A notable problem with the monitoring process in Ghana has been the variations and inconsistencies in monitoring data from different sources as shown in Table 1. The inconsistencies are directly attributable to the problems in the monitoring process. Such inconsistencies reduce the credibility of JMP data towards governments, data provided by governments towards the JMP and are confusing for third parties who are not sure which of the data is more reliable. It also provides challenges for feeding the figures back into policy.
Lack of nation wide framework for monitoring
The Water Directorate at the Ministry of Water Resources, Works and Housing is the sector ministry for water and sanitation. They recognise the need to collaborate with data gathering institutions such as the Ghana Statistical Service, CWSA, GWCL, databases of the various projects in the sector to harmonise various M&E systems into a comprehensive national system to be managed by the Water Directorate of the Ministry to serve as one stop centre for information on water and sanitation.
Limited community involvement and feedback
There is little room for community involvement in monitoring. According to Shordt et al (2000) this contravenes a key monitoring principle that requires monitoring information be collected by those with a vested interest in the information and be acted upon at the lowest level possible with the opportunity to refer to higher management levels. Even though the degree to which communities should be involved in monitoring could differ according to the purpose of the monitoring, third party monitoring is an important principle to avoid biases which can occur through self reporting because of vested interests. . There is also limited feedback on monitoring to the communities for taking corrective actions. A lot of the monitoring information is unlikely to be acted upon at the local level..
Limited involvement of Civil society and NGOs
Civil society organisations are important stakeholders for validation and quality assurance of data. However, their involvement so far has been minimal and there is no elaborate process in place to involve them. This, associated with wide variations in coverage figures, may in part account for the discrepancies within the present coverage figures.
Other key capacity issues
- for the establishment of a technical committee at the national level to review existing good practices at the project level and the harmonisation of definitions of the national monitoring system with existing survey efforts for the purpose of monitoring. This will make it easier to validate data from the various sources and for the JMP data to be used as a validation of national efforts;
- for education and capacity building especially at the district level and sub-district levels. This will raise the level of and appreciation for monitoring as a means to achieve more effective projects;
- to synergise all the relevant experiences at the various project levels, to identify the best practices for replication;
- to improve the institutional framework and collaboration between players in the sector. Stronger civil society/NGO involvement in the monitoring process with a view to harnessing their potential in areas like validation of monitoring data and capacity building to communities is required;
- to improve capacities and resources at the decentralised level for gathering of primary monitoring data. Facilities should be improved to ensure that all primary data resides with the District Assemblies.
Conclusion
It is important that the present focus of monitoring on the collection of implementation data gives way to a more comprehensive system involving the collection of data on sustainability issues such as water quality and functionality among others. Emphasis must also be placed on the use of monitoring information at all levels to ensure that sound and reliable strategies are formulated to address the challenges in meeting the MDGs.
References
- Powerpoint presentation by CWSA on Existing frameworks for monitoring on www.trend.watsan.net/page/409
- Powerpoint presentation by CONIWAS (Coalition of Non Governmental Organisations in Water and Sanitation on www.trend.watsan.net/page/413
- Powerpoint presentation by DANIDA on MOM in Volta region on www.trend.watsan.net/page/415
- Post construction summary report prepared by TREND for the World Bank www.trend.watsan.net/page/434
- Kathleen Shordt and Bernard Akanbang (2004). Ghana Country Position on Improving the Quality and Utilisation of MDGs Monitoring Data for sub-National Planning on www.trend.watsan.net/page/299
For further information contact:
Bernard Akanbang, Programme Officer, Institutional Development, TREND Group akanbang@yahoo.com or Eugene Larbi, Managing Director, TREND Group, eugenelarbi@yahoo.co.uk
Website: http://www.trend.watsan.net
