Throughout our REC work, a significant amount of data relating to staff and students has been considered.
Analysis of the data has allowed a greater understanding of racial inequalities that exist across campus and impact upon both staff and students. This has been integral to developing greater understanding and the identification and agreement of actions that need to occur to enable progress towards racial equity.
In addition to work to interrogate quantitative data, we also carried out staff and student surveys, analysed quantitative and qualitative data from these, and ran a number of staff and student focus groups. Further information on these, as well as key findings and associated actions can be found within the REC submission.
Data below presents an overview of some of the data within the REC submission.
The following data is shown by racialised group, wherever possible. In some instances (due to smaller numbers) the data is aggregated and the data for Black, Asian and other minority ethnicities is shown collectively in a BAME grouping. We acknowledge that presenting data by BAME/white staff does not acknowledge the gaps that might be present between people of different races and ethnicities. Data is only shown in this way where it is strictly necessary, to ensure we are acting within GDPR laws.
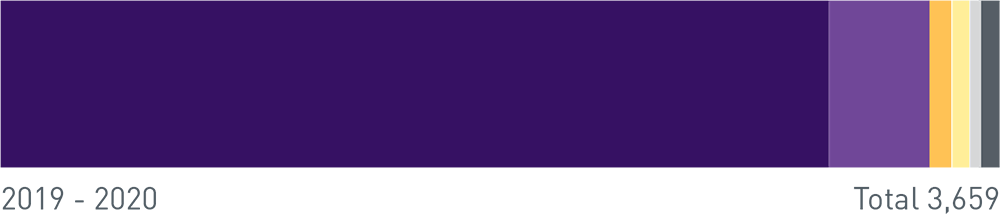
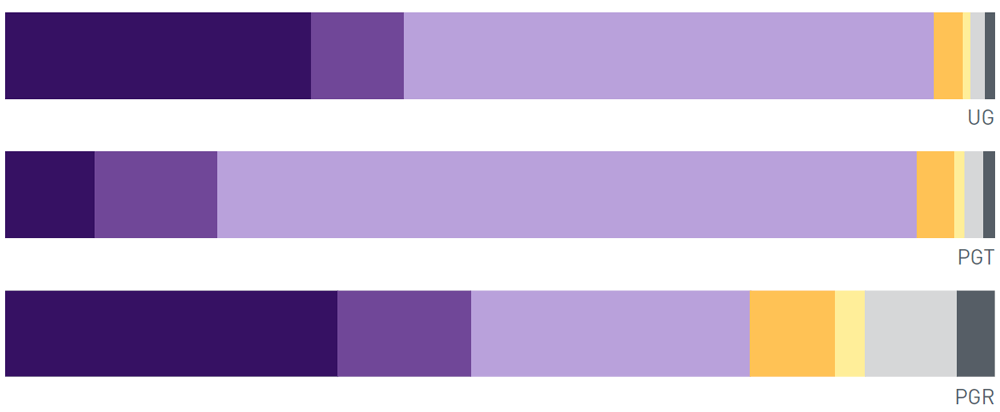
Populations by racialised groups
Populations by racialised groups (out of 3,659)
White
Asian
Black
Mixed
Other
Unknown/refused
3,034
371
72
61
42
78
82.9%
10.1%
2%
1.7%
1.1%
2.1%
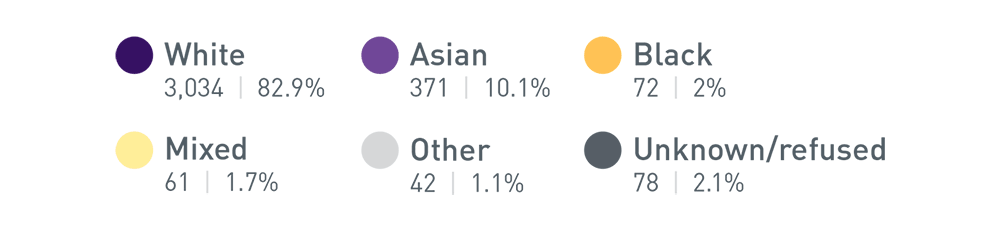
Grades 6 - 9 by racialised group
Grades 6-9 by racialised groups (out of 1,982)
White
Asian
Black
Mixed
Other
Unknown/refused
1,594
247
37
38
29
38
80.4%
12.5%
1.8%
1.9%
1.4%
1.9%
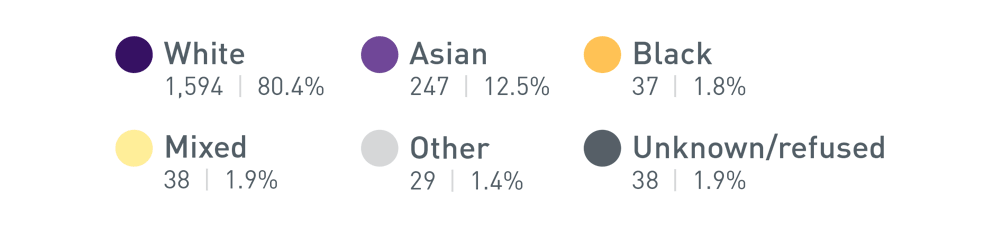
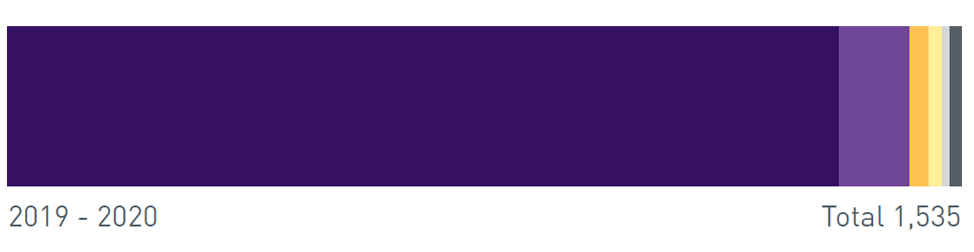
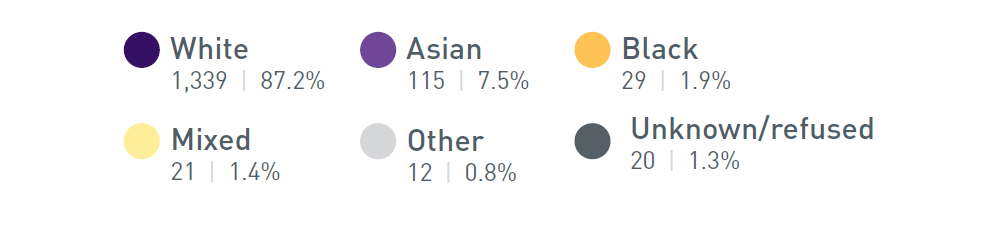
Grades 1-5 by racialised group
Grades 1-5 by racialised groups (out of 1,535)
White
Asian
Black
Mixed
Other
Unknown/refused
1,339
115
29
21
12
20
87.2%
7.5%
1.9%
1.4%
0.8%
1.3%
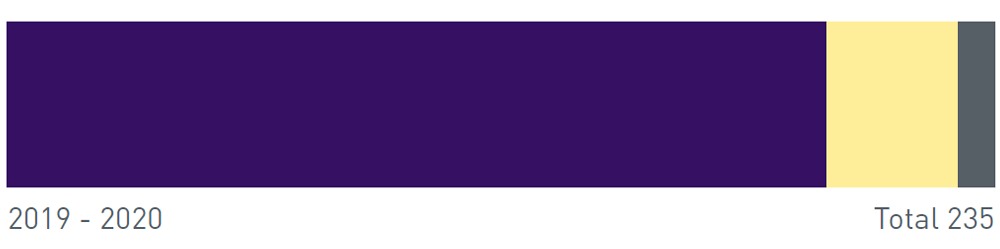
Grade 9 by BAME/White
Grade 9 by BAME/White (out of 235)
White
BAME
Unknown/refused
195
31
9
83%
13.2%
3.8%
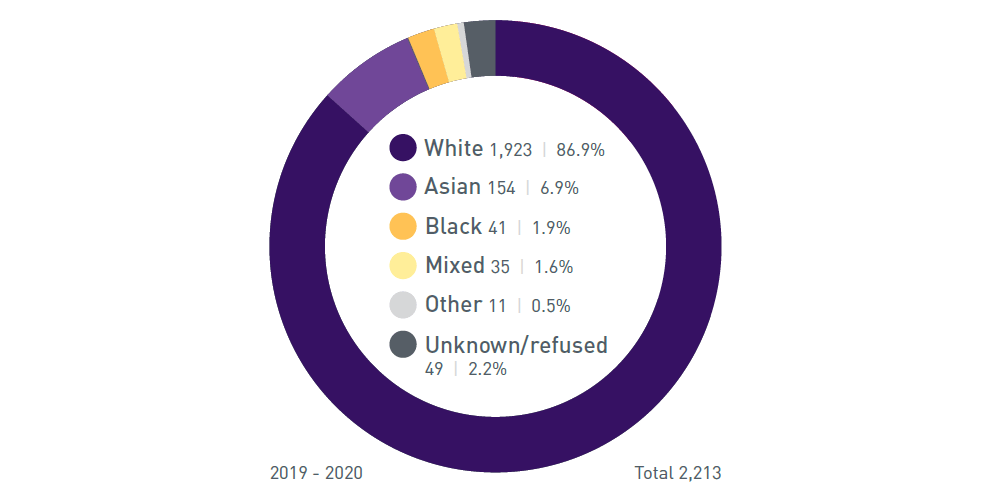
Populations by professional and academic services
Professional service staff across the University
Professional Service staff across the University (out of 2,213)
White
Asian
Black
Mixed
Other
Unknown/refused
1,923
154
41
35
11
49
86.9%
6.9%
1.9%
1.6%
0.5%
2.2%
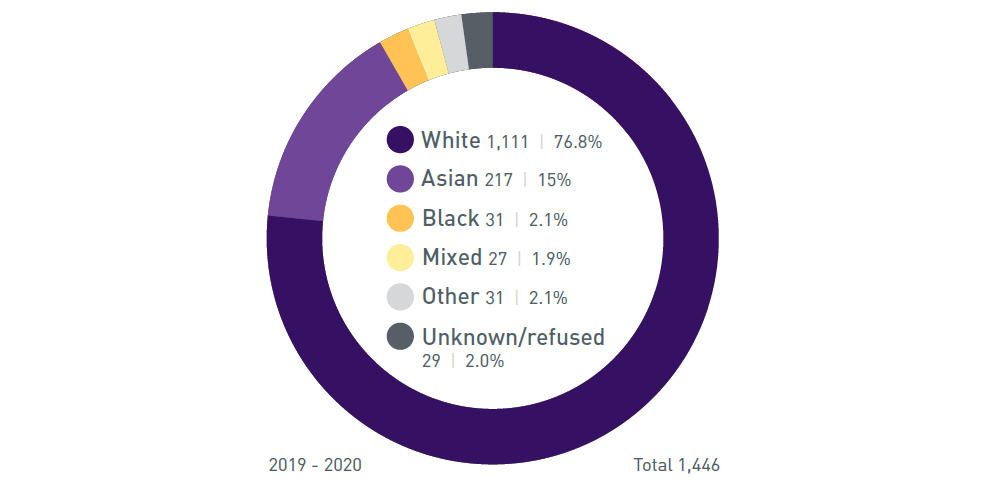
Research, Teaching and Enterprise staff across the University
RTE, Research and Teaching staff across the University (out of 1,446)
White
Asian
Black
Mixed
Other
Unknown/refused
1,111
217
31
27
31
29
76.8%
15%
2.1%
1.9%
2.1%
2.0%
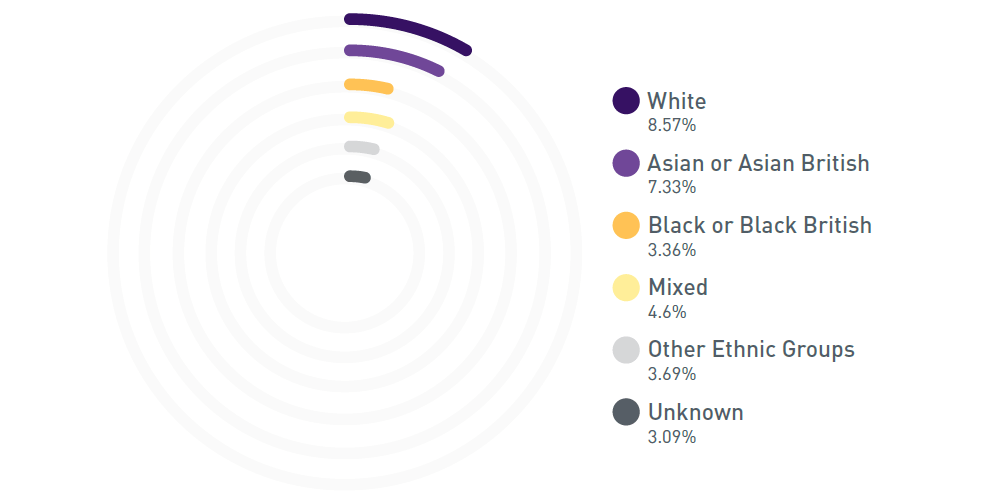
Recruitment
Lecturer, Senior Lecturer, Reader, Professor
Shortlisted from Applied
White
Asian or Asian British
Black or Black British
Mixed
Other Ethnic Groups
Unknown
8.57%
7.33%
3.36%
4.6%
3.69%
3.09%
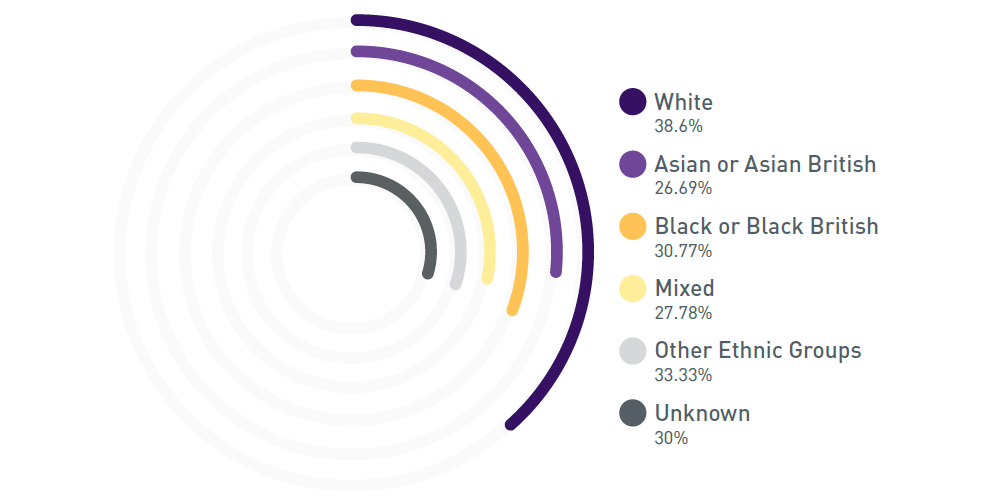
Offered from Shortlisted
White
Asian or Asian British
Black or Black British
Mixed
Other Ethnic Groups
Unknown
38.6%
26.69%
30.77%
27.78%
33.33%
30%
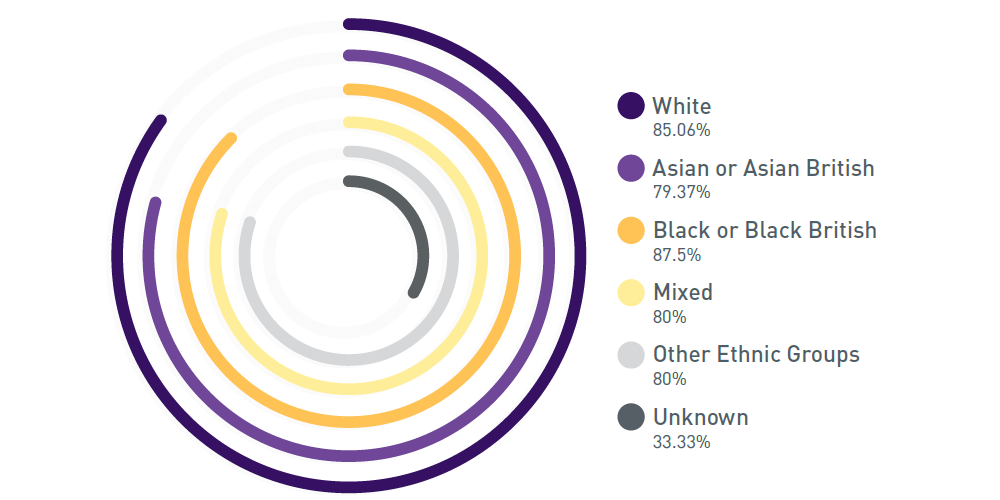
Accepted from Offered
White
Asian or Asian British
Black or Black British
Mixed
Other Ethnic Groups
Unknown
85.06%
79.37%
87.5%
80%
80%
33.33%
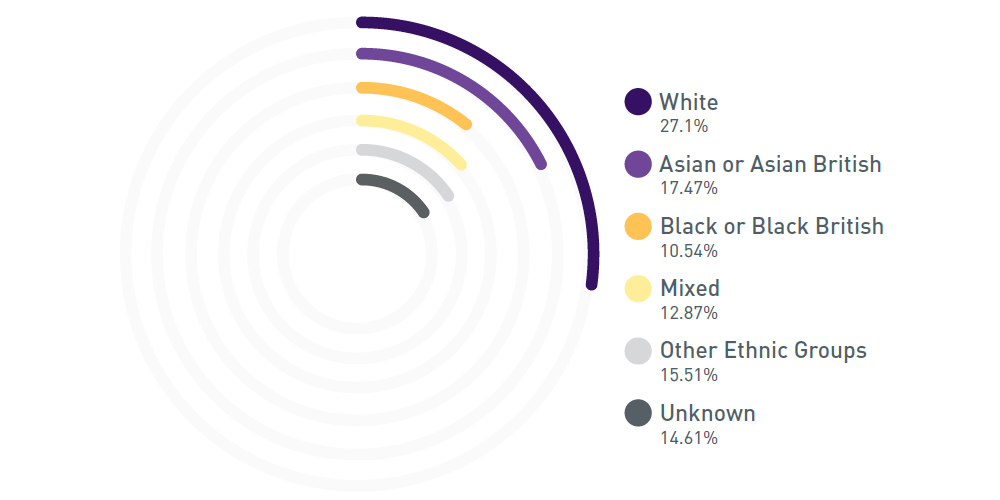
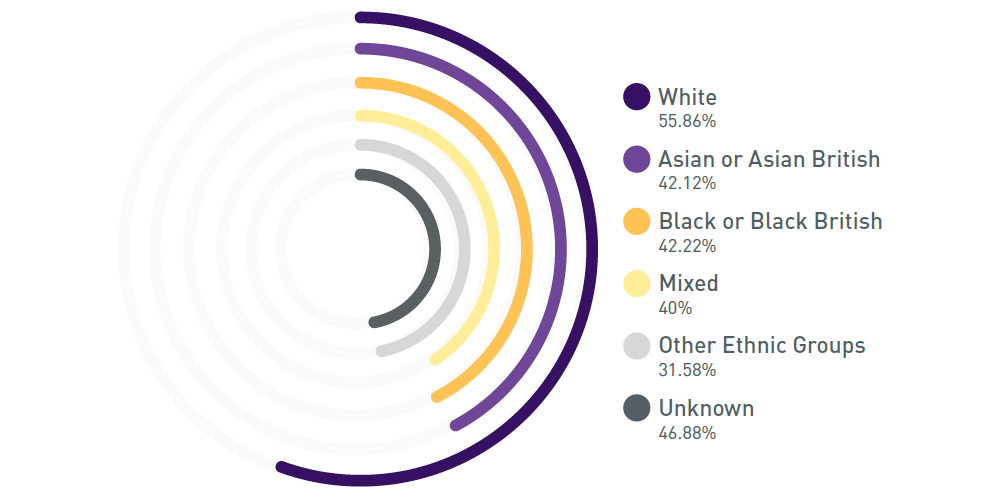
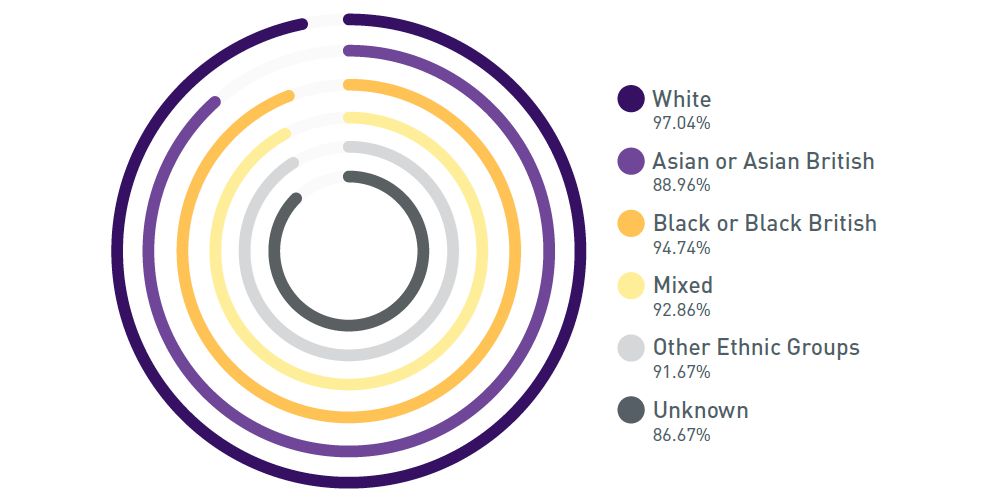
Research
Shortlisted from Applied
White
Asian or Asian British
Black or Black British
Mixed
Other Ethnic Groups
Unknown
27.1%
17.47%
10.54%
12.87%
15.51%
14.61%
Offered from Shortlisted
White
Asian or Asian British
Black or Black British
Mixed
Other Ethnic Groups
Unknown
55.86%
42.12%
42.22%
40%
31.58%
46.88%
Accepted from Offered
White
Asian or Asian British
Black or Black British
Mixed
Other Ethnic Groups
Unknown
97.04%
88.96%
94.74%
92.86%
91.67%
86.67%
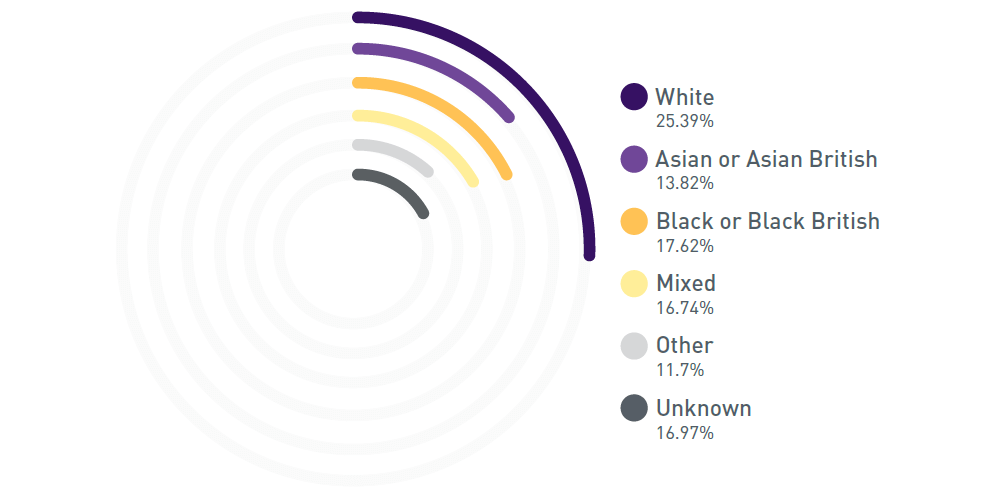
Professional Services staff
Shortlisted from Applied
White
Asian or Asian British
Black or Black British
Mixed
Other Ethnic Groups
Unknown
25.39%
13.82%
17.62%
16.74%
11.7%
16.97%
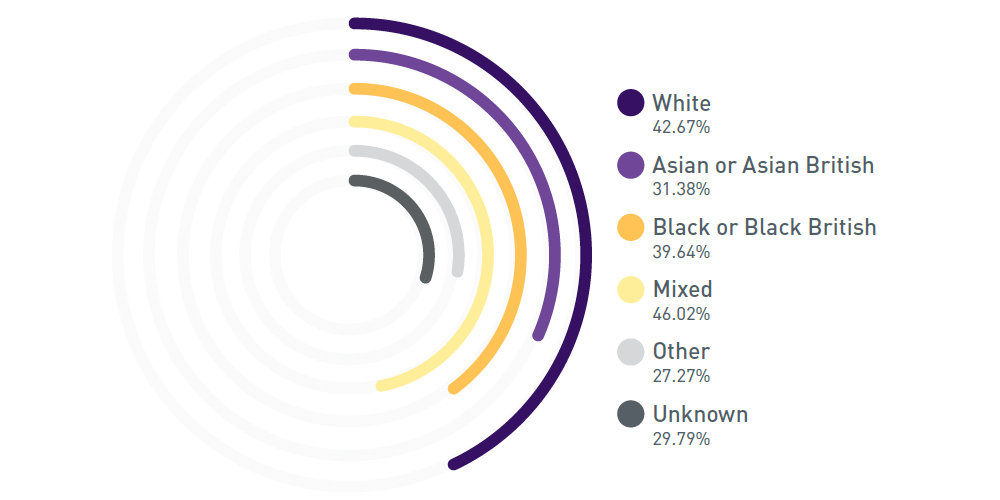
Offered from Shortlisted
White
Asian or Asian British
Black or Black British
Mixed
Other Ethnic Groups
Unknown
42.67%
31.38%
39.64%
46.02%
27.27%
29.79%
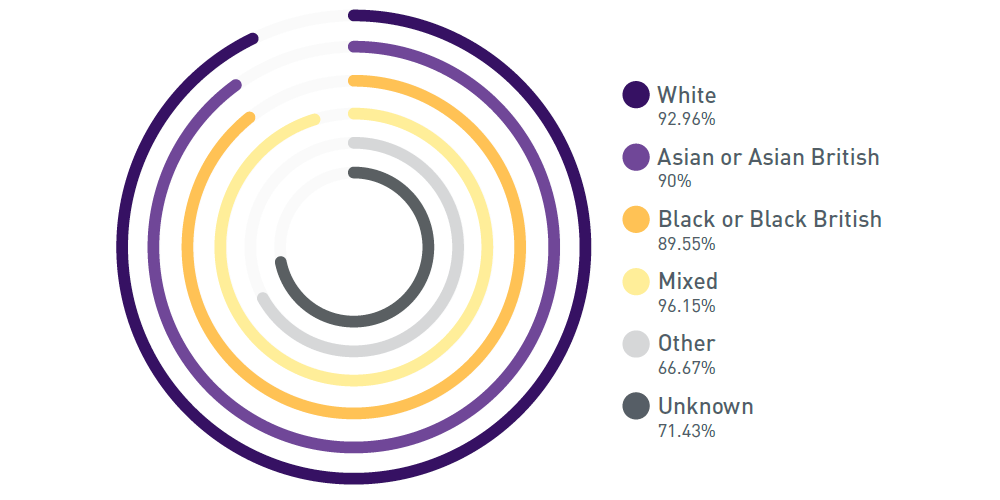
Accepted from Offered
White
Asian or Asian British
Black or Black British
Mixed
Other Ethnic Groups
Unknown
92.96%
90%
89.55%
96.15%
66.67%
71.43%
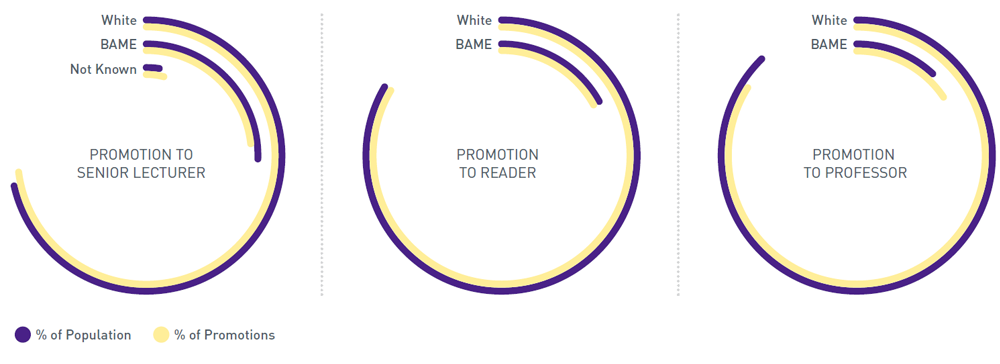
Staff promotions by BAME/White compared to population