GaWC Research Bulletin 348 |
|
|
|
This Research Bulletin has been published in Environment and Planning A, 43 (4), (2011), 904-927. doi:10.1068/a43213 Please refer to the published version when quoting the paper.
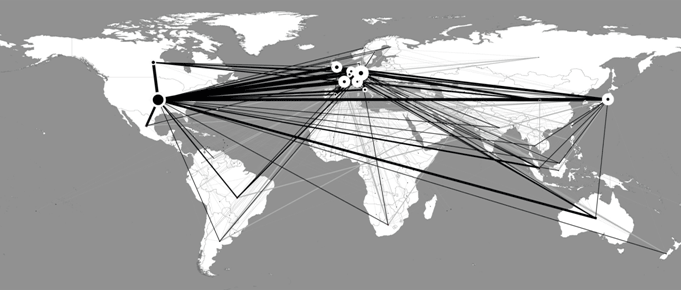
IntroductionAlthough the process of globalization has been cyclically developing for centuries (Andrade et al., 2001; Bordo et al., 2005), its magnitude has recently increased dramatically. Between 1970 and 1999, worldwide exports grew at a rate of 5.4% per year and worldwide inflows of foreign direct investment (FDI) increased at an average yearly rate of 11.0% (Barba Navaretti and Venables, 2004). Significant shifts have occurred as the capacity to produce and export manufactured goods has been dispersed to an expanding network of nations (Dicken, 2003), with each nation performing specific tasks in which it has an advantage (Porter 1990; Gereffi, 1994). Facilitated by reduced transportation costs, advanced technologies, increased openness of capital and labour markets, trade liberalization and institutional harmonization across countries (McCann, 2008), this inter-organizational system connects firms and states together to form the modern global economy, resulting in an ever-increasing functional integration of the world. Nonetheless, there are signs that corporate internationalisation remains like in previous waves of globalization restricted to the happy few' (cf. Mayer and Ottaviano, 2007). Exports are driven by a handful of firms. Only 4% of the American firms are exporters, shipping a modest share of their goods abroad (Bernard et al., 2007), while the top 1% of European exporters account for roughly 50% of European exports (Mayer and Ottaviano, 2007). Similarly, The top 500 MNCs account for over 90% of the world's foreign direct investment (FDI) stock (Rugman, 2005), while the top 100 MNCs hold over 30% of total FDI (UNCTAD, 2004). Furthermore, the geographical distribution of MNC networks remains persistently disproportionate (Wall and Van der Knaap, 2010), in that investments increasingly concentrate within and between a limited number of nations (Driffield and Love, 2005). MNCs create an international division of labour, corresponding to labour divisions between different levels of corporate hierarchy (Hymer, 1972). Because MNCs centralize high-level decision making and advanced production in a few nations, the rest of the world is generally confined to lower levels of economic activity. This structural division relates to the historical process of cognitive, cultural, social, political and economic embedding' (Dicken and Thrift 1992), in which these social and physical infrastructures remain relatively fixed (Harvey, 1982). In this light, we investigate the uneven distribution of today's economy and particularly how geographical embeddedness relates to transnational connectivity. Worldwide corporate networks can be explored in various ways, e.g. FDI in the form of mergers and acquisitions and Greenfield investments (Barba Navaretti and Venables, 2004), worldwide inter-corporate directorships (Carroll, 2007), intra-firm trade (Yeaple, 2006), office networks (Taylor et al., 2004), and ownership relationships between MNC headquarters and subsidiaries (Alderson and Beckfield, 2004). Our data concerns intra-firm ownership, based on the global Fortune 100 (2005) and their many worldwide subsidiaries - resulting in a dataset of 9243 ownership relations. By mapping the data, the geography of these corporate networks was revealed (Figure 1). It is clear that the network is polarized into the core regions of North America, Europe and Pacific Asia. These regions claim 98% of all outwardly directed relations over other nations, and 82% of all incoming relations. It is also evident that a clear North-South divide still exists and the highest intensity prevails in the Transatlantic zone between Europe and North America. Figure 1: Geographic Information System (GIS) map representing global corporate network.
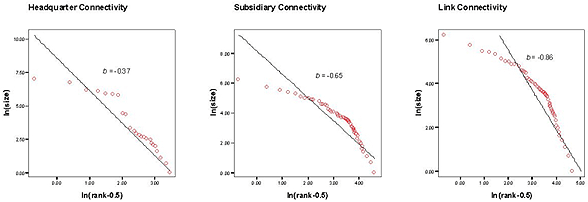
This disproportionality is further exemplified in the graphs below (Figure 2). The first graph reveals the number of MNC headquarters located in nations, while the second graph shows the number of subsidiaries per nation. The last graph shows the bilateral linkages between nations. In these graphs the log distribution reveals a highly disproportionate corporate system1. Not only are the rich countries better connected to the global corporate network than poorer countries, but considerable differences in connectivity exist within the group of rich countries. In fact, most corporate connections originate from and are targeted at limited countries (the happy few') and a high interdependency is found between only some nations (the happy couples'). Figure 2 : Disproportionality of the global corporate control network: Zipf regressions for (1) headquarter connectivity (number of outgoing linkages) emerging from within a nation; (2) subsidiary connectivity (number of incoming linkages) emanating from outside of the country; and (3) the bilateral connections between countries.
In this article, we study the architecture of today's global MNC network, by specifically linking the attributes of home and host countries to the disproportionality of the corporate system. We are not only interested in explaining the differences in national connectivity within the global corporate network, but also the differences in connectivity within the group of rich countries, herewith making a distinction between the rich and the happy few'. The remainder of this paper is organised as follows. The next section provides a theoretical overview of MNCs and their global corporate networks, including factors that shape these networks. In section 3 the dataset and methodology are introduced. Section 4 discusses the main empirical results, followed by the conclusions in section 5. Theoretical FrameworkThe Multinational Corporation and FDIThe gradual integration of nations within our globalizing world is strongly characterized by the economic networks formed by MNC headquarters and their subsidiaries located across the globe (Barba Navaretti and Venables, 2004; Brakman and Garretsen, 2008). These cross-border operations lead to a complex organization of economic activities at different geographical scales (Amin 2002, Henderson et al. 2002). MNC networks therefore represent distinct loci of power that have a significant impact on the contemporary global economy. The expansion of MNC networks takes place through FDI, which concerns long-range investments by an investor in a firm in a country other than where the investor is based. Hence, MNC networks are the outcome of past investments (Ghoshal and Bartlett, 1990) that are long-term in nature (Barba Navaretti and Venables, 2004). MNCs enter foreign markets either through mergers and acquisitions (M&A) or Greenfield investments. In the contemporary global economy, M&A account for 78% of FDI (Brakman et al. 2006). Furthermore, FDI can be characterized as horizontal or vertical. Horizontal FDI, which constitutes the largest share of FDI, concerns firms that duplicate' a number of home county activities abroad, and mainly target accessing foreign markets. Vertical FDI concerns investments in which firms decide to geographically disperse their activities, essentially motivated by saving production costs. Firms internationalize if the competitive advantages gained with establishing a subsidiary abroad are high enough to cover the additional costs and risks that are associated with this operation (Hymer, 1976). Following Dunning's OLI paradigm (Dunning 1977; 1993), firms invest abroad if they have market power given by the ownership (O) of products or production process, they have a location advantage (L) in locating their plant in a foreign country rather than in their home country, and have an advantage from internalizing (I) their foreign activities in fully or partially owned subsidiaries. Therefore, location advantage (explaining where firms internationalize') directly effects the structure of global corporate networks, while ownership advantage (explaining why firms internationalize') and internalization advantage (explaining how firms internationalize'), only indirectly influence MNC location decisions (McCann and Mudambi, 2004). Similarly, specific home market characteristics attribute to international competitiveness of firms. Determinants of the Structure of Global Corporate NetworksIn international business, international economics and economic geography, different theoretical models exist that attempt to explain the structure of global corporate networks (McCann and Mudambi, 2004; Faeth, 2009). Two main approaches can be distinguished that study FDI and the location choice of MNCs. On the one hand, the international business literature draws on Dunning's eclectic OLI paradigm to explain MNC location choice. On the other hand, the international economics literature, which builds mainly upon general equilibrium models of horizontal and vertical FDI (Markusen and Maskus, 2001). Although none of these are specific to international business or international economics literature, they tend to highlight different factors underlying the structure of global corporate networks (McCann and Mudambi, 2005; Faeth, 2009). Hence, in this article, we derive home country, host country and bilateral factors which may explain why the connectivity between certain countries is stronger than between others. By accounting for these factors, our analysis resembles the type of analyses employed in gravity-based modeling of FDI (see e.g. Loungani et al., 2002; Barba Navaretti and Venables, 2004; Bergstrand and Egger, 2007)2,3. Home Country Determinants Some countries generate more outward FDI than other countries. The simplest explanation for this fact is that some countries are larger than other countries (in terms of GDP or wealth) and therefore have a larger pool of potential investors (Barba Navaretti and Venables, 2004). However, various international business and international economics theories argue that there are particular home country characteristics that favor headquarters, particularly MNCs. In the international business literature, home country determinants of outward corporate connections are predominantly based on ownership and internalization advantages. Ownership advantages refer to the firm's (intangible) assets to which other (foreign) firms cannot easily get access and which provide a MNC certain market power over others. Internalization advantages date back to Buckley and Casson (1976) and are advantages which make it more profitable for firms to internationalize through FDI than through trade or licenses. Some of these ownership and internalization advantages are home country specific in the sense that they are shared by all firms having their home base in that particular country (Dunning, 1993). Following Hymer (1976), the home country-specific ownership advantages arise from access to resources that are abundant in the respective home country, such as availability of economic resources, technology and skills. In terms of economic resource availability, one should not only consider GDP or wealth, but also well-functioning capital markets. Di Giovanni (2005) shows that firms located in home countries, with developed domestic capital markets, have better opportunities to invest abroad. Likewise, technological development in the home country promotes outward FDI, providing firms with a competitive advantage over foreign firms (Narula and Wakelin, 1998). Finally, an economy's openness promotes FDI by facilitating the financing of projects abroad, gaining foreign market information and offering an opportunity to fight import competition (Kyrkilis and Pantelidis, 2003). Host Country Determinants A host country must offer a location advantage to a firm that is interesting enough to attract a plant in that country rather than in the home country. Hence, expectedly, host countries that are relatively more attractive, will receive more FDI and, hence, will be more central in terms of connectivity to the global corporate network. A similar view can be found in international economics, in which comparative advantages of countries are perceived as pull factors' which attract MNC investments. The relative importance of these different factors depends on the motivation of firms to take on a part of the production process abroad. Dunning (1993; 1998) distinguishes between four motivations of firms to internationalize the production process.
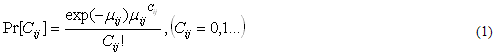
Apart from these motivations to internationalize, literature on host country determinants of FDI and corporate relationships has also drawn attention to the quality of institutions in the host country. A bad institutional environment may deter investments as it increases the costs of doing business and raises uncertainty. Daude and Stein (2007) found that corruption, unpredictability of policies, and excessive regulatory and deficient enforcement of property rights, have a negative effect on FDI inflow. Benassy-Quéré et al. (2007) concluded that not only bureaucracy, quality of the legal system and corruption are important determinants of FDI, but also the quality of the credit market. Bilateral Determinants Besides home and host country characteristics, the structure of the global corporate network is influenced by country-pair specific characteristics. These bilateral' determinants can be related to transaction costs, the tradeoff between FDI and trade, and differences in factor endowments between countries. First, bilateral variables can reflect the transactional distance' (cf. Obstfeld and Rogoff, 2000) between two countries, where distance is interpreted as a multi-faceted concept that keeps countries separated by creating transaction costs (Linders et al., 2008). Literature shows that these barriers still tend to obstruct the creation of economic linkages between countries. In this light, one can distinguish between tangible and intangible barriers. Tangible barriers concern those that are directly observable in terms of their effect on the costs or quantity of producing abroad. Examples are transport barriers (transportation, communication and time costs) and trade policy barriers (absence of free trade agreements, tariffs, and import and export quota). Intangible barriers are barriers that cannot be observed in terms of a monetary or quantitative restriction and are related to trust and understanding, herewith reducing uncertainty in transactions and reducing the costs of doing business. Intangible barriers to FDI include cultural and institutional distance between countries (Globerman and Shapiro, 2003; Linders et al., 2008). However, the relationship between tangible barriers to FDI and the number of corporate relationships between countries is far from clear. It is often argued that FDI can be both a substitute and complement to international trade (Markusen, 1995). In other words, trade costs raises the costs of doing business abroad, but at the same time may promote FDI in place of exports. It can be expected that vertical FDI is complementary to trade and distance discourages FDI because of the trade costs related to the shipment of intermediate inputs to the host country and/or finished products back home. On the contrary, horizontal FDI replaces exports if the trade costs to gain market access are high. However, according to Neary (2009), horizontal FDI may take the form of export-platform FDI, in which a foreign plant serves not only the host country, but also surrounding countries that are situated within the same free trade area (e.g., European Union). In this case, there would also be a negative relationship between trade costs and FDI. On a similar note, in case of market-seeking horizontal FDI, there tend to be more corporate relationships between countries that are relatively similar in size and in relative endowments. The argument here is that if there are too large differences between countries, all plants are placed in the location that is preferred in terms of location advantages (Markusen and Maskus, 2001). In case of efficiency-seeking vertical FDI, corporate relationships tend to arise between countries that differ in factor endowments as this type of investment is primarily driven by production cost differences. From the Poor to the Rich and the Happy FewThe determinants outlined above constitute a general framework to study the structure of global corporate networks. However, Blonigen and Wang (2004) indicate that the determinants of FDI vary systematically across developed and developing countries, and, hence, pooling of FDI from/into developing and developed countries would be undesirable (see e.g. also Collier, 2006). Accordingly, the factors that distinguish the poor from the rich in the global corporate network are different from the factors that distinguish the rich from the happy few. First of all, it is often argued that the motivations of firms to internationalize into rich (developed) countries are different from the motivations of firms to internationalize into poor (developing) countries. According to Dunning (2003), recent flows of FDI to rich countries have been mainly horizontal in nature and are provoked by market-seeking and asset-seeking motives. On the contrary, recent FDI into poor countries can be best characterized as market-seeking, natural resource-seeking and efficiency seeking. In this way, MNCs increasingly relocate some of their production plants to the cheapest developing countries for exports to third markets and the reduction of production costs. Whereas FDI into rich countries is mainly targeted at securing or augmenting the competitive advantages of the firm, FDI into developing countries is mainly targeted at accessing markets, cheap production and acquiring resources (Narula and Dunning, 2000; Dunning, 2003). Secondly, and most importantly, the determinants of outward FDI from rich countries are different from that of poor countries (Dunning et al., 2008). This makes it possible to distinguish the rich from the happy few. Although large countries (France, Germany, Japan, United Kingdom, and United States) typically export more FDI, this does not explain the prominent position of relatively small countries like Switzerland and the Netherlands in the global corporate network, compared to other small rich countries such as Finland and the United Arab Emirates. Recently, attention has been drawn to credit provision in the home country as one of the most important explanations for differences between rich countries in outward FDI (Razin et al., 2004; Di Giovanni, 2005; Baker et al., 2009). Razin et al. (2004) argue that countries with relatively high setup costs related to the technological and financial ease by which a foreign subsidiary is expanding export less FDI. In this, particularly the provision of cheap financial capital, provides financial means for MNCs to expand and grow rapidly and decreases the risk and uncertainty. These cheap channels of capital primarily originate from high levels of domestic stock market capitalization and the ensuing low-cost capital available to overvalued parents in the home countries (Di Giovanni, 2005; Baker et al., 2009) and the degree of credit provisions by banks and other financial institutions in the home country (Di Giovanni, 2005). In this, it is at least remarkable that small countries (Netherlands, Switzerland) with a large number of outgoing connections, are also host of large stock markets (Amsterdam, Zurich). Research DesignData on Corporate ConnectionsIn our analysis, we use the total number of corporate connections between a home (headquarter) country and host (subsidiary) country as an indication of the strength of the corporate connection between two countries. More specifically, the data used in this study is similar to that of Godfrey and Zhou (1999) and Alderson and Beckfield (2004), as it concerns the Fortune Global 100 multinationals (2005). These 100 headquarters accounted for 27% of OECD revenue in 2005, indicating the economic importance of these firms. If the revenues of their subsidiaries were included this would amount to roughly 50% of OECD revenue. Next, the subsidiaries of these headquarters and their different levels of ownership were extracted from the LexisNexis Directory of Corporate Affiliations (2005)5. This resulted in a dataset of 9243 ownership relations, of which 4638 prove to be domestic linkages and 4605 transnational. By strictly focusing only on transnational corporate connections and excluding linkages to host countries for which one or more important independent variables were missing, a resultant dataset of 4321 relations remained6. By aggregating the data to the national level, a global corporate network between countries was constructed between 43 home countries with at least one outgoing corporate connection and 110 host countries that have at least one incoming corporate connection, listed in Appendix A. Excluding domestic connections between countries, there are 4687 ((43*110)-43) country-pairs in the global corporate network. A more elaborate description of the data construction can be found in Wall (2009). As indicated in the introduction, the global corporate network is disproportionate. Firstly, most outgoing corporate connections are held by only a few (rich) home countries. Here, the United States (1192 outgoing connections), Germany (850), France (457), Japan (448), Switzerland (365), the United Kingdom (351), and the Netherlands (330) are most prominent. Overall, these countries hold about 93% of all outgoing connections, indicating that MNCs are particular about their localities. A similar, yet less disproportionate pattern is seen, with respect to host country connectivity, where the top 10 countries (United States, United Kingdom, Canada, Germany, France, China, Netherlands, Spain, Australia and Italy), hold approximately 50% of all incoming relationships. In general, African and South American countries are underrepresented in the network7. Yet, disproportionality does not only exist between rich and poor countries, but also within the group of rich countries, creating a division between the rich and the happy few. With respect to bilateral connections, the global corporate network reveals similar unevenness, since only 1% of the country pairs hold roughly 45% of all corporate connections. With regard to the top 5 strongest transnational connections, the United States always is involved either as a home or host country. Hence, Germany-United States (150 corporate connections), United States-Canada (136), United States-United Kingdom (112), Japan-United States (106), and United States-Germany (84). Strikingly, there is no corporate connectivity between over 85% of the country-pairs. Count Data Models and Modified Poisson EstimationThe number of connections between countries in the MNC network can be perceived as count data, as these variables count' the number of times something has occurred. Although count data is often treated as if it where continuous, estimation by Ordinary Least Squares (OLS) in a linear regression framework, often results in inefficient and biased estimates of the parameters (Long, 1997). A more extensive discussion of this issue can be found in Burger et al. (2009). Hence, the use of alternative regression techniques would be more appropriate. Probably the most common regression model applied to count data is the Poisson regression. Applying a Poisson regression, it can be conjectured that a the number of corporate connections Cij between home country i and host country j has a Poisson distribution with a conditional mean (μij) that is a function of a number of independent variables (1). As Cij is assumed to have a non-negative integer value, the exponential of the independent variables is taken, so that μij is compelled to be zero or positive. More formally,
in which the conditional mean μi is linked to an exponential function of a set of explanatory variables
where α0 is a proportionality constant, Xi, Xj and Xij with corresponding parameters β, γ, φ are 1 x k row vectors of explanatory variables related to the home country characteristics, host country characteristics and bilateral relationships between home and host countries respectively. An important condition of the Poisson regression model is that it assumes equidispersion, which means that the conditional variance should be equal to the conditional mean. However, most often the conditional variance is higher than the conditional mean, which suggests that the dependent variable is overdispersed. In a Poisson model, standard errors are typically downward biased, which results in an increased risk of finding significant relationships where in fact no significant relationships exist (Gourieroux et al., 1984). In order to correct this, a negative binomial regression model can be employed8. In contrast to the Poisson model, the negative binomial model includes an additional parameter, which captures the degree of overdispersion. More technical discussions of the negative binomial regression model can be found in Greene (1994) and Long (1997). CovariatesTo explain the geography of global corporate networks, we include variables measured at the level of the home country and host country as well as bilateral variables, as discussed in section 2.2. Table 1 provides summary statistics of the variables included in the models and their expected sign. Note that all variables are in natural logs, except for dummy variables, quality of institutions, corporate taxes, and sectoral complementarities. Table 1: Summary statistics of variables and expected effects.
At the home country level we include variables related to the home country specific ownership and internalization advantages available to firms in that country. The Gross Domestic Product (GDP) and GDP per worker in a home country measure the potential pool of investors and the abundance of capital present. Remoteness is measured as the average distance of a country to all other countries in the world and indicates the geographical position of a home country. In this, it is expected that home countries that are more remote have more difficulties generating outward corporate connections. The technological abundance of a host country is measured by the average share of high technology exports in the volume of manufacturing exports over the period 2000-2006 and is obtained from the World Development Indicators Database. With respect to the financial depth and climate of the home country, we introduce three variables: the size of the stock market relative to GDP, which we term stock market capitalization, and the domestic credit provided to the private sector relative to GDP, which we label credit provision (Di Giovanni, 2005). For both these variables the average of the period 2000-2006 is taken. Finally, we control for the fact that some home countries are more protectionist and domestically oriented than others, by including a variable for the openness of the national economy. This variable is measured by a home country's exports and imports divided by its GDP. At the host country level we include variables related to the motivations to invest abroad and the quality of institutions in the host country. Related to market-seeking motives, we include market size and remoteness. In line with the market seeking FDI hypothesis, larger countries in terms of GDP tend to be more attractive to MNCs as MNCs are then able to serve a larger market. In this, remoteness is included to control for the geographical position of countries and it can be expected that countries that are more remote will receive more incoming connections, as they have to compete with fewer countries. Related to efficiency seeking motives, we include GDP per worker and corporate taxes as covariates, where corporate taxes are measured as the total tax rate as percentage of the profit. In this, it should be noted that GDP per worker reflects both the level of development as well as wage costs in a country and hence, the expected sign is left undetermined. Natural resource seeking motives are captured by fuels exports as percentage of total exports (Bond and Malik, 2009), while asset seeking motives are measured by high technology exports divided by total manufacturing exports. We control for the institutional environment by taking in the openness of a host country and the quality of institutions in the host country. In this, the quality of institutions is based on Kaufmann's six dimensions of governance quality (Kaufmann et al., 2004). These dimensions include voice and accountability, political stability, effectiveness of government, quality of regulation, rule of law, and control of corruption. All these indicators are constructed on the basis of factor analysis and reflect different aspects of the quality of governance. A more detailed description of these dimensions can be found in Kaufmann et al. (2004). Finally, we include bilateral variables related to tangible and intangible barriers to the formation of corporate connections. Physical distance between home and host country create transactions costs in terms of transportation, communication and time costs. Here, physical distance is measured as the straight line distance between countries (as the crow flies'), using the capital city of each country as the centre of gravity. The Regional Integration Agreement (RIA) dummy indicates whether countries are both members of the same regional integration agreement and is determined on the basis of OECD data on major regional trade agreements. Note that if corporate connections between countries are predominantly horizontal, we expect a negative effect of the RIA dummy. On the contrary, if the corporate connections are predominantly vertical, we expect a positive effect of the RIA dummy. The cultural-historical distance between countries is measured by whether countries have the same official language and a historical relationship. To assess whether countries have the same official language, we use a database collected by Haveman that distinguishes between fourteen languages. The language dummy variable reflects whether or not two countries have a common official language. Similarly, the history dumm y variable takes the value of only one country, if two countries had, or have, a colonial relationship, or even if they were once part of the same country. This variable is constructed on the basis of CEPII data (http://www.cepii.org). Finally, we also include variables related to the difference in size and production structure between countries. The size difference between countries is measured as the difference in GDP between the countries. Differences in production structure, which we label sectoral distance are measured using a Kogut-Singh (1988) index. In this, we use the share differences from six broad sectors (agriculture, manufacturing, construction, wholesale, transport and services) in the total economy of the home and host countries. Information on the production structure is obtained from the UNCTAD database (http://www.unctad.org). In case of horizontal motives to invest abroad, corporate relationships will be disproportionally present between countries that are relatively similar in size and relative endowments. Empirical ResultsDeterminants of the Structure of Global Corporate NetworksRegarding the analysis of corporate connectivity between countries, the negative binomial regression model proved to be more appropriate than its Poisson counterpart. All regression models are calculated using the White estimator (robust standard errors) to account for heteroskedasticity (Santos Silva and Tenreyro, 2006). Models 1-4 in Table 2 present the estimates for the negative binomial regression model on corporate connectivity. In this, we estimate models including observed home country and host country variables and models including home and/or host country fixed effects. We estimate fixed effects models to account for unobserved host and/or home country-specific characteristics that may have an impact on the remaining parameters. In particular, the bilateral variables may erroneously pick up the effect of the omitted host and/or home country variables, resulting in biased parameter estimates (Andersen and Van Wincoop, 2003). Moreover, these fixed effects models also satisfy the constraints on total host country outflows and home country inflows (Bröcker, 1989). Turning to the main results, it can be inferred that home country-specific ownership advantages (Model 1 and 2) play an important role in explaining the geography of corporate networks. First of all, the size and wealth of the home country have a positive and significant effect on the corporate connectivity between countries. An increase in home country GDP by 1% increases the expected corporate connectivity by over 1.3% while an increase in GDP per worker by 1% increases the expected corporate connectivity by about 0.23%. This not only signifies that the size of the pool of potential investors is an important determinant of the geography of global corporate networks, but also that the availability of economic resources matters. Besides size and wealth, other home country specific ownership advantages appear to be important, such as a home country's degree of openness, remoteness, level of technology, and stock market capitalization. In this, the expected number of connections originating from countries that are less remote, more open and more financially developed, are generally higher. However, the effect of home country's credit provision on the number of bilateral relations appears to be insignificant. With respect to the host country effects (Model 1 and 3), it can be observed that market size, GDP per worker, remoteness, openness, level of technology and quality of institutions have a statistically significant effect on the expected corporate connectivity. This signifies that a mixture of market seeking, efficiency seeking and strategic asset seeking motivations of firms shape the geography of global corporate networks. In this, the expected corporate connectivity increases with the market size, openness, and quality of the institutional environment of the host country and decreases with the wage level of the host country. In addition, host countries that are more remote have a higher expected number of incoming connections. This can be explained by the fact that more remote countries (e.g., Australia, New Zealand) face less competition from other countries when serving as subsidiary locations of MNCs that wish to serve their local markets. From the perspective of export platform FDI, it can be argued that countries that are part of a smaller set of alternatives will receive more FDI. Comparing the host and home country determinants, two important observations can be made. First, the estimated effect sizes of host country characteristics appear to be much larger than those of the home country. This underlines the fact that the distribution of outward connections is more uneven than the distribution of incoming connections and provides an indication that MNCs are much more demanding with respect to the characteristics of their headquarter location than with respect to the location of their subsidiaries. With respect to the bilateral variables (Model 4), we find that physical distance, cultural proximity and difference in GDP all have a statistically significant effect on the expected number of corporate connections, while we do not find an effect of having a Regional Integration Agreement on the expected corporate connectivity. Taking the effects of the host country and bilateral variables together, it can be inferred that most FDI is indeed horizontal and not vertical. First, the market- and strategic asset-seeking motives (exemplified by GDP, remoteness, openness, and technology exports variables) appear to be more important than the efficiency seeking and natural resource seeking motives (mainly exemplified by the GDP per worker and fuel exports variables). Secondly, the expected number of connections is higher in country pairs in which countries are similar in size, while having a RIA does not negatively affect the expected number of corporate connections between countries. Table 2: Negative Binomial Pseudo Maximum Likelihood Regression on the Number of Corporate Connections between Countries
The Poor, the Rich and the Happy FewModels 5-15 in Tables 3A-3C present the estimates for the negative binomial regression model on corporate connectivity for different subsamples of the dataset. In our analyses, we divided the sample into the richest countries (20%) and the poorest countries (80%; which also include countries with intermediate GDP per capital levels) and estimated models including host country fixed effects (Models 5-7), home country fixed effects (Models 8-11) and home and host country fixed effects (Models 12-15)9. Models 5-7 analyze the determinants of the corporate connectivity between countries, restricted to corporate connections that originate from rich countries. Compared to the models including rich and poor home countries (1-4), now both the home country's degree of stock market capitalization and the degree of credit provision to the private sector have a positive and significant effect on the number of connections. Moreover, the effect of the home country's stock market capitalization on connectivity is significantly larger within the subset of corporate connections originating from rich countries compared to the total sample (Χ2 = 49.9, p<0.01)10. Within the subset of rich home countries, an increase in the home country's stock market capitalization by 1% increases the corporate connectivity between two countries by 1.06%. Likewise, an increase in the degree of domestic credit provision to the private sector in the home country by 1% increases the corporate connectivity between two countries by 0.56%. In this, there are no significant differences between corporate connections from rich to rich countries and corporate connections from rich to poor countries. Hence, the degree of financial development is a very important factor of separating the rich from the happy few in the global corporate network. On the contrary, the degree of technological abundance in the home country appears to be a less important determinant of the corporate connectivity between countries. This can be explained by the fact that rich countries do not differ much in their levels of technological sophistication. Comparing the subset of corporate connections into rich countries with the subset of corporate connections into poor countries (Models 8-11), a number of important differences can be observed with respect to the host country determinants of corporate connectivity. First of all, the number of connections targeted at poor countries is more driven by low wage costs (Χ2 = 3.82, p=0.05), while the number of connections targeted at rich countries is more driven by low corporate taxes (Χ2 = 14.48, p<0.01). Second, the host country's market size access is more important for connections targeted at rich countries than for connections targeted at poor countries (Χ2 = 3.84, p=0.05). Similar results are obtained when comparing corporate connections among rich countries with corporate connections between rich and poor countries. These findings can be linked to the differences of the nature of the economic activities conducted by MNCs in rich and poor countries. Whereas FDI into poor countries is more often related to labour-intensive activities such as manufacturing, FDI into rich countries is more targeted at services (Blonigen and Wang, 2004). However, these findings do necessarily imply that corporate connections into poor countries are more efficiency-seeking than corporate connections into rich countries. Yet, when comparing the bilateral determinants for the subsets of corporate connections into rich countries and corporate connections into poor countries (Models 12-15), we find that the effect of a regional trade agreement on the number of bilateral connections targeted at poor countries is significantly higher than the effect of a regional trade agreement on the number of bilateral connections targeted at rich countries (Χ2 = 8.58, p<0.01). This suggests that corporate connections into poor countries are more vertical, in that lower trade costs stimulate linkage formation. This observation is supported by the lower coefficients for physical and cultural distances for the subset of rich host countries. Moreover, whereas the difference in GDP has a negative and significant effect on the number of bilateral connections targeted at rich countries, it has no effect on the number of bilateral connections targeted at poor countries. Table 3A: Host-Country Constrained NBPML Regression on the Number of Corporate Connections between Countries.
Table 3B: Home-Country Constrained NBPML Regression on the Number of Corporate Connections between Countries.
Table 3C: Home and Host Country Constrained NBPML Regression on the Number of Corporate Connections between Countries.
ConclusionIn contrast to authors advocating the convergence of the world economy (O'Brien 1992, Cairncross 1997, Friedman 2005), this study shows that the world economy, at the start of the 21st century, remains strongly disproportionate - forming a complex organization of activities at different geographic scales. However, there are not only vast differences in connectivity to the global corporate network between rich and poor countries, but also within the group of rich countries. This unevenness can be explained by various home country, host country and bilateral determinants, analyzing the overall configuration of the MNC network and different cross-sections of country pairs within the network. Using negative binomial estimations on the number of corporate connections between countries, we obtained that MNCs particularly prefer to locate their headquarters and subsidiaries close to production and consumer markets. In this, MNCs are more particular about the location of headquarters than about the location of their subsidiaries. In addition, transactional distance between countries in the form of physical and cultural distance still keeps countries apart in the global playing field. Our results are also in line with the empirical literature on FDI, in which it is shown that most FDI is horizontal, market-seeking and strategic-asset seeking instead of vertical, natural resource-seeking and efficiency-seeking (Barba Navaretti and Venables, 2004). However, the determinants of connectivity to the global corporate network vary systematically across rich and poor countries and the factors that distinguish the poor from the rich are different to those that distinguish the rich from the happy few. Analyzing the subset of corporate connections originating from rich countries, it was found that particularly the effect of the home country's stock market capitalization on connectivity is significantly larger within the subsample of corporate connections originating from rich countries compared to the total sample of corporate connections. Hence, the degree of financial development is an essential factor separating the rich from the happy few It is also shown that the number of connections targeted at poor countries, is driven by low wage costs in these countries, while those targeted at rich countries are driven by low corporate taxes. Also, a country's market size is more important for connections targeted at rich countries, than at poor countries. These findings reveal differences in economic activities conducted between countries, where connections into poor countries is primarily related to labor-intensive activities, and FDI into rich countries is mainly targeted at services. In addition, FDI into poor countries is more natural resource-seeking and efficiency-seeking than FDI into rich countries. Our structural findings of the global corporate network indicate that the world has not changed much since Hymer in 1972 postulated the corporate unevenness of nations and in which today the same handful of persistent headquarters still tend to dominate the global arena, from which can be inferred that the structure of global corporate power reinforces core dominance. In this light, such developed nations still serve as the command and control centers of the global economic network, in which the majority of all corporate connections remain strictly active between these fortunate countries. These happy few have everything which makes them both an attractive home and host country for FDI: from a large consumer and producer market to a high degree of stock market capitalization and credit provision to finance activities overseas. It is then also in the light of the current financial crisis interesting to see whether the happy few will retain their position in the global corporate network in the near future. ACKNOWLEDGMENTS We thank three anonymous referees for their useful comments on an earlier version of this article. All errors remain the authors'. An earlier version of this article was circulated under the title National Competitiveness as a Determinant of Global Corporate Networks'. REFERENCESAlderson A, Beckfield J, 2004, Power and position in the world city system American Journal of Sociology 109 811-851. Amin A, 2002 Spatialities of globalization Environment and Planning A 34 38599. Andersen J E, Van Winccop E, 2003, Gravity with gravitas: a solution to the border puzzle American Economic Review 93 170-192. Andersen J E, Van Wincoop E, 2004, Trade costs Journal of Economic Literature 17 691-751. Andrade G, Mitchell M, Stafford E, 2001, New evidence and perspective on mergers Journal of Economic Perspectives 15 103-120. Baker M, Foley C F, Wurgler J, 2009, Multinationals as arbitrageurs: the effects of stock market valuations on foreign direct investment Review of Financial Studies 22 337-369. Barba Navaretti G, Venables A J, 2004, Multinational Firms in the World Economy (Princenton, NJ: Princeton University Press). Benassy-Qu éré A, Coupet M, Mayer T, 2007, Institutional determinants of foreign direct investment The World Economy 30 764-782. Bernard A B, Jensen J B, Redding S J, Schott P, 2007, Firms in international trade Journal of Economic Perspectives 21 105-130. Bergstrand J H, Egger P, 2007, A knowledge-and-physical capital model of international trade flows, foreign direct investment, and multinational enterprises Journal of International Economics 73 278-308. Blonigen B A, Wang M, 2004, Inappropriate pooling of wealth and poor countries in empirical FDI studies, in Moran T, Graham E, Blomstrom M, Does Foreign Direct Investment Promote Development?, Washington, DC: Institute for International Economics, pp. 221-243. Bond S R, Malik A, 2009, Natural resources, export structure, and investment Oxford Economic Papers 61: 675-702. Bordo M, Taylor M, Williamson J, 2005, Globalization in historical perspective, Chicago, The University of Chicago Press. Brakman S, Garretsen H, 2008, Foreign direct investment and the multinational enterprise: an introduction, in Brakman S, Garretsen H (eds), Foreign Direct Investment and the Multinational Enterprise, Cambridge, MA: MIT Press, pp. 1-10. Brakman S, Garretsen H, Van Marrewijk C, 2006, Comparative advantage, cross-border mergers and merger waves: international economics meets industrial organization CESifo Forum 1/2006 22-26. Brakman S, Van Marrewijk C, 2008, It's a big world after all: on the economic impact of location and distance Cambridge Journal of Regions, Economy and Society 1 411-437. Bröcker J, 1989, Partial equilibrium theory of interregional trade and the gravity model Papers in Regional Science 66 7-18. Buckley P J, Casson M C, 1976, The Future of the Multinational Enterprise (London: Homes & Meier). Burger M J, Van Oort F G, Linders G J M, 2008, On the specification of the gravity model of trade: zeros, excess zeros and zero-inflated estimation Spatial Economic Analysis 4 167-190. Cairncross F, 2001, The death of distance: how the communications revolution is changing Cambridge MA, Harvard Business School Publishing. Cameron A C, Trivedi P K, 1986, Econometric models based on count data: comparisons and applications of some estimators and tests Journal of Applied Econometrics 1 29-53. Carroll W K, 2007, Global cities in the corporate network Environment and Planning A 39 2297-2323. Carroll W K, 2009, Transnationalists and national networkers in the global corporate elite Global Networks 9 289-314. Castells M, 1996. The Rise of the Network Society. Blackwell Publishers, Oxford. Collier P, 2006. The Bottom Billion. Oxford University Press, Oxford. Cowling K, Sudgen R, 1987, Market exchange and the concept of the transnational corporation British Review of Economic Issues 9 57-68. Daude C, Stein E, 2007, The quality of institutions and foreign direct investment Economics and Politics 19 317-344. Di Giovanni J, 2005, What drives capital flows? The case of cross-border M&A activity and financial deepening, Journal of International Economics, 65, 127-149. Dicken P, 2003 Global Shift: Reshaping the Global Economic Map in the Twenty-First Century (London: Sage). Dicken P, Thrift N, 1992, The organization of production and the production of organization: why business enterprises matter in the study of geographical industrialization, Transactions of the Institute of British Geographers NS 17 279-291. Driffield N, Love J H, 2005, Intra-industry foreign direct investment, uneven development and globalisation: the legacy of Stephen Hymer Contributions to Political Economy 24 55-78. Dunning J H, 1977, Trade, location of economic activity and the MNE: a search from an eclectic approach, in Ohlin B, Hesselborn P O, Wijkman P M, The International Allocation of Economic Activity, London: Macmillan, pp. 395-418. Dunning J H, 1993, Multinational Enterprises in the Global Economy (Wokingham: Addison-Wesley). Dunning J H, 1998, Location and the multinational enterprise: a neglected factor? Journal of International Business Studies 29 45-66. Dunning J H, 2003, Determinants of foreign direct investment: globalisation-induced changes and the role of policies, in World Bank (ed.), Proceedings of Annual World Bank Conference on Development Economics, pp. 279-290 (Washington DC: World Bank). Dunning J H, Kim C, Park D, 2008, Old wine in new bottles: a comparison of emerging market TNCs today and developed country TNCs thirty years ago. SLPTMD Working Paper Series 11. Faeth I, 2009, Determinants of foreign direct investment a tale of nine theoretical models, Journal of Economic Surveys 23 165-196. Friedman T L, 2005, The world is flat: a brief history of the twenty-first century, Farrar, Straus & Giroux. Gabaix X, Ibragimov R, 2010, Rank-1/2: a simple way to improve the OLS estimation of tail exponents Journal of Business Economics and Statistics (forthcoming). Gereffi G, 1994, The organization of buyer-driven commodity chains: how the US retailers shape overseas production, in Gereffi G, Korzeniewicz (eds), Commodity Chains and Global Capitalism, Westport, CT: Praeger, pp. 95-122. Ghoshal S, Bartlett C A, 1990, The multinational corporation as an interorganizational network The Academy of Management Review 15 603-625. Globerman S, Shapiro D, 2003, Governance infrastructure and US foreign direct investment, Journal of International Business Studies 34 19-39. Godfrey B J, Zhou Y, 1999, Ranking world cities: multinational corporations and the global urban hierarchy Urban Geography 20 268-281. Gourieroux C, Montfort A, Trognon A, 1984, Pseudo maximum likelihood methods: applications to Poisson models Econometrica 52 701-720. Greene W H, 1994, Accounting for excess zeros and sample selection in Poisson and negative binomial models, Working Paper 94-10, Stern School of Business, New York University. Head K, Ries J, 2008, FDI as an outcome of the market for corporate control: theory and evidence Journal of International Economics 74 2-20. Henderson J, Dicken P, Hess M, Coe N, Yeung H W-C, 2002, Global production networks and the analysis of economic development Review of International Political Economy 9 436-464. Harvey D, 1982 The Limits to Capital (Oxford: Blackwell). Hymer S H, 1972, The multinational corporation and the law of uneven development. in Bhagwati, J N (ed.), Economics and World Order from the 1970s to the 1990s, London: Collier-MacMillan, pp. 113-140. Hymer S H, 1976, The International Operations of National Firms: A Study of Foreign Direct Investment (Cambridge, MA: MIT Press). Kaufmann D, Kraay A, Mastruzzi M, 2004, Governance matters III: governance indicators for 1996, 1998, 2000, and 2002 World Bank Economic Review 18 253-287. Kogut B, Singh H, 1988, The effect of national culture on the choice of entry mode Journal of International Business Studies 19 411-432. Kyrkilis D, Pantelidis P, 2003, Macroeconomic determinants of outward foreign direct investment International Journal of Social Economics 30 827-836. Linders G J M. Burger M J, Van Oort F G, 2008, A rather empty world: the many faces of distance and the persistent resistance to international trade, Cambridge Journal of Regions, Economy and Society 1 439-458. Long J S, 1997 Regression Models for Categorical and Limited Dependent Variables (Sage, Thousand Oaks, CA). Loungani P, Mody A, Razin A, 2002, The global disconnect: the role of transactional distance and scale economies in gravity equations Scottish Journal of Political Economy 49 526-543. Mayer T, Ottaviano G., 2007, The happy few: new facts on the internationalisation of European firms. Bruegel-CEPR EFIM 2007 Report, Bruegel Blueprint Series. Markusen J R, 1995,The boundaries of multinational enterprises and the theory of international trade Journal of Economic Perspectives 9 169-190. Markusen J R, Masus K, 2001, General-equilibrium approaches to the multinational firm: a review of theory and evidence. NBER Working Paper 8334. McCann P, 2008, Globalization and economic geography: the world is curved, not flat Cambridge Journal of Regions, Economy and Society 1 351-370. McCann P, Mudambi R, 2004, The location behavior of the multinational enterprise: some analytical issues Growth and Change 25 491-524. McCann P, Mudambi R, 2005, Analytical differences in the economics of geography: the case of the multinational firm Environment and Planning A 37 1857-1876. Narula R, Dunning J H, 2000, Industrial development, globalization and multinational enterprises: new realities for developing countries Oxford Development Studies 28 141-167. Narula R, Wakelin K, 1998, Technological competitiveness, trade and foreign direct investment Structural Change and Economic Dynamics 9 373-387. Neary JP, Trade costs and foreign direct investment, International Review of Economics and Finance 18 207-218. O'Brien R, 1992, Global financial integration: the end of geography, London, Royal Institute of International Affairs Obstfeld V I, Rogoff K, 2000, The six major puzzles in international macroeconomics: is there a common cause?, NBER Macroeconomics Annual 15 339-390. Porter M E, 1990, The Competitive Advantage of Nations (New York: Free Press). Razin A, Rubinstein Y, Sadka E, 2004, Which countries export FDI, and how much? HKIMR Working Paper No. 15/2004. Rugman A, 2005 The Regional Multinationals (Cambridge UK: Cambridge University Press). Santos Silva J C M, Tenreyro S, 2006,The log of gravity The Review of Economics and Statistics 88 641-658. Taylor P J, Ni P, Derudder B, Hoyler M, Huang J, Fengyong L, Pain K, Witlox F, Yang X, Bassens D, and Shen W, 2009, The way we were: command-and-control centres in the global space economy on the eve of the 2008 geo-economic transition Environment and Planning A 41 7-12. Taylor P J, 2004 World City Network: A Global Urban Analysis (London: Routledge). Yeaple, S R, 2006, Offshoring, Foreign Direct Investment, and the Structure of U.S. Trade, Journal of the European Economic Association 4 602-611. Wall R S, 2009, Netscape: Cities and Global Corporate Networks (Rotterdam: Haveka). Wall R S, Van der Knaap G A, 2010, Centrality and structure within contemporary worldwide corporate networks Economic Geography (forthcoming).
APPENDIX A: Countries included in the analysis and their number of outgoing connections and incoming connections
NOTES* R.S. (Ronald) Wall, Corresponding author: IHS and the Department of Applied Economics, Erasmus University Rotterdam, Burgemeester Oudlaan 50, Building T, 14th floor, P.O. Box 1935, 3000 BX Rotterdam, The Netherlands, Email: equator@live.nl, wall@ese.eur.nl ** M.J. (Martijn) Burger, Erasmus School of Economics, Department of Applied Economics, Erasmus University Rotterdam. E-mail: mburger@ese.eur.nl *** G.A. (Bert) van der Knaap, Erasmus School of Economics, Department of Applied Economics, Erasmus University Rotterdam. E-mail: vanderknaap@ese.eur.nl. 1. The parameter values have been estimated using the Zipf regression approach by Gabaix and Ibragimov (2010). 2. See Head and Ries (2008) for a formal theoretical motivation of the FDI gravity model. 3. Note that the determinants presented below are not exhaustive, in that there still may be other factors that can affect the spatial distribution of corporate connections. However, we believe we cover the most important determinants found in the international business and international economics literature. 4. The importance of market size and accessibility is also explicitly discussed in the New Economic Geography literature (see Barba Navaretti and Venables, 2004). 5. This database covers more than 180 000 of the most important headquarters in the world and their respective subsidiaries (see www.lexisnexis.com/dca), organized at different levels of corporate ownership, but also including information on their industrial sectors and country/city locations. 6. These mainly included islands in the Caribbean, Indian Ocean, and South Pacific and some countries in Sub-Saharan Africa with only a few connections in total. 7. Even when focusing on the top 500 instead of the top 100 MNCs, it is shown that of the bottom 400 firms only 27 are found in developing countries, representing only 3% of the total revenue of the top 500 firms. Because countries in the developing world proved to be strongly underrepresented across the entire top 500 headquarters, it is defendable that by using only the top 100 firms, we would not unfairly favor countries in the developed world. 8. In this, the likelihood ratio test of overdispersion (Cameron and Trivedi, 1986) can be used to test whether the negative binomial specification is favoured over the Poisson specification 9. The 20% richest countries in the sample include Australia, Austria, Belgium-Luxembourg, Canada, Denmark, Finland, France, Germany, Ireland, Israel, Italy, Japan, Kuwait, Netherlands, Norway, Qatar, Singapore, Sweden, Switzerland, United Arabian Emirates, United Kingdom, United States. In all these countries, the GDP per capita in 2000 is higher than 17500 US dollars. Number 23 (Spain) has a GDP per capita of less than 14500 US (2000). 10. This was assessed on the basis of a seemingly unrelated estimation and adjoining chi-square test.
Note: This Research Bulletin has been published in Environment and Planning A, 43 (4), (2011), 904-927 |
|||||||||||||||||||||||||||||||||||||||||||||||||||||||||||||||||||||||||||||||||||||||||||||||||||||||||||||||||||||||||||||||||||||||||||||||||||||||||||||||||||||||||||||||||||||||||||||||||||||||||||||||||||||||||||||||||||||||||||||||||||||||||||||||||||||||||||||||||||||||||||||||||||||||||||||||||||||||||||||||||||||||||||||||||||||||||||||||||||||||||||||||||||||||||||||||||||||||||||||||||||||||||||||||||||||||||||||||||||||||||||||||||||||||||||||||||||||||||||||||||||||||||||||||||||||||||||||||||||||||||||||||||||||||||||||||||||||||||||||||||||||||||||||||||||||||||||||||||||||||||||||||||||||||||||||||||||||||||||||||||||||||||||||||||||||||||||||||||||||||||||||||||||||||||||||||||||||||||||||||||||||||||||||||||||||||||||||||||||||||||||||||||||||||||||||||||||||||||||||||||||||||||||||||||||||||||||||||||||||||||||||||||||||||||||||||||||||||||||||||||||||||||||||||||||||||||||||||||||||||||||||||||||||||||||||||||||||||||||||||||||||||||||||||||||||||||||||||||||||||