GaWC Research Bulletin 285 |
|
|
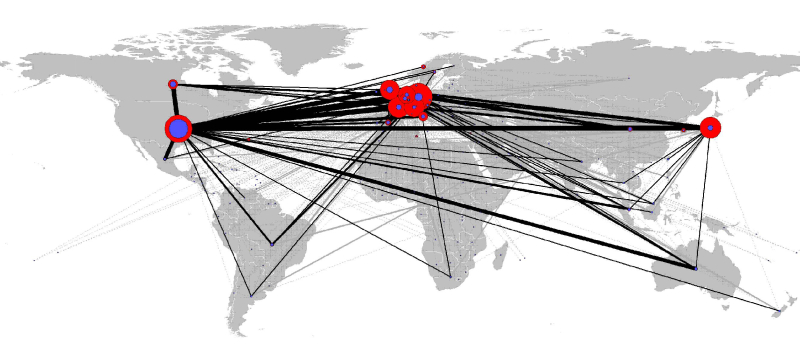
IntroductionAlthough the process of globalization is not an entirely new phenomenon, it is clear that over the past decades significant shifts have occurred in which the capacity to produce and export manufactured goods has been dispersed to an ever expanding network of peripheral and core nations alike (Dicken, 2003). Today the production of commodities span more countries than ever before, with each nation performing specific tasks in which it has a comparative advantage (Gereffi, 1994). Facilitated by reduced transportation costs and advanced communication technologies, this interorganizational system connects firms and states together to form the current global economy, becoming more functionally interdependent than ever before (Hirst and Thompson, 1996). Within contemporary globalization, it is generally accepted that multinational corporations (MNCs) form the basic unit of global production and integration. Furthermore, it has been shown that MNCs are wealthier than most countries in the developing world (United Nations, 2002). MNCs are characterized by their power to coordinate and control operations of other firms in more than one country, which is the resultant of direct cross-border investment of one firm into another, in which a degree of control over that firm is achieved. This trend originated in the 1960s ‘golden age’ of economic growth, in which it can be seen that foreign direct investment grew at twice the rate of global GNP and 40% faster than world exports (Dicken, 2003). This has led to multilateral alliances between firms in which they compete to gain access to markets; share increasing costs, risks and uncertainties; but also gain access to new technologies; and creates economies of synergy by pooling resources and rationalizing production (Kang and Sakai, 2000). In this system MNC headquarters and their various subsidiaries are strategically situated at locations on the global transportation and communication networks, utilizing external services, labour market skills, and proximity benefits (Dicken, 2003). The worldwide diffusion of production has been facilitated by the emergence of a ‘world society’ that has legitimized the penetration of foreign interests into less developed countries (Meyer, 1997). Nonetheless, although international integration is evident, the distribution of MNC networks remains persistently disproportionate (Carroll, 2007), where these firms create a division of labour between nations that corresponds to the division of labour between different levels of corporate hierarchy (Hymer, 1972). Because MNCs centralize high-level decision making and advanced production in only a handful of nations, the rest of the world is generally confined to lower levels of activity and income. Therefore, the notion of territoriality is best encapsulated by the geographical imbeddedness of capital, because capital’s existence requires the creation of relatively fixed, secure and largely immobile social and physical infrastructures (Harvey, 1982). In this light, it is interesting to investigate the uneven distribution of clustered economic activities in the world and how these places are interconnected. To better understand the world economic system in this way, it becomes less necessary to understand how each component part works in detail, but instead how these components are connected (Ommerod, 2005). Hence, network analysis serves as a unique method to reveal the MNC system, because such ‘objects obtain significance as a consequence of their relationships to other objects’ (Harvey, 2006), determined by properties of nodes and linkages. Today, several researches exist that empirically explore worldwide economic networks - for instance, the corporate ties of the world’s largest MNCs (Alderson and Beckfield, 2004) and worldwide inter-corporate directorships (Carroll, 2007). Both these studies are successful in showing the unevenness of the world economic system, but stress that future research should investigate the relationship between attribute data and corporate network data. In this way, network research can become meaningful to development studies. This is the main contribution of our paper, where the strength of corporate connectivity will be explained through Porter’s concept of competitiveness of nations. The corporate connectivity data compiled for this paper is defined as a measure of the sharehold relationships that a MNC has with its subsidiary firms. This intra-firm network represents corporate governance or the chain of command as it is passed down from headquarters to various subordinate levels of firms. The corporate network data has been compiled using the global Fortune 500 (2007), where only the top 100 headquarters were selected, because in our analysis these claimed over 50% of the total revenue and 40% of the employment of all 500 firms. Furthermore, these MNCs claimed 27% of all OECD revenue. Next, by reviewing the annual reports of these firms, their subsidiaries were extracted and classified into various orders of sharehold relations and national location (Wall, Sleegers and v.d. Knaap, 2007). This resulted in a dataset of 9243 sharehold relations By mapping this data, the spatial configuration of the corporate networks was revealed (Figure 1). In this, the distribution of corporate shareholds between nations is clearly polarized into the three core regions of North America, Europe and Pacific Asia. In fact these regions claim 98% of all outwardly directed relations over other nations, displaying a disproportionate power over the world. Furthermore, these areas claim 82% of all incoming relations, showing how dependent the world is on these cores. It is evident that a clear North-South divide still exists, where Africa for instance only holds approximately 1% of MNC relations. It is also evident that although there is a clear East-West connectivity, that the highest intensity prevails in the transatlantic zone between Europe and North America. Figure 1: Geographic Information System (GIS) map representing transnational corporate shareholds (2006/2007)
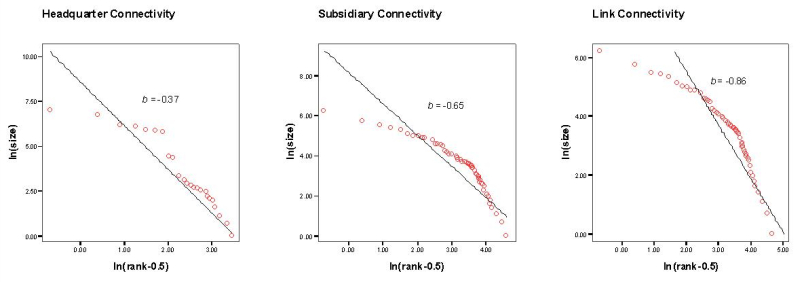
The disproportionality of the world’s economic backbone is further exemplified in the three graphs below (Figure 2). In the first graph the number of MNC headquarter (outdegree) located in nations is seen, the second graph depicts the number of subsidiaries (indegree) of MNCs per nation, while the last graph illustrates the bilateral linkages between nations. In all these images it is seen that the log distribution is roughly linear, representing high disproportionality within the world corporate system1. Figure 2: Disproportionality of the global corporate control network: Zipf regressions for (1) the total headquarter connections of nations; (2) the total subsidiary connections of nations; and (3) the bilateral connections between nations
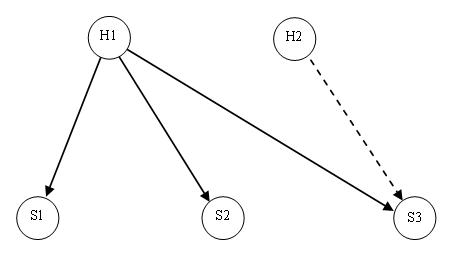
Given the disproportionality of the global corporate control network, two central research questions are posited, which will be further explored within the rest of this paper. Firstly, why are some nations better connected than others? This in terms of (a) headquarter connectivity (number of outgoing linkages) ‘within’ nations; and (b) in terms of subsidiary relations (number of incoming relations). Secondly, which factors determine the linkage strengths ‘between’ nations? The differences of these questions can be best explained by means of the provided network diagram (Figure 3). In this we see that an MNC headquarter (H1) is situated in a particular country, with three subsidiaries (S1, S2, and S3) in other countries. The arrow direction indicates that (H1) owns shares in these three subsidiaries, which in network analysis terminology is called the ‘outdegree’. In this case, headquarter country (H1), has an outdegree of three. It is a measure of how much economic power a country exerts over others, which refers to research question 1a. Conversely, the three subsidiary countries each have one incoming sharehold from (H1), called the ‘indegree’. This in turn is a measure of the dependency of other nations upon a particular nation, and refers to research question 1b. Furthermore, looking at subsidiary nation (S3), it is clear that it also has an inward sharehold from (H2), meaning that it has a total indegree of two, hereby showing that indegree is also dependent on the number of headquarter nations that connect with a particular subsidiary nation. Hence, questions 1a and 1b concern the total connectivity of nations. This is essentially very different to research question 2, which instead concerns explaining the linkage strengths between countries. For this a more complex statistical model is required, which is explained further on in the paper. Lastly, it should be clear that national competitiveness indicators are used in this analysis to statistically determine the various network strengths. Figure 3: Diagram of headquarter and subsidiary relations
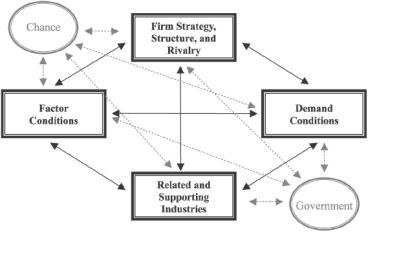
Although in popular discourse it is often argued that in the present day and age MNCs can locate their production plants all over the globe and geography has become irrelevant (Cairncross, 2001; Friedman, 2007), the world is certainly not ‘flattening’ (Linders et al., 2008, McCann, 2008). In actual fact, MNCs still choose their headquarter location and subsidiary locations carefully based on qualitative characteristics of the countries (Brakman and Van Marrewijk, 2008). Although some countries are clearly larger and geographically less remote than others, economic and geographic differences alone would not justify such disproportionality in the corporate control network. In this article, we draw attention in particular attention to the concept of competitiveness as driver behind this disproportionality. In his seminal work The Competitive Advantage of Nations, Porter (1990) showed that corporate and national successes are interdependent, based on the development of skills and knowledge of particular industries, and by the connecting of clusters of internationally successful business to particular attributes of their national home-bases. Therefore, taking the analysis a step further, an important contribution of this paper, is to empirically show how attributes in terms of competitiveness (such as institutional quality, technological readiness and business sophistication) determine the relational corporate connectedness of countries and the number of connections ‘between’ countries. Using the World economic Forum’s ‘Global Competitiveness Index’ (Porter et al, 2007) as indicator of competitiveness (based on institutional quality, technological relatedness and market efficiency), our results are aimed at showing that competitiveness is of critical importance for the headquarter connectivity of countries and to a lesser extent of importance for the subsidiary connectivity of countries in the global corporate control network. Theoretical FrameworkFirms and Nations within a Globalizing WorldThe contemporary global economy can be regarded as a state of competition that is continuously subjected to major shifts of competitive advantage in the global market place (Cerny, 1991). These shifts are not new, as the world has been episodically subjected to similar spurts during the history of capitalism (Harvey 1989; Castells 1996), However, although not new, it is clear that this process has intensified over the last three decades, driven primarily by competitive market mechanisms, technological change, and space-time compression – which subsequently has resulted in the increased global reach of multinationals (UNCTAD, 1996). Since the 1970s, the global dispersion of production has proliferated as corporations increasingly sought lower wages, proximity to markets and resources, and a ways to redistribute their labour (Sassen, 1991). This process has led to the current geographic dispersion of headquarters and their subsidiaries, and the further expansion of global commodity chains. In pursuit of cost reduction and profit maximization, these firms utilize their commodity chains in order to organize value added production stages, coordinate various levels of distribution, employ a governance structure which controls the allocation of resources, and facilitate an institutional framework that coordinates between national and international policies (Gereffi, 1994). Nonetheless, although corporate networks are evidently increasing in reach, it is equally apparent that investments are only becoming more concentrated within and between particular nations (Dicken, 2003, Driffield and Love 2005). In this sense, it appears that global corporate networks are only integrating particular nations of the world, resulting in a higher relative polarization between countries. Consequently, this process leads to increasing uncertainty concerning the future of nations within the globalizing economy (Kentor 2005). This raises questions about why certain nations claim higher shares of corporate connectivity, and why the highest interdependency is found only between particular nations. To contextualize these questions we need to further theorize on the interdependency of firms and nations, and how competitiveness leads to disproportionate shares of economic exchange. The Multinational Corporation (MNC)A MNC is a firm that has the ability to coordinate production from a central point of strategic decision making, where this coordination takes the firm across national boundaries (Cowling and Sudgen, 1987). These cross-border operations lead to a complex organization of economic activities at different geographic scales, such as decisions to centralize or decentralize, or to cluster or disperse a firm’s functions. MNC networks therefore represent distinct loci of power that have a significant impact on an increasingly global economy, where it has been shown, for instance, that the sales of the top 200 global corporations (1999), accounted for approximately 30% of world GDP (Anderson and Cavanaugh, 2000). Furthermore, in the top 100 of a combined firm-nation list for 2000, 29 economies were MNCs (United Nations, 2002). These firms are richer than many countries, where for example, the revenue of General Motors proved to be greater than the GDP of more than 148 countries (2004). Furthermore, MNCs are responsible for a large portion of international trade and foreign direct investment (FDI) - much of this intrafirm transaction. These investments are typically controlled by corporate headquarters that determine the magnitude of foreign investment, the transfer of technology, access to international markets, repatriation of profits, and the number of employees etc. International investment between firms has been growing exceptionally since the 1960s, but although there has been an intensification of cross investment between the industrialized economies, the share claimed by developing countries remains very low (Kentor, 2002). This unevenness derives from the fact that only certain nations have the endowments and strategic ability to create the competitive advantage needed to attract corporate FDI (Guisinger, 1985). In this manner, nations strive to enhance their international trading position and compete to attract productivity and national development, which in turn enhances their international competitive position. Hence, both firm and state are interlocked in a struggle to capture global market shares, where the nation-state remains an equally important institution of capitalism (Gertler, 1992). Where firms prove to be more porous, nations differentiate themselves by artificially erected territorial boundaries, so as to distinguish and formalize their spatiality. These geographic units contain different forms of power and legitimacy with which to organize people and institutions spatially. Where nations traditionally were restrictive, we today witness the changing role of nations, from merely a policing role to a more proactive engagement in global competition. In this way, national governance remains a vital attribute to attract firms, as it serves as the ultimate guarantor of the rights of global capital, and continues to provide the necessary conditions for growth of domestic capital globally (Sassen, 1995; Evans, 1997). Nations are therefore capable of creating national competitive advantages (Porter, 1990). The core interaction between the state and MNCs is the control of the production system and the relative distribution of benefits and costs related to its operations. This relationship consists of a complex mixture of collaboration and conflict (Gordon, 1988), in which the MNC seeks to optimize its chain of production components within the most advantageous locations. Similarly, the nation endeavours to maximize its share of value adding activity and profits. For this reason, the relation between nation and firm is inevitably an awkward one (Pitelis, 1991), which is not leading to the decline of the state (Evans 1997, Weiss 1997) but to a transformation in which the state continues to participate in the internationalization of capital2. In this sense, the state depends on the legitimizing power derived from its citizens, but also the extent to which power is derived from collusion with corporate capital. States are thus continuously subjected to reforming and reformulating their national policies to meet the challenges of globalization. Furthermore, no matter how great the global reach of an MNC becomes, it remains imbedded within its country of origin (Stopford and Strange 1991), where generally most of its assets, employment and turnover comes from its home country (Hu 1992). In this sense, both agglomerate and networked space remain fundamental to the reproduction and accumulation of capital (Harvey 1989, Lefebvre 1991, Yeung 1998b), facilitated through transport, communication and production factors. Because corporations typically develop within a domestic context prior to expanding internationally, the home base plays a key role in shaping the identity of the firm, the character of its top management, and its approach to strategy and organization, including having a continuous influence in determining the availability and qualities of resources available to the firm (Porter, 1990). Within this context, investors tend to locate their funds in domestic assets in a strikingly higher proportion than expected (Wojcik), where this phenomenon is defined as the ‘home-bias’ (Obstfeld and Rogoff 2000). One of the main reasons for this is the reliability of domestic information (Merton 1987). Similarly, technological activities of corporations also remain firmly rooted in their originating countries (Cantwell 1995) due to reliable infrastructure, resources, business networks and labour processes. Local conventions, rules, practices and institutions therefore prove to be necessary for firms to effectively operate in a world of uncertainty. In this sense, economic and social proximity affects the intensity of interactions in capital markets, both at the national and global level (Portes and Rey 1999) and is hereby arguably causal to the unevenness of corporate connectivity within and between nations. The growing perception of the interdependency of internationalization and urban competition, leads to the increasing recognition that geography matters to economic performance. Therefore related to this, we will now discuss in more detail the issue of national performance. Corporate and National Competitive AdvantageIn classical theories on international trade, it is posited that comparative advantage resides in the factor endowments that a country is fortunate enough to inherit, including land, natural resources, labour and the size of the local population (Anderson and Van Wincoop, 2004). In Michael Porter’s theory on competitive advantage, he takes the comparative advantage concept a step further, by showing that corporate and national success is today also dependent on the development of unique skills, technology and knowledge in particular industries, and by connecting clusters of internationally successful business to particular attributes within their home city regions (Porter, 1990). Important here is that competitivity and development are intensified through the urban clustering of these advanced factor endowments, within their respective nations. Furthermore, competitiveness also depends on the relative centrality of the nation; the pattern of specialization and differentiation of its activities; and its functional division of labour. Also, according to Porter, only those nations which are linked to the largest market areas have the ability to provide a foundation for highly specialized functions. Nonetheless, for nations to establish greater international integration, they need to optimize their endowments. In this light, a nation’s competitive success is defined as a measure by which a nation can relatively compare itself to the best worldwide competitors. This is measured by either the presence of substantial and sustained exports to a wide array of nations, or significant outbound FDI based on skills and assets created in the home country. Firms lose competitive advantage in the more price-sensitive industries as they develop towards more capital and technology intensive industries. As firms develop into more differentiated industrial segments, they shift many of their lower-technology activities overseas, while in their home bases they concentrate activities which require higher levels of skills and expertise. The outsourced activities are then characterized by the corporation’s commitment to invest in products, processes, and skills which will reduce costs and improve the firm’s competitive advantage. Porter’s conceptualization of competitive advantage is represented by a ‘diamond’ consisting of four categories of variables that influence a firm’s ability to establish and sustain competitive advantage within international markets (see Figure 4). Firstly, this concerns ‘factor conditions’ in which he distinguishes basic factors such as natural resources, climate, location and demographics, and ‘advanced factors’ such as communications, infrastructure, sophisticated skills, and research facilities. The latter are argued to be more fundamental to competitiveness as they tend to be specialized rather than generalized. Secondly ‘demand conditions’ emphasise the role of home demand in providing the impetus for upgrading competitive advantage. In this sense, firms are typically most sensitive the needs of their closest customers, hence the characteristics of home demand are particularly important. ‘Related and supporting industries’ form the third category, in which an industry’s investments in advanced factors of production are likely to be stimulated by, and conversely create spill-over benefits beyond the confines of that particular industrial sector. This in turn facilitates the potential to innovate. Lastly, firm ‘strategy, structure and rivalry’ are identified as systematic differences in the characteristics of business sectors of different countries which are important determinants of the industrial pattern of competitive advantage within each country. These characteristics include national strategies, structures, goals, managerial practices, individual attitudes, and intensity of rivalry within the business sector. This again also stimulates corporate innovation. Figure 4: Michael Porter’s competitiveness ‘diamond’
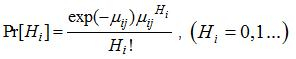
Disproportionate Multinational NetworksIn light of the above, corporate networks and their relationship to various nations are essential to our analysis, as this is expected to reveal diverse concentrations of economic activity within various nations, plus the interdependencies between them. This approach is interesting as it reveals differential power relations within the corporate network, hereby transcending simple atomistic descriptions of individual actors (e.g. firms), and hereby reveal the centrality, hierarchy, and strength of association between actors in the system (Bridge, 1997). From this the existence of unequal relationships between core and periphery, can be empirically identified (Storper and Salais, 1997). However, because these structural measures cannot tell much about the qualitative nature of the relationships (Pratt, 1997), it is important to explain these through the competitive characteristics of nations, hereby representing a necessary convergence of different streams of knowledge (Sunley, 2008). This will be shown in the analysis, through the use of the Global Competitiveness Index (see Section 3). Although conceptualizations of networks are not entirely new, most contemporary research takes its lead from John Friedmann (1986) and Stephen Hymer’s (1972) work on MNCs and uneven development. At the time, Hymer predicted that there would be a diffusion of lower levels of industrialization to developing countries, and that intermediary activity would be concentrated in middle range type places, while the highest corporate activities would concentrate in only a limited number of nations that are close to capital markets, media activities and governmental institutions. Later on, Friedmann posited that world cities (nations) can be sorted into a networked hierarchy based on the economic power that they command. According to Friedmann, those that rank first in connectivity are the types that function as the ‘command and control centers of the global economy’, and that subordinate to this, are found cities that articulate the economies of various nations into the world economy. Friedmann also showed that the level of city (nation) integration into the world economy will depend on the functions assigned to it, in which the cores will be platforms for global capital and serve as points for the spatial organization and articulation of production and markets, resulting in a complex, uneven spatial hierarchy. Hence, there is a strong positive cohesion between cities with a high corporate connectivity and the strength of their respective national connectivity. According to Carroll, this ‘uneven network’ is shaped by factors such as transnational political-economic structure; nationally specific legal and business systems; linguistic and cultural affinities; the political structure of nations and the physical limitations of geographic space, e.g. distance. In this sense, these practices generate a strongly imbedded national network, resulting from the hierarchic management and control of corporate activities, and the exercise of strategic and allocative power within particular contexts (Scott, 1997). Lastly, these studies conclude that in future, corporate network analysis needs to transcend merely structural studies, and instead start to engage with more explanatory types of variables. In this context, by combining network data with readily available national and regional data, researchers can say more about how nations and cities gain central positions within worldwide networks (Alderson and Beckfield, 2004). Therefore, in the following section we aim to contribute towards this proposition. Research DesignData on Competitiveness and Corporate ConnectivityIn the remainder of this article, we analyze the influence of national competiveness on (1) the position of a country in the global corporate control network and (2) the strength of the corporate connection between two countries. In this research the competitiveness of a country is based on the Global Competitiveness Index (GCI), which has been developed by Michael Porter and Xavier Sala-i-Martin, amongst others, for the World Economic Forum. This index was initially presented in the 2004-2005 Global Competitiveness Report and employs a specified, integrated view on competitiveness, including twelve pillars (institutions, infrastructure, macro-economy, health and primary education, higher education and training, labour market efficiency, capital market efficiency, goods market efficiency, technological readiness, market size, business sophistication and innovation (see Appendix A). These variables are particularly focused on the qualitative aspects of national economies and it is important to note that none can individually ensure competitiveness. In this light, the most competitive economies are the ones which score highest on a broad array of factors. Currently, GCI covers over 125 economies at different stages of economic development, and GCI scores range from 2.52 (least competitive nations) to 5.78 (most competitive nation) on a scale of 1 to 7. In our research, we use a slightly modified version of the original index, in which we separate the qualitative aspects of competitiveness from the more quantitative ones (market size, macro-economy). Based on the modified GCI, it is evident that Denmark, Switzerland, Singapore, Sweden, and Finland make up the Top 5 of most competitive countries, followed shortly by the United States and Germany. Angola, Chad, Burundi were among the least competitive nations. A complete overview of the GCI scores of the countries in our analysis can be found in Appendix B. With respect to our dependent variable, we focus on the position of countries in the global corporate control network and the strength of their corporate connections between countries. The hierarchic position of a country in the network is based on its total headquarter connectivity (the number of outgoing corporate connections, or outdegree) and its total subsidiary connectivity (the number of incoming corporate connections, or indegree). Likewise, we use the total number of corporate connections between a headquarter country and its subsidiary country as an indication of the strength of the corporate connection between the two countries. In this manner, the network strength ‘within’ countries and the corporate connectivity ‘between’ countries is determined on the basis of the intra-firm linkages of Fortune’s top 100 MNCs (2007) and their subsidiaries. Next, by reviewing the annual reports (2006-2007) of these MNCs, using Lexus Nexus and Thompson One Banker databases, their subsidiaries were extracted and classified into various orders of sharehold relations and national location. This resulted in a dataset of 9243 sharehold relations, of which 4638 prove to be domestic linkages and 4605 transnational. By strictly focusing upon only transnational corporate connections and excluding those linkages to subsidiary countries for which GCI scores are unavailable, a resultant dataset of 4322 sharehold relations remained.3 By aggregating the data to the national level, a global corporate network between countries was constructed between 43 headquarter countries with at least one outgoing corporate connection and 111 subsidiary countries that have at least one incoming corporate connection, listed in Appendix B. As already indicated in the First Section (Figure 2), the global corporate control network is disproportionate in many respects. Firstly, most outgoing corporate connections are held by only a few headquarter countries. Here, the United States (1192 outgoing connections), Germany (850), France (457), Japan (448), Switzerland (365), the United Kingdom (351), and the Netherlands (330) are most prominent. Overall, these countries hold about 93% of all outgoing connections, indicating that MNCs are very particular about where there headquarters are located.. Furthermore, a similar, yet less disproportionate pattern can be seen, with respect to subsidiary connectivity, where the top 10 countries (United States, United Kingdom, Canada, Germany, France, China, Netherlands, Spain, Australia and Italy), hold approximately 50% of all incoming relationships. In general, African and South American countries are clearly underrepresented in the network, with hardly any outgoing connections and only a few incoming connections. Also, with respect to the linkage connectivity, or number of connections between countries, the global corporate network reveals similar unevenness, since only 1% of the country pairs hold roughly 45% of all corporate connections. With regard to the top 5 strongest transnational connections, the United States is always involved either as a headquarter or subsidiary country. Hence, Germany-United States (150 corporate connections), United States-Canada (136), United States-United Kingdom (112), Japan-United States (106), and United States-Germany (84). Furthermore, there is no corporate connectivity between over 85% of the country-pairs. Count Data Models and Quasi-Poisson EstimationBoth the headquarter and subsidiary connectivity of countries and the number of corporate connections between countries can be perceived as count data, as these variables ‘count’ the number of times something has occurred. In our case this concerns the number of incoming or outgoing linkages, or flow frequencies between countries. Although count data is often treated as if it where continuous, estimation by Ordinary Least Squares in a linear regression framework, often results in inefficient and biased estimates of the parameters (Long, 1997). A more extensive discussion of this issue can be found in Flowerdew and Aitkin (1982) and Burger et al. (2008). Hence, the use of alternative regression techniques would be more appropriate. Probably the most common regression model applied to count data is the Poisson regression. Applying a Poisson regression, it can (for example) be conjectured that a country’s i headquarter connectivity Hi has a Poisson distribution with a conditional mean (μ) that is a function of a number of independent variables, including competitiveness (1). As Hi is assumed to have a non-negative integer value, the exponential of the independent variables is taken, so that μi is compelled to be zero or positive. More formally, in which the conditional mean μi is linked to an exponential function of a set of independent variables Xi μi = exp(α0 + β′ Xi) (2) where α0 is a proportionality constant, Xij is a 1 x k row vector of explanatory variables (including the competitiveness indicator) with corresponding parameters β. An important condition of the Poisson regression model is that it assumes equi-dispersion, which means that the conditional variance should be equal to the conditional mean. However, most often the conditional variance is higher than the conditional mean, which suggests that the dependent variable is over-dispersed. A related problem concerns excessive zero counts or ‘non-Poissonness’ in the data, meaning that the incidence of zero counts is greater than would be expected from the Poisson distribution (Long, 1997). In order to correct this, a negative binomial regression model (in case of over-dispersion), zero-inflated Poisson regression model (in case of excess zeros) or zero-inflated negative binomial regression (in case of over-dispersion and excess zeros) can be employed. These quasi-Poisson regression models are extensions or modifications of the original Poisson regression model.4 By not correcting for over-dispersion and/or excess zeros, normally results in an inefficient, estimation of the dependent variable, which is exemplified by spuriously large z-values and spuriously small p-values, due to downward biased standard errors (Gourieroux et al., 1984). A more technical discussion of modifications of the Poisson regression model can be found in Greene (1994) and Long (1997). Although aggregate headquarter connectivity is used in this example, the same models can be applied to subsidiary and link connectivity. Hence, we run three separate regressions using count data methods, in which we subsequently analyze (1) the determinants of headquarter connectivity, (2) the determinants of subsidiary connectivity, and (3) the determinants of the number of corporate connections between countries. CovariatesNaturally, competitiveness is not the only determinant of headquarter and subsidiary connectivity. In fact, there are other variables (covariates) that affect the relationship between connectivity and competitiveness, and which should be controlled for in the analysis. Where the analysis of aggregate headquarter and subsidiary connectivity only involves variables measured at the country level, the analysis of link connectivity (the number of connections between countries) also includes bilateral variables, for instance, distance between countries. Table 1 provides summary statistics of the variables included in the models. Table 1A: Summary Statistics of Variables used in the Analyses on Headquarter and Subsidiary Connectivity
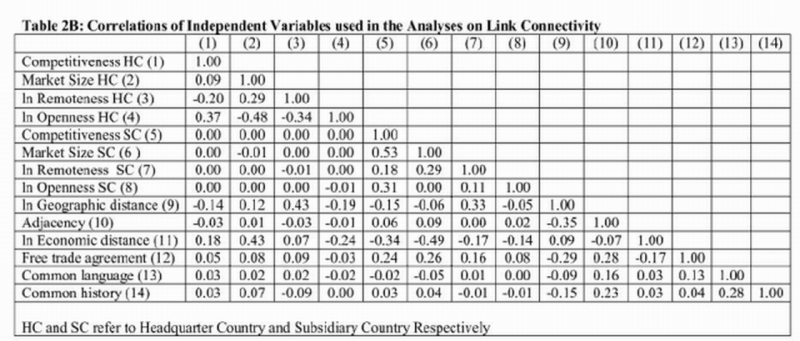
Table 1B: Summary Statistics of Variables used in the Analyses on Link Connectivity
At the country level, we include s market size, remoteness, and openness as control variables, for both headquarter and subsidiary countries. Larger countries generally tend to be more attractive to MNCs as MNCs are then able to serve a larger market. In the analyses, the market size of a country is based on the GCI’s market size pillar, , which, as explained earlier, is a composite measure of domestic market size (counting for 75%) and foreign market size based on international trade (25%). Similar to the national GCI described above, countries are ranked at a scale of 1 to 7. Remoteness is included in our analyses to control for the geographical position and accessibility of a country, and is measured as the average distance of that country to all other countries in the world. Furthermore, in order to control for the fact that some countries are more protectionist and domestically oriented than others, hereby having less transnational linkages, we include a variable for the openness of a national economy. This variable is measured by a country’s export divided by its GDP. With respect to the analysis concerning the number of corporate connections between countries, we also include several bilateral variables that are measured at the level of country-pairs. These bilateral variables reflect the distance between two countries, where distance is interpreted as a multi-faceted concept (Boschma, 2005) that keeps countries separated, hereby resulting in transaction costs that result from transnational corporate interdependence (see also Linders et al., 2008). More specifically, we focus on geographic, economic and cultural-historical distance between countries. A large literature on world trade and foreign direct investment has shown that these barriers (Anderson and Van Wincoop, 2003; Bergstrand and Egger, 2007) still generally tend to obstruct the creation of economic linkages between countries. By accounting for both country and bilateral characteristics, including country size and the physical distance between countries, our analysis closely resembles the type of analyses employed in spatial interaction or gravity-based modeling (Fotheringham and O’Kelley, 1989; Sen and Smith, 1995). Physical distance between headquarters and subsidiaries creates transaction costs in terms of transportation (of goods and people) costs, communication costs and time costs (Head, 2004). In line with previous research, geographic distance is measured as the straight distance between countries (‘as the crow flies’), using the capital of each country as its centre of gravity. However, as this also implies that the distance between the two centers of gravity of neighboring countries is likely to overestimate the average distance between them, we include an adjacency dummy variable.5 This variable, not only captures measurement error, but also historical relations between adjacent countries, including the value of only one country, if two countries are neighbors. The economic distance between countries is measured by differences in GDP per capita and indicates whether two countries have similar preferences and a similar output mix (Linder, 1961), which in turn stimulates the formation of corporate connections between these countries. Moreover, as there is much internal trade between headquarters and their subsidiaries, tariff and non-tariff trade barriers to trade may obstruct the creation of corporate linkages between countries. The Free Trade Agreement (FTA) dummy indicates whether countries are both members of the same free trade area and is determined on the basis of OECD data on major regional trade agreements. Finally, cultural-historical distance is measured by whether countries have the same official language and a historical relationship. To assess whether two countries have the same official language, we use a database collected by Haveman6 that distinguishes fourteen languages. This data has been expanded using CIA’s World Factbook to cover even more countries and languages. Hence, a language dummy variable reflects whether or not two countries have a common official language. Similarly, the history dummy variable takes the value of only one country, if two countries had, or have, a colonial relationship, or even if they were once part of the same country. This variable is constructed on the basis of CEPII data7. Empirical ResultsIn this section, we analyze to what extent national competiveness influences the headquarter connectivity (the number of outgoing corporate connections), subsidiary connectivity (the number of incoming corporate connections) and link connectivity (the number of corporate connections between countries) of countries. Regarding the analysis of headquarter and subsidiary connectivity, the negative binomial regression model proved to be more appropriate than its Poisson and zero-inflated counterparts. Similarly, for the analysis of linkage connectivity, the zero-inflated negative binomial model regression model fitted the data best.8 Concerning the potential problem of multicollinearity, the correlation matrices in Table 2 indicate that all variables show sufficient independent variation, as the correlations between the explanatory variables are below 0.55. Furthermore, all regression models below are calculated using the Huber/White/sandwich estimator (robust standard errors) to account for unobserved heterogeneity (Santos Silva and Tenreyro, 2006). Table 2A: Correlations of Independent Variables used in the Analyses on Headquarter and Subsidiary Connectivity
Competitiveness and Headquarter and Subsidiary ConnectivityModel 1 in Table 3 presents the estimates for the negative binomial regression model on headquarter connectivity. In general, it can be inferred that in line with the theory, most variables fit expectations and are statistically significant. Only the openness of a country’s economy does not apparently affect the headquarter or subsidiary connectivity of a country within the global corporate network. With respect to headquarter connectivity, we find a highly positive and significant effect of competitiveness on the number of outgoing linkages that a country has. Therefore, if we increase the competitiveness of countries by one standard deviation, the number of outgoing linkages is multiplied by a factor of 8.88.9 However, besides competitiveness, also a country’s market size and remoteness appear to be important determinants of a country’s headquarter connectivity.. In this case, the number of outgoing corporate connections is multiplied by a factor 11.17, if we increase the market size of a country by one standard deviation. On a similar note, if the remoteness of a country, in terms of its average distance to all other countries, increases by 1%, then the number of outgoing connections that country will expectedly drop by 2.86%. Model 2 in Table 3 presents the estimates for the negative binomial regression model on subsidiary connectivity. As expected, competitiveness proves to have a positive and statistically significant effect on a country’s number of incoming corporate connections. Yet, the effect is smaller, when compared to a country’s outbound headquarter connectivity. By increasing competitiveness by one standard deviation only multiplies the subsidiary connectivity by a factor 1.62. Similarly, with respect to market size, we find that the number of incoming linkages is multiplied by a factor 3.23 if we the market size of a country is increased by one standard deviation. Striking enough, not only the openness of a country’s economy, but also its remoteness does not have an effect on the number of incoming corporate connections. Table 3: Negative Binomial Pseudo Maximum Likelihood on Headquarter and Subsidiary Connectivity
Comparing the determinants of headquarter and subsidiary connectivity, two important observations with respect to location preferences of MNCs can be made. Firstly, a country’s competitiveness is important with respect to attracting headquarter and subsidiary offices of MNCs. Yet, the market size of a country (in terms of the domestic and foreign market they serve) seem to matter most for both headquarter and subsidiary connectivity of countries to the global corporate control network. Secondly, the estimated effect sizes of competitiveness, market size and remoteness of countries on the number of outgoing linkages is much larger than the estimated effect sizes of these variables on the number of incoming linkages. This signifies that (not surprisingly) MNCs are much more demanding with respect to the characteristics of their headquarter location than with respect to the location of their subsidiaries. Competitiveness and the Number of Linkages between CountriesIn model 3 of Table 4 the estimates for the zero-inflated negative binomial regression model on link connectivity is presented. The zero-inflated model (Greene, 1994; Long, 1997) consists of two parts. The first part of the zero-inflated model contains a logit regression of the probability that there is no corporate connection between countries at all. The second part contains a negative binomial regression of the probability of each count for the group that has a non-zero probability, or interaction intensity other than zero. Hence, the zero-inflated negative binomial model generates two sets of parameter estimates: one set for the logit model, which identifies members of the group of pairs of countries that always have zero values (pairs of countries that never have a corporate connection); and one set for the negative binomial part, which predicts the probability of a count belonging to the group of countries that have theoretically non-zero corporate connections. Because we concur that the determinants of the probability of link formation do not significantly differ from the determinants that predict the number of links that are created, the same variables are included in both parts of the regression model. Table 4: Zero-Inflated Negative Binomial Pseudo Maximum Likelihood on the Number of Corporate Connections between Countries
Model 3 includes variables measured at the level of the headquarter country, the subsidiary country and bilateral variables. The majority of variables included in this analysis have the expected properties and are statistically significant. As can be derived from Table 4, the coefficients in the logit model are usually in opposition to those in the negative binomial part. With respect to the bilateral variables, we find that geographical distance, adjacency and common history particularly affect the probability of corporate connectivity, which can be derived from the logit part of the model. Hence, if the geographical distance between countries increases by 1%, the probability of country pairs belonging to the corporate connection group increases by 0.84%. Being neighbors and having a common history decreases the odds of never having a corporate connection by 99% and 93% respectively. Despite the fact that geographic distance and common history both affect the probability of corporate connecting; these variables nonetheless tend to not have an effect on the expected number of corporate connections between the countries. Examining the negative binomial part of the model, it appears that in particular, economic distance, adjacency, and the sharing of a common official language, increases the expected number of connections, when keeping all other variables constant. Hence, the probability that countries have a corporate connection, and the probability of the number of corporate connections between countries, essentially have different determinants. For the last part of the analysis, we can now focus our discussion on the impact of national characteristics on the number of corporate connections between countries. Compared to the subsidiary country characteristics, it appears that the headquarter country characteristics have a much stronger effect on the probability of link formation between two countries and the number of linkages that are created between two countries. This is exemplified by smaller effect size estimates of the subsidiary country variables. This is in line with the findings related to headquarter and subsidiary connectivity in Model 1 and 2. More specifically, the competitiveness of a headquarter country has both a strong effect on the probability of a corporate connection and the number of corporate connections between the two countries under observation. Increasing headquarter competitiveness by one standard deviation, multiplies the probability of a country having a corporate connection by a factor of 4.5, and the number of corporate connections by a factor 3.6, pending that all other variables remain constant. Hence, the competitiveness of subsidiary country does not have an effect on the probability of a corporate connection between the two countries and a small effect on the number of corporate connections between the two countries. In this case, the number of corporate connections between two countries is only multiplied by a factor 1.3, if the competitiveness of a subsidiary country is increased by one standard deviation. In line with this, the market size of the headquarter country appears to be a more important determinant of the structure of the global corporate control network than the market size of the subsidiary country. With respect to remoteness, we find that country-pairs that connect to remote headquarter countries, generally have a lower probability of link formation, plus a smaller number of corporate connections. Strikingly, we find that country-pairs with remote subsidiary countries generally have a higher probability of linkage formation and a larger number of corporate connections. This can be explained by the fact the remote countries (e.g., Australia, New Zealand) face less competition from other countries, when serving as subsidiary locations for MNCs that wish to serve their local markets. Furthermore, we also find that openness of the headquarter country has a positive effect on the probability of link formation, but a negative effect on the number of linkages created, resulting in an approximate zero net effect. By comparing the national determinants of the global corporate control network to each other, we can conclude that national competitiveness, market size and the remoteness of the headquarter and subsidiary country, significantly determine the structure of the global corporate network. Nonetheless, the overall characteristics of headquarter countries tend to be much stronger determinants of the probability of corporate connectivity between two countries, plus the number of corporate connections created, than those characteristics of the subsidiary country. Conclusive summaryIn this article, transnational corporate networks based on intra-firm shareholds have served as the object of scientific inquiry. In this way differential economic power relations have served to transcend atomistic descriptions of individual actors, hereby enabling empirical knowledge of interdependence between nations (Alderson and Beckfield, 2004). These networks represent almost one third of all OECD revenue and are almost entirely claimed by developed countries in North America, Europe and Pacific Asia - particularly in the transatlantic zone between Europe and North America. Furthermore, besides structural insight into the disproportionality of the contemporary global corporate system, we have also explained its skewness by means of explanatory variables - namely the competitiveness and market size indices of the world’s nations, while controlling for other country (openness, remoteness) and bilateral (geographical, cultural, and economic distance) characteristics. This has been executed by means of two research questions, which have focused on explaining the structure of the corporate network, firstly in terms of national headquarter centrality (headquarter outdegree and subsidiary indegree), and secondly in terms of corporate connectivity between nations. Concerning the first research question, with respect to headquarter connectivity, it has been shown that both the level of competitiveness, and market size of nations, are highly influential to their total number of ‘outdegree’ headquarter linkages. In this manner, our competiveness indicator has served to capture the more ‘qualitative’ aspects of national economies, while market size has been used to represent the more ‘quantitative’ aspects. In this manner, we have validated Porter’s (1990) observation that the endowment of an MNC’s headquarter home base, plays a vital role to its success. These clustered endowments include infrastructure, resources, effective business systems and labor processes; and also the reassurance of a more predictable and sizeable market (Cantwell, 1995), - all variables captured within the independent variables that we have used. Similar to the outgoing headquarter connectivity, it has been shown that the total subsidiary ‘indegree’ connectivity of nations, reveals analogous outcomes to that of headquarters, except that the effect proves to be smaller in all cases. Although competitiveness and market size do matter to the strength of headquarter and subsidiary connectivity alike, the impact of a nation’s competitiveness and market size is apparently far more influential to headquarters than subsidiaries. This is arguably because MNC headquarters are situated in only a handful of superiorly developed countries, while subsidiaries are more abundantly found in well-developed, developed and developing countries. This means that their variance is far greater than that of headquarters, as they are more easily located in nations with lower qualitative levels of competitiveness, and smaller market size. Regarding the second question, in which the linkage strength ‘between’ countries is explained by national performance indicators, similar results are found. National competitiveness and market size of both headquarter and subsidiary country, prove to be important determinants of the contemporary global corporate structure. However, the overall characteristics of headquarter nations prove to be much stronger determinants of the probability of corporate connectivity between two countries and the volume of their linkages, than in the case for subsidiary countries. In other words, the competitiveness and market size of a headquarter countries is evidently more important to the structure of the global corporate network than the competitiveness and market size of subsidiary countries. As explained in the theory, this unevenness derives from the fact that only particular nations are well enough endowed, and have the strategic ability to ensure the competitive advantage needed to attract MNC headquarters. Our structural findings of the corporate network, confirm that the world has not changed much since Hymer in 1972 postulated the corporate unevenness of nations – and in which today the same handful of persistent headquarter nations still tend to dominate the global arena. In our results, we have shown that the majority of shareholds remain strictly active between developed countries, which still serve as the primary command and control centers of the world economy. This network path dependency, as confirmed in our research, is determined by the fixedness and persistence of largely immobile social and physical infrastructures (Harvey, 1982), as captured in our competitiveness index - and by which the structure of global corporate power does not subvert the dominance of the developed capitalist core, but instead reinforces it (Carroll, 2007). REFERENCESAndersen, J E, Van Wincoop E, 2004, “Trade Costs” Journal of Economic Literature 17 691-751. Anderson S and Cavanagh J, 2000, “Field Guide to the Global Economy”, New Press. Bergesen A and Sonnett J, 2001, “The Global 500: Mapping the World Economy at Century’s End”, American Behavioural Scientist 44. Bergstrand J H, Egger P, 2007, “A Knowledge-and-Physical Capital Model of International Trade Flows, Foreign Direct Investment, and Multinational Enterprises” Journal of International Economics 73 278-308. Boschma R A, 2005, “Proximity in Economic Interaction”, Regional Studies 39 41–47. Brakman S, Van Marrewijk C, “It’s a Big World After All: On the Impact of Location and Distance”. Forthcoming in Cambridge Journal of Regions, Economy and Society, 1. Bridge G, 1997, “Mapping the Terrain of Time - Space Compression: Power Networks in Everyday Life”, Environment and Planning: Society and Space 15(5) 611 – 626. Burger M J, Van Oort F G, Linders G J M, 2008, “On the Specification of the Gravity Model of Trade: Zeros, Excess Zeros and Quasi-Poisson Estimation”, Working Paper, Erasmus University Rotterdam, Rotterdam. Cairncross, F. 1997 The Death of Distance. How the Communications Revolution Will Change Our Lives, Texere Publishing, London). Cantwell J, 1995, “The Globalization of Technology: What Remains of the Product Cycle Model?”, Cambridge Journal of Economics 19. Carroll W K, 2004, “Corporate Power in a Globalizing World”, Oxford University Press, Toronto. Carroll, W K, 2007, “Global Cities in the Global Corporate Network”, Environment and Planning A 39, 2297-2323. Castells M, 1996, “The Rise of the Network Society, Blackwell, Cambridge MA Cerny, P.G., 1991, “The Limits of Deregulation: Transnational Interpenetrations and Policy Change”, European Journal of Political Research. Cowling, K and Sudgen, R, 1987, “Market Exchange and the Concept of the Transnational Corporation, British Review of Economic Issues 9. Driffield N, Love J.H., 2005, “Intra-Industry Foreign Direct Investment, Uneven Development and Globalization: The Legacy of Stephen Hymer”, Political Economy Vol. 24 1. Evans P, 1997, “The Eclipse of the State? Reflections on Stateness in an Era of Globalization”, World Politics 50. Flowerdew, R. and M. Aitkin (1982), “A Method of Fitting the Gravity Model Based on the Poisson Distribution”, Journal of Regional Science, 22, 2, 191-202. Fotheringham A S, O’Kelly M E, 1989, “Spatial Interaction Models: Formulations and Applications”, Kluwer, Dordrecht). Friedman, T L, 2007, “The World is Flat: A Brief History of the Twenty–First Century”, Farrar, Strauss and Giroux, New York. Gabaix X, Ibragimov R, 2008, “Rank-1/2: a Simple Way to Improve the OLS Estimation of Tail Exponents”, Working Paper, Stern School of Business, New York University. Gereffi G, 1994, “The Organization of Buyer-Driven Commodity Chains: How the US Retailers Shape Overseas Production”, in G. Gereffi and M. Korzeniewicz eds “Commodity Chains and Global Capitalism”, Praeger. Gertler M.S., 1992, “Flexibility Revisited: Districts, Nation-States and the Forces of Production”, Transactions of the Institute of British Geographers 17. Gourieroux C, Montfort A, Trognon A, 1984, “Pseudo maximum likelihood methods: applications to Poisson models” Econometrica 52, pp. 701-720. Gordon D.M., 1988, “The Global Economy: New Edifice or Crumbling Foundations?”, Basic Books. Greene, W.H. (1994), “Accounting for Excess Zeros and Sample Selection in Poisson and Negative Binomial Models”, Stern School of Business, New York University, Working Paper 94-10. Guisinger S, 1985, “Investment Incentives and Performance Requirements”, Praeger. Harvey D, 1982, “The Limits to Capital”, Blackwell. Harvey D, 1989, “The Urban Experience”, Blackwell. Harvey D, 2006, “Spaces of Global Capitalism: Towards a Theory of Uneven Geographical Development”, Verso, London. Head, K. (2004), “Gravity for Beginners”, Working Paper, University of British Columbia, Vancouver. Hirst P and Thompson G, 1996, “Globalization in Question: The International Economy and the Possibilities of Governance, Polity Press. Hu Y S, 1992, “Global Firms and National Firms with International Operations”, California Management Review 34. Hymer S., 1972, “The Multinational Corporation and the law of Uneven Development”, p 113 -40, in Economics and World Order, ed. Bhagwati J. N., New York. Kang N-H, Sakai K, 2000, “International Strategic Alliances: Their Role in Industrial Globalization”, OECD STI working paper. Kentor J, 2005, “The Growth of Transnational Corporate Networks 1962-1998”, Journal of World Systems Research, 11. Lefebvre H, 1991, “The Production of Space”, Blackwell. Linder S B, 1961 “An Essay on Trade and Transformation”, John Wiley and Sons, New York. Linders, G J M, Burger M J, Van Oort F G, 2008, “A Rather Empty World: The Many Faces of Distance and the Persistent Resistance to International Trade”, Forthcoming in Cambridge Journal of Regions, Economy and Society, 1. Long J S, 1997, “Regression Models for Categorical and Limited Dependent Variables”, SAGE, Thousand Oaks, CA. McCann P, 2008, “Globalization and Economic Geography: The World is Curved, Not Flat”, Cambridge Journal of Regions, Economy and Society, 1. Merton R.C., 1987, “A Simple Model of Capital Market Equilibrium with Incomplete Information”, Journal of Finance 42. Meyer J. W., 1997, “World Society and the Nation State”, American Journal of Sociology 103 -1. Obstfeld M and Rogoff K, 2000, “The Six Major Puzzles in International Economics: Is there a Common Cause?”, Working paper 7777, NBER, Cambridge MA. Ohmae K, 1995, “The Evolving World Economy: Making Sense of the New World Order”, Harvard Business Review Press, Boston. Ommerod P, 2005, “Why Most Things Fail: Evolution, Extinction and Economics”, Faber and Faber Limited. Pitelis C, 1991, “Beyond the Nation State”, Capital and Class 43. Porter M.E., 1990, “The Competitive Advantage of Nations”, Free Press. Porter M. E., Schwab K., Sala-I-Martin X., 2007, “The Global Competitiveness Report”, 2007-2008, Palgrave Macmillan. Portes R and Rey H, 1999, “The Determinants of Cross-Border Equity Flows”, Discussion paper 2225, Centre for Economic and Policy Research, London. Pratt A.C, 1997, “The Emerging Shape and Form of Innovation Networks and Institutions”, in J. Simmie ed. “Innovation, Networks and Learning Regions?”, Jessica Kingsley. Santos Silva, J C M, Tenreyro S, 2006,”The Log of Gravity” The Review of Economics and Statistics 88, 641-658. Sassen, S, 1991, “The Global City: New York, London, Tokyo”, Princeton University Press. Sassen S, 1995, “The State and the Global City: Notes Towards a Conception of Place-Centred Governance”, Competition and Change 1. Schoenberger E, 1991, “Globalization and Regionalization: New Problems of Time, Distance and Control in the Multinational Firms”, paper as presented at the Annual Meeting of the Association of American Geographers, Miami. Scott J., 1997, “Corporate Business and Capitalist Classes”, Oxford University Press, New York. Sen A. K., Smith T. E., 1995, “Gravity Models of Spatial Interaction Behaviour, Springer-Verlag, New York Stopford J. M., Strange S., Henley J. S., 1991, “Rival States, Rival Firms: Competition for World market Shares”, Cambridge University Press. Storper M., Salais R., 1997, “Worlds of Production: The Action Frameworks of the Economy”, Harvard University Press, Cambridge MA. Sunley P, 2008, “Relational Economic Geography: A Partial Understanding or a New Paradigm”, Economic Geography, 84. Taylor P. J., 2004, “World City Network: A Global Urban Analysis”, Routledge. UNCTAD 1996, “Transnational Corporations and World Development”, International Thomson Business Press. United Nations, 2002, “World Investment Report”, New York/Geneva. Vuong Q H, 1989, “Likelihood Ratio Tests for Model Selection and Non-Nested Hypotheses” Econometrica 57 307-333. Wall R. S. and v.d. Knaap G. A, “Glocal Footprint: Network Sustainability within Global, European and Dutch Corporate Systems”, Report for The Netherlands Environmental Assessment Agency (MNP) 2008. Wall R. S., Sleegers W, v.d. Knaap G.A., 2007, “Towards Network Sustainability: Between Corporate Network Analysis and Development Indicators”, GaWC Research Bulletin 245. Weiss L, 1997, “Globalization and the Myth of the Powerless State”, New Left Review 225. Yeung H.W.C., 1998a, “The Social-Spatial Constitution of Business Organizations: A Geographic Perspective”, Organization 5 101-28. Yeung H.W.C., 1998b, “The Political Economy of Transnational Corporations: A Study of the Regionalization of Singaporean Firms, Political Geography 17. NOTES* R.S. (Ronald) Wall, Corresponding author: Erasmus School of Economics, Department of Applied Economics, Erasmus University Rotterdam, Email: wall@few.eur.nl ** M.J. (Martijn) Burger, Erasmus School of Economics, Department of Applied Economics, Erasmus University Rotterdam, Email: mburger@few.eur.nl *** G.A. (Bert) van der Knaap, Erasmus School of Economics, Department of Applied Economics, Erasmus University Rotterdam, Email: vanderknaap@few.eur.nl 1. The parameter values have been estimated using the Zipf regression approach by Gabaix and Ibragimov (2008). 2. Ultra-globalists like Ohmae (1995) believe that this process will lead to a breakdown in the territoriality of the global economy, which in turn becomes borderless and claim that a firms country of origin does not matter. 3. These mainly included islands in the Caribbean, Indian Ocean, and South Pacific and some countries in Sub-Saharan Africa with only a few connections in total. For Angola and Malawi, the 2006 score was imputed, due to the unavailability of the 2007 score. 4. In this, the likelihood ratio test of over-dispersion can be used to test whether the negative binomial specification is favoured over the Poisson specification. Likewise, the Vuong statistic (Vuong, 1989) can be employed to test whether a zero-inflated model is favoured above its non-zero inflated counterpart by examining whether there is significant evidence for excessive zero counts. 5. Adjacency requires either a land border or a small body of water separating the two countries. 6. www.macalester.edu/research/economics/PAGE/HAVEMAN/Trade 8. Models were compared on the basis of information criterions (AIC, BIC), the likelihood ratio test of overdispersion and the Vuong statistic. 9.
The coefficients on competitiveness and market size are semi-elasticities. To interpret the impact of these variables on headquarter, subsidiary and link connectivity, we assume that these variables decrease by one standard deviation. The probability of trade is then multiplied by a factor Appendix A: The Global Competiveness Index The Global Competitiveness Index was originally developed by the Spanish economist Xavier Sala-i-Martin and aims to measure ‘the set of instutions, policies and fators that determine the level of productivity of a country’ (Sala-i-Martin et al. 2007). In this respect, the index is an indicator for the relative attractiveness or competitive advantage of nations. From 2004 onwards, the index appears in the World Economic Forum’s yearly Global Competitiveness Report. In this research, we use the index scores from the 2007-2008 report, containing competiveness scores for 131 countries. In total, the Global Competitiveness Index is currently made up of over 100 variables, which are organized in 12 pillars, representing different determinants of a country’s competiveness. Most often, countries that score high on one particular pillar also score high on the other pillars. In actual fact, there is usually a strong statistical correlation between the different pillars of over 0.90. Using exploratory factor analysis, we identified two groups of pillars. The first group, consisting of two pillars, is related to the market size of a country. The second group, consisting of 10 pillars, is related to the qualitative elements of competitiveness. Both these groups of pillars have been utilized in our research as determinants of the structure of the global corporate control network, except that we have condensed these multiple variables into two clear factors. Hence, our definition of competitiveness is narrower than the broad definition of the World Economic Forum. The pillars included in this second group are: institutions, infrastructure, health and primary education, higher education and training, goods market efficiency, labor market efficiency, financial market sophistication, technological readiness, business sophistication, and innovation. For each pillar, the Global Competitiveness Index provides a subindex. The competitiveness variable in our research is an unweighted average of the sub-indexes of the 10 pillars of the second group. A more detailed account of the Global Competiveness Index and the variables included in each pillar can be found in Chapter 1.1. of the Global Competiveness Report 2008 (Sala-i-Martin et al. 2007).
Appendix B: Countries included in the Analysis and their number of outgoing connections, incoming connections and Global Competitiveness Index (GCI)
|
||||||||||||||||||||||||||||||||||||||||||||||||||||||||||||||||||||||||||||||||||||||||||||||||||||||||||||||||||||||||||||||||||||||||||||||||||||||||||||||||||||||||||||||||||||||||||||||||||||||||||||||||||||||||||||||||||||||||||||||||||||||||||||||||||||||||||||||||||||||||||||||||||||||||||||||||
 (1)
(1)