GaWC Research Bulletin 157 |
|
|
|
Note: This Research Bulletin is a source paper for upcoming Research Bulletins such as RB 173 and RB 187 and will not be published in its present form.
1. INTRODUCTIONOne of the driving factors behind the advent of a globalized economy is that geographic distance appears to become a less important factor in worldwide economic, social, political and cultural relations. Some researchers have heralded that this relegation of distance implies the end of geography at large (see OBrien, 1992), but it has equally been noted that such far-reaching claims are rather overblown (Yeung, 1998). Subsequently, a new discourse has been developed for describing the geographical outline of the global economy, i.e. a conceptualisation along the lines of a network economy. The latter concept is sensitive to the waning importance of distance, but it equally acknowledges that spatial structures are not simply disappearing. Although the term network economy has a broad range of specific meanings and uses, arguably its most important implication from a geographic point of view is that place does not simply loose its ontological status. Rather, its logic and meaning becomes absorbed in a new context, i.e. the context of a so-called space of flows that together constitute a series of overarching globally organised networks (Castells, 1996). This new geographic rationale of a network economy, then, essentially situates places in multifarious flows of information, transactions, people, and goods, since they are (re)produced by what flows through them (information, knowledge, money and cultural practices) rather than what is fixed within them (see Allen, 1999). There are myriad such networks in the global economy, but in this paper we will focus on the geographic outline of an important enabling infrastructure and communication network, i.e. the worldwide distribution of air passenger flows. More specifically, "( ) because of its relatively rapid capacity to reply in terms of supply and demand, air traffic provides a pertinent indicator in the quest to evaluate the international character of ( ) cities" (Cattan, 1995, p. 303). It is therefore the formative objective of this paper to attain some insight in the outlines of the global network economy through a geographically detailed analysis of worldwide air passenger flows. The paper is structured as follows. First we analyse the usefulness of airline data for doing global network economy research, and point to some potential problems. Next we introduce the so-called MIDT data source. This data set, containing relevant information on worldwide passenger airline bookings, is described, transformed and evaluated. This is followed by an empirical discussion at two levels of analysis. First, we will concentrate on the regional level and map the flows arriving in and leaving Europe, Northern America, Latin-America, the Former Soviet Union/Central Asia (FSU/CA), the Middle East and North Africa (MENA) countries, Sub-Saharan Africa, Oceania, Pacific Asia and Southern Asia. Second, we will focus on the city level through an analysis of the number of passengers boarding on/off in 290 world cities. Finally, we will point to some avenues for further research. 2. USING AIRLINE DATA FOR GLOBAL RESEARCHIf our intent is to obtain a worldwide refined empirical mapping of the contemporary network economy, having suitable global data is a first straightforward requirement. Here, the potential usefulness of airline data in analyses of flows between major cities in the world economy seems relatively clear-cut. After all, air traffic data are comparatively easy to fetch (this is to say that different air transport data sources exist), air transport is traditionally organised through cities rather than through states (hence complying with Sassens (2000) idea that a global network economy is organised through cities), and transportation is basically all about connections and flows. Focusing in more detail on the issue of data availability, it can indeed be noted that air transport economists and geographers can fall back on a variety of air data sources for doing their research. We point to such data sources provided by IATA (International Air Transport Association), AEA (Association of European Airlines), ICAO (International Civil Aviation Organisation), Boeing/Airbus, OAG (Official Airline Guide), GMID (Global Market Information Database), Ministries and/or Departments of Transportation, Departments of Civil Aviation, International Air Travel Statistics, etc. However, most of these data sources suffer from several shortcomings if one aims to make a truly global economic-geographical analysis. At least five important limitations can be discerned. First, there is the problem of distinguishing between international versus global flows. This subtle bias towards inter-state rather than trans-state flows tends to undervalue relations between cities that are situated in a large and/or significant nation-state (a notable example is the United States). Data provided by the ICAO for example report on international movements rather than on global movements. Rimmer (1998, p. 460) and Matsumoto (2004, Figs. 1-8), for instance, base their analyses on ICAO data on international passengers, which resulted in a downgrading of US cities in particular, since important connections such as Los Angeles New York and Chicago New York are not incorporated in their approaches. This means that, without other information sources, nothing is known about the relations between two cities/regions situated in the same state. In addition, in order to preserve the confidentiality of the countries and the airlines, the ICAO only provides air traffic data for international city pairs if at least two airlines are representing at least two different states. As a consequence, locations that are serviced by only one airline are not represented in the data (Smith and Timberlake, 1995). Second and related to the first point, if data are used provided by airline associations (e.g., AEA) then these data mostly focus only on a specific world region, hence they do not cover the entire global economy. This problem engenders the difficulty that several data sources have to be consulted if flows of more then one geographical region are to be analysed. Here, two problems arise: (i) the data are not necessarily measured and gathered in the same way, and (ii) the data are not necessarily published in the same year, thus hampering mutual comparability. A third limitation relates to the fact that most airline associations offer only data emanating from member airlines. This means that airlines, servicing a certain region without being members of the association, will not be included in the dataset. This can cause a bias in the total amount of passengers arriving at or departing from an airport. For example, Air Scotland, Corsair, Air Polonia, etc. are not members of the Association of European Airlines (AEA), and hence, their traffic is not included in the Associations dataset, even if they serve the same region as members of the AEA. A fourth major obstruction in the translation of airline data into global economic analyses is induced by the lack of origin/destination information in the databases (Derudder et al., 2004). That is, most airline data record the individual legs of a trips rather than the trip as a whole, so that in case of a stopover a significant number of real inter-city links are replaced by two or more links that reflect corporate strategy rather than relations between key cities. Furthermore, the lack of origin/destination information also brings about the problem that geographically detailed assessments of the global urban system are difficult, since direct connections become less and less likely once one goes down the urban hierarchy. A case in point is Keelings (1995) world city map, which was based upon an analysis of the dominant linkages in the global airline network. This map was created out of a matrix of scheduled air service to/from 266 cities with a population exceeding 1 million inhabitants. However, only non-stop and direct flights between two cities were taken into account, so that the measures used by Keeling are not necessarily a reflection of actual inter-city relations. It is likely that in such an analysis the importance of cities that function as airline hubs such as Miami and Frankfurt is overestimated at the expense of the likes of Boston/Seattle and Berlin/Munich. Furthermore, direct links between, say, Brussels and Rio de Janeiro cannot be measured, since passengers are likely to go through São Paulo to make this trip. Relations between second-tier cities are hence difficult to measure with a data source that only contains individual and direct trips. As a consequence, the global analyses by Cattan (1990, 1995), Keeling (1995), Kunzmann (1998), Graham (1999), Smith and Timberlake (2001, 2002), OConnor (2003), Matsumoto (2004) and Zook and Brun (2004) are biased towards first-tier cities and important hub cities. Fifth, global air traffic data should preferably reflect real passenger movements instead of derived passenger movements through such proxy variables like scheduled flights or services (e.g. OAG), albeit possibly corrected for aircraft type. Moreover, air traffic data should also avoid false origin movements due to certain customs and immigration regulations1. Given that in this paper we intend to pursue a truly global analysis of the network economy on the basis of air passenger transport flows, the data used in our research should not suffer from the above-mentioned drawbacks. In other words, the data used must be global. That is, the airports and locations included in the data have to cover the entire world, while the data should detail global rather than international air passenger flows in order to overcome the state-centrism problem. The data should also contain information on origin/destination travel (i.e. the full trip), thereby avoiding an overestimation of the importance of locations acting as hubs. In addition, the data will have to comprise all passengers travelling on a specific origin-destination pair, which means that in principle as many as possible airlines servicing a specific connection will have to be included. And finally, the data should pertain to real passenger movements. The so-called Marketing Information Data Transfer (MIDT) data set is such a data source. 2.1 MIDT: Description of the Data SetThe Marketing Information Data Transfer (MIDT) is a database that contains information on airline bookings. It contains interesting data such as airline codes, board on/off cities, passenger count, flight numbers, class of service, booking date, departure date, agency name, ARC/IATA number, subscriber country, the cancellation indicator, etc. All the bookings recorded in the MIDT system originate exclusively from so-called Global Distribution Systems (GDS), which are electronic platforms used by travel agencies to manage airline bookings (i.e., selling seats on flights offered by different airlines), hotel reservations, and car rentals purposes. Examples of GDS are Galileo, Apollo, Sabre, Worldspan, Amadeus, Topas, Infini and Abaccus (Shepherd Business Intelligence, 2004). Because low cost carriers, such as Southwest, EasyJet, Virgin or Ryanair have a lot of direct sales, and consequently do not work with GDS, they are not included in the MIDT-system. All bookings occurring directly at an airline, without passing by an intermediate agency are excluded from the system. Note that airlines sometimes choose the direct booking option to avoid commissions charged by travel agencies. Estimates have shown that direct bookings via the Internet cost an airline 1$, while bookings at travel agents cost 10$ (Goetzl, 2000). In 1999 20% of all reservations were done through direct booking (Miller, 1999), and it can be assumed that this percentage will increase over the years. Consequently, the MIDT-database gives an underestimation of the total airline transport business. This is especially the case for Asia and Africa, where direct bookings follow a growing tendency. Through the cooperation of an airline, we were able to obtain a partial MIDT-database comprising only data about the origin, the destination, the number of stopovers, the airport where the passengers have to stop over, the airlines, and the number of passengers. The acquired database contains 3 753 100 records, whereby each record includes the six aforementioned data inputs. The data set covers the period January August 2001 and is aggregated over those 8 months. This means that we do not know the exact number of passengers travelling per month. Working with data covering the period before September 2001 has the advantage that it does not include the impact on passenger air transport induced by the terrorist attacks on 11 September 2001. During the months following this date many destinations were not serviced since numerous connections were (temporarily) removed, and some carriers disappeared from of the market. The Association of European Airlines (AEA) announced an intra-European traffic decrease by 11.6% during the last 4 months of 2001, compared to the same period in 2000. On the North-Atlantic routes air traffic dropped severely in November 2001 with 30-35% relative to the previous year. Thereafter the losses diminished and stabilised at 20% at year-end. On the Far Eastern routes, the number of passengers decreased to more than 20% in October and November 2001. However, by March 2002, traffic had almost returned to previous years levels (AEA, 2002). None of these traffic changes will therefore bias our data. Conversely, we have the disadvantage that our data covers only one period, so that no comparisons are possible; we are not able to track changes over time and study the evolution of specific connections. Because not all the information contained in each record is of equal value to us, we selected the three most relevant fields, which are origin, destination and number of passengers. The fields origin and destination are represented by airline codes, which consist of three characters varying from A to Z, i.e. the so-called IATA code (e.g. "AAA" stands for Anaa, which is located in French Polynesia). The field number of passengers2 refers to all passengers travelling between the origin and the final destination regardless of the fact that stopovers are made. The MIDT database does however contain information about the stopovers. Therefore it is possible to analyse which hubs are most used for specific geographical regions, but this issue is not being dealt with in the present paper. 2.2. Transformation of the DatabaseIn order to make the database more manageable, the initial 3 753 100 records representing the movement of 547 410 397 passengers were transformed into a smaller, more concise dataset. This process was done in different steps. First, given that the choice of an airline is not a prime variable in our analysis, we summed all travellers on a specific origin-destination pair, irrespective of the airline servicing the connection. This allowed us to transform the original database into a database consisting of only 650 000 records. Second, the least important destinations were deleted from the database. This deletion can be carried out on the basis of different criteria. One possibility is to maintain only the capital cities or the cities with a population density exceeding a certain threshold. Numerous other selection criteria can be thought of, such as the number of passengers boarding on/off, the surface of the city/country, the (geographical) location, the percentage of the active population, etc. We decided however, like OConnor (2003, p. 86), to carry out the transformation following the research results of the University of Loughboroughs GaWC (Globalization and World Cities Study Group and Network, http://www.lboro.ac.uk/gawc/), which focuses primarily on the relations between world cities. Using GaWCs classification is particularly well suited for the present study, as it provides a categorization of cities based on an understanding of the location of business, which is known to have a significant influence on air traffic. Moreover, since the GaWC study group has already published a series of papers (Beaverstock et al., 1999; Taylor, 2001, 2004; Derudder et al., 2003; Taylor and Walker, 2004), taking over their premises and starting-points allows us to compare our results with earlier findings. GaWC selected the capital cities of all but the smallest states plus numerous other cities of economic importance. This selection resulted in a set of 315 cities (Taylor et al., 2002; see Appendix). Third, 25 cities were left out of this GaWC-dataset for the following reasons; (i) the city had no airport (e.g. Kawasaki), (ii) the airport was not serviced in the considered period due to political instability (e.g. Kabul), (iii) the city was only connected with cities that are not included in the selected set of 315 cities (e.g. Mainz), (iv) the city was not included in the original database (e.g. Rawalpindi), or (v) a very limited number of passengers (less then 1000) boarded on/off in the city (e.g. Batam). As a result, 290 cities, instead of 315, formed the basis of our research. In a next step we looked up the IATA airport codes in order to assign them to the 290 selected destinations. Actually, the airport codes do not exclusively include airports, but encompass also train and bus stations. Most major airports are indeed directly connected with rail services that provide an alternative to short-haul flights. For example, in addition to the air link between Brussels and Paris Charles de Gaulle, Air France offers the possibility to take the Thalys High Speed train, and it is possible to make reservations and buy tickets at Brussels-Midi train station. Passengers receive their boarding passes for the Air France flight at the Brussels agency and can check in at Brussels-Midi station (www.airfrance.be; consulted on 1/12/2004). Because some cities have more than one airport3 and because train and bus stations are included, the total amount of codes is larger than the total number of cities. Our list of codes contains 690 codes, of which 82 are train stations and 20 bus stations. By replacing all codes in the origin and destination fields by their actual names, and by dropping all the records that had not been transformed, we reduced the database to 87 200 records. For the final transformation, two distinct pathways are possible. On the one hand, we can focus on directional flows in order to analyse the number of passengers travelling between specific origin-destination pairs; while on the other hand, we can analyse the total number of passengers travelling between two locations regardless the direction (i.e. the non-directional flows). However, given that we do not know the home-based location of the travellers, we opt to analyse only the non-directional flows. Summing the passengers travelling from A to B with those travelling in the opposite direction, and after grouping the same connections, we obtained 34 908 non-directional flows. Table 1 gives an overview of the data transformation process. Table 1: Overview of the transformation process
By maintaining 34 908 records of the aggregated 650 000 records (i.e. 5.4%), about 60% (321 million) of the total number of passengers travelling worldwide could be captured. One could argue that this figure of 60% is rather low and that no full use is made of the richness of the database. After all, we opt to maintain only 290 cities of the roughly estimated initial 4600 cities that are included in the original database. However, our data selection (i.e. reduction and/or transformation) has as primary aim to come to a more workable database. Moreover, just by keeping only the most representative links (i.e. those origin/destination links with more than 1000 passengers travelling on it both ways within our eight month time frame), we were able to delete 87.5% more or less insignificant trips. The end result is a 290 x 290 matrix that enables us to map the contours of the global network economy. 3. FIRST FINDINGSThe selected set of 290 destinations is composed of 91 European, 46 North-American, 37 Latin-American, 10 Former Soviet Union/Central Asian (FSU/CA), 22 Middle East and North Africa (MENA), 30 Sub-Saharan African, 12 Oceanian, 27 Pacific Asian and 15 South-Asian countries or states. In Appendix a full list is included. The resulting database details the global network economy from a geographical point of view. To obtain insight in its geographical outline, we will analyse this dataset at two levels. First we will concentrate on the regional level (inter and intra regional connections), and second, we will focus on the city level. 3.1. Connections on the Regional LevelIn this paragraph we will analyse inter and intra regional connections. Table 2 summarizes the number of passengers travelling between two regions. The intra regional flows are marked in italic. Table 2: Number of passengers on non-directional regional connections
Summed together, about 321.5 million passengers travelled between the 290 selected destinations in the period January-August 2001. Table 2 shows that approximately one fourth of the total number of passengers is travelling within Europe and within Northern America. The second largest flow occurs on the connection between Europe and Northern America, and captures about one out of twelve passengers travelling worldwide. In third place, we find the intra-Asian flow, which represents about 6% of all travellers. Note that two of the three largest flows concern intra-regional flows. In fact, as also observed by Graham (1999, p. 110), the predominant international traffic flows are described by a continuous east-west, largely northern hemisphere, axis linking Northern America, Europe and Asia. This fact is of course indicative of the importance of the regions in the world economy, and also points to the unquestionable advantages conveyed by the distribution of the world population, cities and demand for air services. We further observe that approximately 70% of all passengers are travelling on origin-destination pairs that are situated in the same geographical region; only 30% of the travellers take the plane towards another region. This clearly suggests that the advent of a network-based economy does not necessary entail the end of geography, since the flows retain distance-decay patterns. Except for Latin America and the Former Soviet Union/Central Asia, the majority of the passengers boarding off in a sub-region previously enplaned in that same sub-region. The importance of those intra-regional connections can partly be explained by the growing tendency towards economic integration regions are striving for since the Second World War (Dicken, 2002). This striving led to the establishment of the GATT, free trade zones (e.g., NAFTA, Mercosur), customs unions (e.g., SACU), common markets (e.g., AFTA, CACM) and economic unions (e.g., EU-25) (Rodrigue et al., 2004). The growing integration allowed for the free movement of people, goods and capital, and induced a notable growth of international trade and airline connections. The largest inter regional passenger flow links Europe with Northern America, and thus seems to follow the growth in the international finance markets. After all, the foreign direct investments between the European Union and the United States are amongst the highest in the world (Knox et al., 2003), just as is the flow of passengers between those two regions. As mentioned earlier, the second largest inter-regional flow links Northern America with Southern America. This large flow could be explained by the geographical proximity of both regions and by the strong ties between the United States and Mexico as a result of the NAFTA. The next important inter-regional links concern Northern America and Pacific Asia, and Europe and Pacific Asia. The large number of passengers travelling between those regions can possibly be explained by the globalization of the economic activity. China and the four so-called Asian Tigers experienced a dramatic increase in manufacturing production. Since 1999, South Korea, Hong Kong, Taiwan and Singapore rank high on the world league table of exporters (Hanink, 1994; Knox et al., 2003). Despite the relatively weak links between all the selected geographical regions and Sub-Saharan Africa, partly due to the armed conflicts, the political instability and development problems characterising this sub-region, the passenger flow between Europe and Africa is not unimportant. This is not surprising since most of the African countries once were colonies of European states. After their independence, African countries maintained the historical ties with the European continent (Burghardt, 1971). The same is true for Asia, and more specifically Southern Asia, which a century ago was largely controlled by the United Kingdom, the Netherlands and France. The small passenger flows between the Former Soviet Union/Central Asia and the other regions can be explained by the (armed) conflicts, the lack of political stability, corruption and crime, insufficient economic freedom, the lack of legal reforms, hyperinflation, etc. that characterise the countries located in the Caucasus (de Pater, 1995). Despite the perceptions of political instability and the violent clashes about the appropriation of foreign oil reserves, the number of passengers travelling between Europe and the MENA countries is larger as the number of intra-MENA passengers. This could be explained by the existence of so-called Euro-Mediterranean partnership agreements between the EU and some countries of the Middle East (Sutherland et al., 2002). From table 2 we also notice that the links between all the regions and Oceania are very weak, except between Pacific Asia and Oceania. This can partly be explained by the fact that Australia mainly does business with Asia (Graham, 1999). The intra-Oceanian flow on the other hand is relatively high. This is due to the fact that a lot of people in Australasia are taking the plane to travel within the national borders, instead of utilising other transport modes such as the bus or the train. Table 3 summarizes the structure of the incoming and outgoing flows (ranked according to the size of the intra-regional flow). The intra regional flow represents the passengers boarding on and off in the same region. The inter regional flow refers to all the passengers travelling between the concerned region and one of the other eight regions. Table 3: Structure of the incoming and outgoing flows
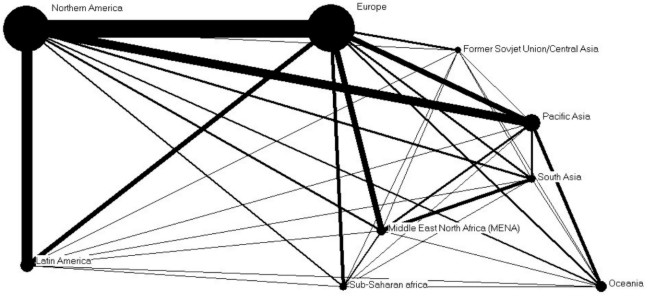
Table 3 shows that slightly more than one out of two passengers enplaning in Europe or Northern America will also board off in that same region. This percentage decreases slightly for passengers embarking in Oceania and Pacific Asia. For passengers enplaning in Sub-Saharan Africa and Latin-America this proportion decreases almost to one third. About one out of four passengers boarding on in the MENA countries or in South Asia takes the plane to travel within the same geographical region. Only a minority of passengers enplaning in the FSU/CA travels inside the region. Table 3 also shows a clear contrast between Europe and Northern America on the one hand and the FSU/CA on the other hand; more than half of the passengers enplaning in Europe or Northern America remain within the region, while in the FSU/CA the opposite is true. This could be explained by the fact that the FSU/CA has a small internal market compared to Europe and Northern America and that its economic power is mainly derived from export oriented business. Figure 1, which is based on the results shown in table 2, illustrates the importance of the passenger flows between the 9 selected regions. The mapping of the regions is only a schematical representation. The links represent the total number of passengers travelling between the regions, which added together equal 321 million. The size of the nodes varies according to the number of intra regional passengers. Figure 1: Passenger flows between the 9 regions
From figure 1 it becomes clear that besides the intra-North-American and the intra-European flows, the largest number of passengers is travelling between Northern America and Europe, Northern America and Pacific Asia, and Europe and Pacific Asia. The figure also shows that Northern America, Europe and Pacific Asia are strongly linked together. It is no coincidence that (i) Western Europe, together with some former European colonies in Africa, South Asia, the Caribbean and Australasia, (ii) Northern America together with some Latin American countries, and (iii) Japan, together with other East Asian countries and the oil-exporting countries of Saudi Arabia and Bahrain, are the three trading blocks within which most of the worlds trade takes place. Furthermore, from 1998 until 2000, the United States, the European Union and Japan accounted for 75% (85%) of the foreign direct inflows (outflows) (Knox et al., 2003). Northern America, Latin-America and Europe are also strongly linked with each other. Europe, Sub-Saharan Africa and the MENA countries are moderately interconnected, as well as are Europe, the MENA countries, Pacific Asia and South Asia. The aforementioned connectivities are in clear contrast with the ties between Sub-Saharan Africa, Oceania, the MENA countries and Latin-America, which are hardly interconnected. Figure 1 clearly shows that the FSU/CA is the least connected region. Its most important ties occur with Europe. 3.2. Connections on the City LevelIn this paragraph we will go beyond the regions and analyse the relations between the cities. In other words, the scope will be more detailed. 3.2.1. Magnitude of the inter-city flows Analysing the database containing the total amount of passengers travelling between two cities regardless of the direction, reveals that the largest flows occurs between Hong Kong and Taipei. In the eight-month time period covered by our data, more than two million passengers were recorded to have flown between both cities. Twelve connections have flows ranging between one and two million passengers, while 58 city-pairs have flows between half a million and one million passengers. About the four fold of this amount (238 city-pairs) counts more than 200 000 and less than 500 000 travellers. Between almost 1100 city-pairs the number of passengers ranges from 50 000 to 200 000. On the majority of the pairwise connections (96%) less than 50 000 passengers embarked in the period January August 2001 (see table 4). Table 4: Size of the connections
Although our database, containing 290 cities, has a theoretical potential of generating (Eq. 1) [(290 x 290) 2904]/2 = 41 905 city pairs, it contains information on only 34 908 city pairs, implying that 6 997 city pairs have no passengers (e.g. the record indicating the number of passengers travelling between, say, Manaus and Riyadh is void; similar numerous other connections can be given as well). Table 4 shows that there is a high concentration of passengers in a limited number of connections. The largest 500 connections capture 50% of the 321 million travellers. To some extent this finding may seem rather self-evident, but it does underline that the majority of global air transport takes place at the major interchange points. It is also a reflection of current passenger demand and business-tourism linkages, and it demonstrates the irrefutable logic of the prevailing structure of the worlds airline network. 3.2.2. Top 10 of the Intra-region Connections Tables 5-14 present an overview of the ten largest air route connections in general, as well as the ten largest intra-Pacific Asian, intra-South Asian, intra-Sub Saharan African, intra-MENA, intra-Northern American, intra-Latin American, intra-European, intra-Oceanian and intra-FSU/CA relations. Note that all given flows are non-directional. In table 5 we notice that only the London-New York connection involves two cities from two distinct geographical regions. All other principal connections have mainly an intra-regional character. Table 5: Top 10 of the largest relations
When comparing tables 5 and 6, it can be noted that the first two intra-Pacific Asian connections (Hong Kong-Taipei and Bangkok-Hong Kong) are part of the top 10 of the largest worldwide connections. Note that the amount of passengers travelling on the 10 largest intra-Pacific Asian connections represents 44% of the total intra-Pacific Asian travellers (see table 2). The connection Hong Kong-Taipei is quite a dominant connection; the passenger flow on this link is almost twice as large as on the second most important intra-Pacific Asia connection. The dominant city in Pacific Asia is clearly Hong Kong. This comes however not as a surprise. Hong Kong, as pointed out by OConnor (1995, p. 278), is strategically the best placed airport in Pacific Asia. It can exploit its centrality between the northern economies of Korea and Japan, and the fast growing south, as well as the central and southern part of China. As an international hub airport, Hong Kong also remains one of the few Asian cities with non-stop daily services to Europe and the United States of America. Table 6: Intra-Pacific Asia flows
The passenger flows on the intra-South Asian connections are much smaller than the intra-Pacific Asian flows (tables 6 and 7). The 10 largest intra-South Asian connections capture about 70% of all the intra-South Asian passengers (see table 2). The connection Bombay-New Delhi is almost twice as large as the second most important intra-South Asia connection, and thus confirms its dominance. Note that in 6 out of the top 10 connections Bombay is involved. Table 7: Intra-South Asia flows
When comparing tables 5 and 8, it can be noted that the largest intra-Sub Saharan African connection is also the sixth largest connection in general. The top 10 of the intra-Sub Saharan African air transport flows captures almost 80% of the total amount of passengers travelling within Sub-Saharan Africa (see table 2). The connection Cape Town-Johannesburg is a very important link; it captures almost as much passengers as the nine other connections together (table 8). Johannesburg is clearly the dominant city (7 out of the top 10 connections involve Johannesburg). Table 8: Intra-Sub Saharan African flows
Table 9 shows that the connection Jeddah-Riyadh is by far the most important intra-MENA connection; it captures almost three times more passengers than the next most important intra-MENA link. The 10 largest intra-MENA flows represent together slightly less then half the total intra-MENA flow. Dubai is most mentioned in the top 10 connections. Table 9: Intra-MENA flows
The first two intra-Northern American connections (table 10) are also part of the 10 largest connections in general. The total amount of passengers travelling on the 10 largest intra-Northern American connections represent only 12% of the total amount of passengers travelling within the North-American region (see table 2). In table 10 we notice that the discrepancy between the largest and the second largest connection is not as large as for all aforementioned regions (see tables 6, 7, 8, 9). It looks like the 10 largest intra-Northern American connections lose their dominance very gradually in contrast to the Sub-Saharan African connections (table 8). It can also be noted that New York undoubtedly dominates the scene. In 8 out of the top 10 connections New York is involved. Table 10: Intra-Northern America flows
The Latin-American connections count fewer passengers than the intra-Northern American connections (table 11). The largest intra-Latin-American connection (Rio de Janeiro-Sao Paulo) does not appear in the top 10 of the largest worldwide connections; it ranks in 14th position. Sao Paulo can be considered the main gateway city. The importance of the inter-Latin-American connections diminishes very gradually, just as is the case with the Northern American inter-region connections. Table 11: Intra-Latin America flows
Europe is the only region where the first five intra-regional connections exceed the threshold of one million passengers (table 12). Three of the ten largest intra-European relations are part of the ten largest worldwide connections. The ten largest intra-European connections represent about 12% of the total amount of passengers travelling within Europe. The largest intra-European connection (Milan-Rome) is only slightly more important than the second largest intra-European connection (Amsterdam-London). The importance of the ranked connections diminishes very gradually. Note that half of the top 10 connections involve London. Table 12: Intra-European flows
The intra-FSU/CA connections are by far the smallest intra regional connections. No connection represented in table 13 is large enough to be included in the top 10 of the largest worldwide connections (table 5). The relation Moscow-St Petersburg, for instance, is only ranked 887th in terms of worldwide connections. The connections in table 13 capture about 94% of the total intra-FSU/CA flow. We notice a large gap between the second and the third most important intra-FSU/CA connection; the connections Moscow-St Petersburg and Kiev-Moscow dominate by far the intra-FSU/CA air transport flows. The dominance of Moscow is this top 10 is also very obvious. Table 13: Intra FSU/CA flows
In table 14 we notice that the first intra-Oceanian connection is also the third largest connection in general. The ten largest intra-Oceanian relations capture 70% of all the passengers boarding on and off in Oceania. The most dominant connection appears to be Melbourne-Sydney. The second most important connection (Brisbane-Sydney) captures less than half the number of passengers travelling between Melbourne and Sydney. Sydney is Oceanians main airport city. Table 14: Intra-Oceanian flows
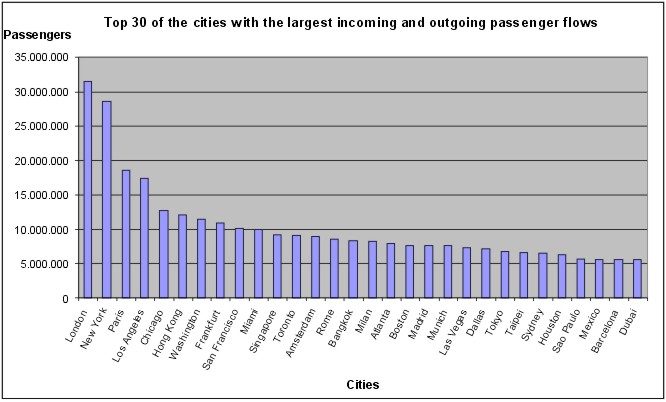
3.2.3. Arrivals and Departures When analysing the number of passengers departing from and arriving in each of the 290 selected cities, we notice that London dominates the scene with 31.5 million passengers, closely followed by New York with 28.6 million passengers. Paris appears in the third position with 18.6 million passengers, followed by Los Angeles, with approximately 17.5 million passengers. Chicago and Hong Kong occupy the fifth and the sixth place, with roughly 12 million passengers boarding on and off in both cities. Next are Washington and Frankfurt with approximately 11 million passengers, followed by San Francisco and Miami (each about 10 million passengers), which close the top 10 of the cities with the largest incoming and outgoing passenger flows. Figure 2
Table 15 ranks the first 150 cities with the largest number of arrivals and departures. We deduce that more then half of the 290 cities (197 cities) captured less then 2 million passengers in the considered eight-month time period. Since the table represents the first 150 cities, only 56 cities are included in the category 0-2 million, the other 141 cities are not visualised in the table. Approximately half of those 56 cities are European (14 cities) and Latin-American cities (13 cities). Table 15: The 150 cities with the largest number of arrivals and departures
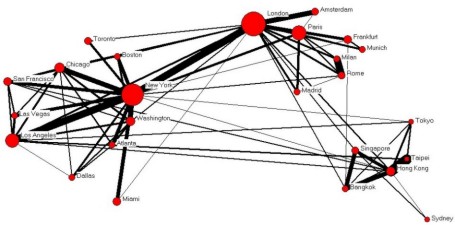
The ranking presented in table 15 differs somewhat from other world city rankings proposed by Friedmann (1995), Beaverstock et al. (1999), Short and Kim (1999) and Alderson and Beckfield (2004). Most remarkable is that in our results Tokyo is ranked in 23rd position, while Beaverstock et al. (1999) rank it in fourth position, Friedmann (1995) in third position, and Alderson and Beckfield (2004), and Short and Kim (1999) even in first position. Our ranking is more in line with the findings of Keeling (1995), who, using data from the ABC World Airways Guide (later the OAG Airline Guide), states that Tokyo is not the dominant regional hub in East Asia ( ), but Singapore and Hong Kong are the most important centres of Asian regional traffic ( ).. Later, Rimmer (2000, p. 84) came to similar conclusions. Another striking difference is that we have more Northern American cities in the upper part of the ranking compared to Alderson and Beckfield (2004), and that, in contrast to Short and Kim (1999) our top 20 does not include any Pacific-Asian city. To better visualize our findings, Figure 35 illustrates the flows between the twelve cities, in which the largest number of passengers board on and off. Figure 3: Structure of the flows between the twelve cities with the largest number of incoming and outgoing passengers
The totality of the flows between the twelve cities in figure 3 represents about 7% of all the passengers travelling between the selected 290 cities. We clearly notice that New York is strongly linked with all other cities, except with Singapore. London has a strong relation with the other two European cities; Paris and Frankfurt. Singapore is strongly interconnected with Hong Kong, but is only slightly linked to the other 10 cities. Figure 4 is an extended version of figure 3 and represents the flows of the 25 cities with the largest number of passengers. Figure 4: Structure of the flows between the 25 cities with the largest number of passengers
Figure 4 only visualises the links between the cities that are larger then 275 000 passengers. The size of the nodes varies according to the total number of incoming and outgoing passengers as registered in table 15. Note that the geographical location of the regions in figures 3 and 4 is a schematical representation. We clearly notice that it is mainly the connection London-New York that links Northern America with Europe. Figure 4 shows that the five largest Asian cities are more or less isolated from the other regions; their inter-regional connections are less imperative than their intra regional links. 4. CONCLUSIONSThis paper was concerned with mapping the global network economy through one of the most important facilitating transport systems, i.e. airline networks. The major airline routes on the regional level and on the city level were identified on the basis of global passenger flows stemming from the MIDT database. This unique dataset, containing information on global airline bookings and connections relating to more than half a billion passengers, is not troubled by some of the drawbacks typical of other air traffic data sources. For instance, MIDT data detail truly global instead of international air passenger flows; hence, overcome the state-centrism problem. The MIDT data also contain information on real origin/destination passenger travel (i.e. the full trip), thus avoiding an overestimation of the importance of locations acting as hubs, and circumventing the need to work with proxy data. On the regional level, we observed that the largest flows are situated within Northern America and within Europe. The intra-Northern American and intra-European flows capture each about 24% of the total amount of passengers travelling between our 290 selected cities. Beside those two flows, a strong relation between Northern America and Europe can be noted, as well as between Northern America and Latin America. Pacific Asia, Northern America and Europe are strongly interrelated with each other. Europe, Pacific Asia, South Asia and the MENA countries are slightly less interconnected. The connectivities between Europe, the MENA countries and Sub-Saharan Africa are approximately the same as the connectivities between the aforementioned four regions. Oceania, Latin America and Sub-Saharan Africa are only slightly linked with each other. The FSU/CA appears to be the least connected region. Certain relations between regions can be attributed to historical ties (e.g. colonies), while others are the consequence of foreign direct investments or (far-reaching) economic integration that stimulates international trade. Still other relations can simply be explained by geographical proximity. On the city level London is the most important city in terms of arrivals and departures. On its own, London attracts about 5% of all the passengers travelling between the selected 290 cities. The next important city is New York, which represents 4.5% of the sum of the incoming and outgoing passengers. After London, the most important European cities, which capture more then 5 million passengers, are Paris, Frankfurt, Amsterdam, Rome and Milan. Following New York, the most important American cities where more then 8 million passengers arrive and depart are Los Angeles, Chicago, Washington, San Francisco, and Miami. The two only (Pacific) Asian cities in the same category are Hong Kong and Bangkok, which rank respectively in the sixth and fifteenth position. Note that Tokyo ranks only in 23rd position. The first important Oceanian city is Sidney, which ranks on the 25th position. The first city of the MENA countries (Dubai) occupies the 30th position and precedes with 10 places the first Sub Saharan African city (Johannesburg). The top 50 of the cities with the largest number of incoming and outgoing passengers counts 20 Northern American, 16 European, 7 Pacific Asian, 2 Oceanian, 2 Latin-American, 1 South Asian, 1 MENA and 1 Sub-Saharan African city. The most striking difference with precedent studies concerning the ranking of world cities relates to the position of Tokyo. In our research Tokyo does not appear to be an important city in terms of incoming and outgoing passenger flows, while Short and Kim (1999), Beaverstock et al. (1999), Alderson and Beckfield (2004) and Friedmann (1995) rank it in their top 5 of the cities with the largest economic power. We realise that the data set used in this paper is to some extent quite exceptional. It is unique in that it does not suffer from most shortcomings typical of other airline databases. As a source for doing global network connectivity research, it is therefore far from fully explored. In future research we would like to focus on a number of interesting topics. In this respect we can mention an extensive hub analysis, with the measurement of the hubness of cities, the identification of the hubs per region, the number of passengers per hub, the hubs used by the most important airlines, etc. We also point to doing comparative analyses with existing world city research and to do more in-depth regional and city regional analyses using global data. ACKNOWLEDGEMENTThe authors would like to thank Peter J. Taylor (Loughborough University) for his useful comments in preparing this paper. All remaining errors are the responsibility of the authors. REFERENCESAEA (Association of European Airlines), 2002. Yearbook 2002, www.aea.be Alderson, A.S., Beckfield, J., 2004. Power and Position in the World City System. American Journal of Sociology. 109, 811-851. Allen, J., 1999. Cities of power and influence. In: Allen, J., Massey, D., Pryke, M. (Eds.), Unsettling Cities. London: Routledge, pp.181-229. Beaverstock, J.V., Smith, R.G., Taylor, P.J., 1999. A roster of world cities. Cities. 16(6), 445-458. Boberg, K.B., Collison, F.M., 1989. International air transportation trends in the Pacific Bassin. Transportation Journal. 28(3), 24-35. Borgatti, S.P., Everett, M.G., Freeman, L.C., 2002. Ucinet for Windows: Software for Social Network Analysis. Harvard, MA: Analytic Technologies. Burghardt, A.F., 1971. A hypothesis about gateway cities. Annals of the Association of American Geographers. 61, 269-285. Castells, M., 1996. The Rise of the Network Society. Oxford: Blackwell. Cattan, N., 1990. Une image du réseau des métropoles européennes par le trafic aérien. LEspace Géographique. 20(2), 105-115. Cattan, N., 1995. Attractivity and internationalisation of major European cities: the example of air traffic. Urban Studies. 32(2), 303-312. De Pater, B., 1995. Eenwording en verbrokkeling. Paradox van de regionale dynamiek. Assen: Van Gorcum. Derudder, B., Taylor, P.J., Witlox, F., Catalano, G., 2003. Hierarchical tendencies and regional patterns in the world city network: a global urban analysis of 234 cities. Regional Studies. 37(9), 875-886. Derudder, B., Vereecken, L., Witlox, F., 2004. An appraisal of the use of airline data in assessments of the world city network. GaWC Research Bulletin Nr. 152. Available on-line at http://www.lboro.ac.uk/gawc/rb/rb152.html Dicken, P., 2002. Trading worlds. In: Johnston R.J., Taylor P.J., Watts M.J. (Eds.), Geographies of Global Change. Remapping the World. London: Blackwell Publishing, pp. 43-56. Friedmann, J., 1995. The world city hypothesis. In: Knox P.L., Taylor P.J. (Eds), World Cities in a World-System. Cambridge: Cambridge University Press, pp. 317-331. Graham, B., 1999. The geography of air transport in Australasia: a global perspective. Australian Geographical Studies. 37(2), 105-113. Goetzl, D., 2000. Southwest airlines takes flight fare fight to the web. Advertising Age. 71(40), 20-22. Hanink, D.M., 1993. The International Economy; a Geographical Perspective. New York: John Wiley & Sons. Keeling, D.J., 1995. Transport and the world city paradigm. In: Knox, P.L., Taylor, P.J. (Eds), World Cities in a World System, Cambridge: Cambridge University Press, pp. 115-131. Knox, P., Agnew, J., McCarthy, L., 2003. The Geography of the World Economy, 4th Edition. New York: Oxford University Press. Kunzmann, K.R., 1998. World city regions in Europe: structural change and future challenges. In: Lo, F-C, Yeung, Y-M, (Eds), Globalization and the World of Large Cities. Tokyo: United Nations University Press, pp. 37-76. Matsumoto, H., 2004. International urban systems and air passenger and cargo flows: some calculations. Journal of Air Transport Management. 10(4), 241-249. Miller, W.H., 1999. Airlines take to the internet. Industry Week. 248(15), 130-134. O'Brien, R., 1992. Global Financial Integration. The End of Geography. London: Pinter. OConnor, K., 1995. Airport development in Southeast Asia. Journal of Transport Geography. 3(4), 269-279. OConnor, K., 2003. Global air travel: toward concentration or dispersal? Journal of Transport Geography. 11(2), 83-92. Rimmer, P.J., 2000. Effects of the Asian crisis on the geography of Southeast Asias air traffic. Journal of Transport Geography. 8(1), 83-97. Rodrigue, J.-P., et al., 2004. Transport Geography on the Web. Hofstra University, Department of Economics & Geography. http://people.hofstra.edu/geotrans (1/12/2004). Sassen, S., 2000. Cities in a World Economy (2nd Edition). Thousand Oaks: Pine Forge. Shepherd Business Intelligence, 2004. www.shepsys.com (1/12/2004). Short, J.R., Kim, Y.-H., 1999. Globalization and the City. Essex: Longman. Smith, A.D., Timberlake, M., 1995. Conceptualising and mapping the structure of the world systems city system. Urban Studies. 32(2), 287-302. Smith, A.D., Timberlake, M., 2001. World city networks and hierarchies. American Behavioral Scientist. 44(10), 1656-1678. Smith, A.D., Timberlake, M., 2002. Hierarchies of dominance among world cities: a network approach. In: Sassen S. (Ed.), Global Networks, Linked Cities. London: Routledge, pp. 117-141. Sutherland, P., Siegman, H., Hoekman, B., Messerlin, P.,
2002. Harnessing Trade for Development and Growth in the Middle East. Report
by the Council of Foreign Relations Study Group on Middle East Trade Options.
Taylor, P.J., 2001. Specification of the world city network. Geographical Analysis. 33(2), 181-194. Taylor, P.J., 2004. World City Network. A Global Urban Analysis. London and New York: Routlegde. Taylor, P.J., Catalano, G., Walker, D.R.F., 2002. Measurement of the world city network. Urban Studies. 39(13), 2367-2376. Taylor, P.J., Walker, D.R.F., 2004. Urban hinterworlds revisited. Geography. 89(2): 145-151. Yeung, H.W.-C., 1998. Capital, state and space: contesting the borderless world. Transactions of the Institute of British Geographers. 23(3), 291-309. Zook, M.A., Brunn, S.D., 2004. From podes to antipodes; New dimensions in mapping global time, cost and distance. Paper prepared for Specialist Workshop on Globalisation in the World-System: Mapping change over time. NOTES* Corresponding author, Ghent University, Department of Geography, frank.witlox@ugent.be 1. Boberg and Collison (1989, p. 25) for instance note that in the United States passenger counts are taken as points where the passengers clear customs and immigration. In other words, a passenger that originates a trip in Chicago using a flight to Tokyo via Seattle, will have Seattle listed as the origin if it is the clearance point for customs and immigration. 2. The field ‘number of passengers’ unfortunately does not make a distinction between passengers travelling in first, business or economy class. Both categories of passengers are incorporated in the same field. Since our data comprise some holiday periods (carnival, Easter, summer holiday) and since tourists mostly travel during holidays, this could induce some seasonal fluctuations. 3. The obvious example is London with its airports Gatwick, Heathrow, Luton International, Stansted, London City, London Metropolitan Area, London Southend and Biggin Hill. The presence of more than one airport in a single city also explains why it is possible to have an air connection within the same city (for example, from London to London). 4. The number of passengers on the intra-city connections (e.g. from London (Stansted) to London (City Airport)) is negligible. 5. Figure 3 (like Figure 1) was constructed using the Ucinet software (Borgatti et al., 2002). Appendix
Edited and posted on the web on 8th December 2004 Note: This Research Bulletin is a source paper for upcoming Research Bulletins such as RB 173 and RB 187 and will not be published in its present form. |
|||||||||||||||||||||||||||||||||||||||||||||||||||||||||||||||||||||||||||||||||||||||||||||||||||||||||||||||||||||||||||||||||||||||||||||||||||||||||||||||||||||||||||||||||||||||||||||||||||||||||||||||||||||||||||||||||||||||||||||||||||||||||||||||||||||||||||||||||||||||||||||||||||||||||||||||||||||||||||||||||||||||||||||||||||||||||||||||||||||||||||||||||||||||||||||||||||||||||||||||||||||||||||||||||||||||||||||||||||||||||||||||||||||||||||||||||||||||||||||||||||||||||||||||||||||||||||||||||||||||||||||||||||||||||||||||||||||||||||||||||||||||||||||||||||||||||||||||||||||||||||||||||||||||||||||||||||||||||||||||||||||||||||||||||||||||||||||||||||||||||||||||||||||||||||||||||||||||||||||||||||||||||||||||||||||||||||||||||||||||||||||||||||||||||||||||||||||||||||||||||||||||||||||||||||||||||||||||||||||||||||||||||||||||||||||||||||||||||||||||||||||||||||||||||||||||||||||||||||||||||||||||||||||||||||||||||||||||||||||||||||||||||||||||||||||||||||||||||||||||