GaWC Research Bulletin 187 |
|
|
|
This Research Bulletin has been published in Tijdschrift voor Economische en Sociale Geografie, 98 (3), (2007), 307-324. doi:10.1111/j.1467-9663.2007.00399.x Please refer to the published version when quoting the paper.
1. INTRODUCTIONThis paper aims to contribute to the literature on the rise of so-called ‘network cities’ through an empirical analysis of hubs in the global airline network. Airline hubs are essentially places where passengers change planes to reach their final destination. The theoretical foundations of the research on ‘network cities’ can implicitly be traced back to the work of urban sociologist Manuel Castells (1996, 2002), whose theory on the networked spatiality of contemporary globalization processes has forced urban researchers to confront some of their basic assumptions. Castells’ assertion is that our society is increasingly constructed around ‘spaces of flows’. This implies, for instance, that cities are no longer exclusively identifiable for their stable embeddedness in a given territorial milieu. They need, instead, to be viewed as changing connective configurations which can be thought of as nodes in networks that are being deployed at myriad scales. Castells (1996, p. 415) thereby suggests that Sassen’s well-known global cities are “the most direct illustration” of this new spatial logic: the relative importance of the relationships between global cities and their surrounding hinterlands seems to have dramatically decreased with respect to the importance of the relationships that interlink global cities in highly specialized, transnational networks (Sassen 2001, p. xix). The rise of this ‘world city network’ (Taylor 2004) may be the prime example of the emergence of ‘network cities’, but it can be noted that there are many more instances in which cities derive their functional centrality from a privileged position in transnational networks. This is particularly evident in some recent analyses of the urban spatiality of the infrastructure networks that make up the backbone of the Internet (Townsend 2001a,b: Malecki & Gorman 2001; Gorman 2002; Malecki 2002; Rutherford et al. 2004; Zook 2005): the infrastructural operation of this essentially urban technology does not depend on physical distance, which implies that functional centrality needs to be assessed on the basis of what flows through a given city. The empirical identification of key cities should therefore be based on a relational matrix that summarizes the connectivity between the various switching points in the overall network. Interestingly, recent empirical analyses of the Internet backbone revealed that the geography of such infrastructure networks tends to diverge from that of the world city networks identified by Taylor (2004; see Rutherford et al. 2006). Although a preliminary assessment of aggregated backbone networks disclosed that the concept of global cities represents a “body of theory that is particularly useful for understanding the economic geography of the Internet on the global scale” (Malecki 2002, p. 404), there is equally ample evidence that this commonsensical relation is waning. The role of global cities as prime switching points in backbone networks is increasingly supplemented by other sites within or without their regions, so that these places can be regarded as network cities in their own right. In particular, some of these emerging centres function as gateways for high-bandwidth backbone connections between different regions. Rutherford et al. (2004), for instance, note that Vienna and Prague have good network presence and quite large bandwidth connections because they act as gateways between the core area of western Europe and eastern Europe. The major point here is that these cities have become more crucial than they would have been otherwise because of their role as switching points in the overall network: their functional centrality is real, but does not depend on their own hinterland1. Similar trends are taking place in global air transport (Doganis 2001, 2005; Bowen 2002). While airline passenger networks have traditionally been oriented towards major cities2, there is a continuous shift towards a more polycentric organisation. As a consequence, some of the cities that are gaining prominence in this new polycentric structure seem to derive their centrality from their role as hubs rather than as origins and/or destinations in their own right. These cities are, of course, hallmark example of ‘network cities’, and it is the prime purpose of this paper to identify these cities empirically. Although much conceptual research has been devoted to airline hubs, it can be noted that such a large-scale empirical identification has been lacking. The major reason for this is a structural lack of suitable data. To overcome this problem, we introduce a previously untapped data source that does not suffer from the problems associated with standard airline statistics: our so-called ‘Marketing Information Data Transfer’ (MIDT) data source contains information on actual, transnational connections, which allows for a detailed empirical assessment of the intensity and the spatiality of hub structures in the global airline network. The paper is divided in two main parts. The first part of the paper presents our analytical framework. Here, we consecutively deal with the rationale of hub-and-spoke networks in the airline industry, some basic measures to identify hubs, and our dataset. The second part of the paper deals with the actual empirical analysis, and is organized in two main sections. The first section presents a straightforward analysis of major airline hubs in absolute and relative terms, in addition to a measure that focuses on the number of cities that make intense use of a hub. The second section, then, goes beyond these rankings and assesses the spatiality of hub-and-spoke organisation. This is achieved through an examination of the percentage of passengers connected in the own region and some notable case studies. In a short conclusion, the implications and some avenues for future research are discussed. 2. Identifying hubs: rationale, methodology and data2.1. Hub-and-Spoke Networks in the Airline IndustryThe importance of specific switching points in the global airline network can be traced back to the adoption of the hub-and-spoke model as primary strategy for organizing route structures. The hub-and-spoke model refers to the image of a bicycle wheel with a core component (the hub) and many subcomponents (the spokes). When airlines adopt this model, they establish one or more switching points where passengers can change planes. From the hubs, the spoke flights take passengers to their final destinations. This implies that a hub is essentially a “type of facility located in a network in such a manner so as to provide a switching point for flows between other interacting nodes” (Fotheringham & O’Kelly 1989, p. 171). Figure 1 presents an example of an ‘ideal’ hub-and-spoke network and an ‘ideal’ point-to-point network. Figure 1a: Hub-and-spoke network
Figure 1b: Point-to-point network
When an airline organizes its network through a point-to-point model, it requires a total of [N x (N-1)]/2 routes to connect all the nodes in the network. Thus, in Figure 1, a total of 28 routes need to be serviced. The number of routes drops substantially when an airline adopts the hub-and-spoke model: only N-1 routes need to be serviced if a hub is established and direct flights are provided between the hub and all other nodes in the network (Shaw 1993, p. 47). This hub-and-spoke structure with a single central airport hub is equally shown in Figure 1: seven routes suffice to connect all nodes in the network. In practice, the route structures of major airlines exhibit a mixture of both organization forms, with (i) direct connections between major airports, and (ii) a hub-and-spoke network to ensure that every node is connected to the overall network. Although the hub-and-spoke model may involve the disadvantage of a longer overall travel time, its advantages are obvious: there are fewer routes to service, which in turn yields the possibility of higher flight frequencies and bigger aircrafts3. The reason for the mounting success of the hub-and-spoke model are spelled out in more detail in Shaw (1993) and Button (2002, 2004), but one of the major driving forces is that this model allows “airlines to exploit important productive efficiencies due to the presence of economies of traffic density and economic of scope” (Nero 1999, p. 226). The growing relevance of the hub-and-spoke model has, however, equally been fuelled by some ‘external’ trends. For instance, the deregulation pacts in Europe and the United States were a major force in the transition towards hub-and-spoke models. Indeed, most major US carriers have adopted the hub-and-spoke model after the Airline Deregulation Act in 1978, while major European airlines have increasingly been moving in the same direction since the deregulation of the European market in the period 1988-1997 (Burghouwt & Veldhuis 2005)4. Although it can be expected that the further liberalisation of air traffic will once again reinforce the trend towards hub-and-spoke networks, there are at the same time some powerful countertendencies at work. The most important countertendency is the mounting success of low-cost carriers, which are notorious for their use of a point-to-point organisation. The ensuing reinstatement of large-scale point-to-point models challenges the gradual shift towards hub-and-spoke networks, and this is likely to gain further pace as low-cost carriers continue to increase their market shares (De Groote 2005). It is difficult at this stage to predict how the total share of both organisational networks will evolve, but it is obvious that both organisational systems will continue to co-exist. 2.2. Measuring Airline HubsOne of the research agendas that has accompanied the rise of hub-and-spoke networks focuses on the detection of hubs in airline networks (Shaw 1993, p. 48). Button (2002) hereby reminds us that it is helpful to be clear on what is being discussed in research on hubs. He observes that there are in fact a number of coexisting definitions, since “there is certainly no hard nor fast economic or legal definition of a hub airport” (p. 179). Assessments of market concentration in a relatively limited number of hubs have therefore employed a variety of quantifiable definitions, whereby “the lack of any universally accepted definition can be confusing in debate and, more importantly, can lead to a misunderstanding of what the role of any hub might be” (p. 180; see also O’Kelly 1986, 1992; Chou 1990; Shaw 1993; Button et al. 1999; Button 2004). Some of the potential confusion emanates from there being different types of hubs. Indeed, despite their shared role as switching point for all sorts of traffic, the character of hubs may significantly diverge on the basis of their exact function in the overall network. Fleming and Hayuth (1994), for instance, distinguish between ‘centrality’ and ‘intermediacy’ for describing the spatial characteristics of transportation hubs. A hub can be considered ‘central’ if its role as important switching point is complemented with other important node characteristics (e.g. in point-to-point flows). The notion of ‘intermediacy’, in contrast, refers to the situation in which a node’s function as switching point comes to dominate its overall functionality: re-routing traffic takes precedence over all other functions. Our measurements, detailed below, acknowledge this distinction, and both ‘hub centrality’ and ‘hub intermediacy’ will therefore be measured separately. The first step towards a detailed empirical analysis of airline hubs, however, rests on an accurate description of the territorial basis of hubs. In this paper, we employ the definition of the Federal Aviation Administration (FAA), which designates hubs as geographic areas that serve as transaction centres for air traffic. The FAA definition therefore draws on communities of airports (i.e. cities) rather than on individual airports. Based on this definition, the FAA employs a classification scheme that distinguishes between ‘small’, ‘medium’ and ‘large’ hubs. This threefold classification is based on the ratio between (i) the number of passengers making on onward connection from the node, and (ii) the number of passengers that use the node as origin or as final destination. Although we will follow the FAA in its designation of hubs as geographic areas that act as transaction centres for air traffic, we will employ a somewhat more extensive framework of analysis. Drawing on Shaw (1993), we will engage in (i) a straightforward overview of the major hubs in absolute terms, (ii) an FAA-like analysis of the major airline hubs in relative terms, and (iii) a measure that focuses on the number of cities that make intense use of a hub. The first measure simply examines the absolutehub intensity at network nodes (denoted AH), i.e. hubs are identified in terms of the total number of passengers that use the node to make an onward connection. Following Fleming and Hayuth (1994), this can be conceived as a measure of ‘centrality’. The second measure looks at the relativehub intensity at network nodes (denoted RH), and is computed by dividing the number of hub passengers by all passengers that make use of the node. This measure is similar to the FAA-classification, because hubs are identified by comparing the amount of hub passengers to the overall traffic at the node. Since this measure assesses the importance of a node’s hub function in terms of its overall functionality, this can be conceived as a measure of ‘intermediacy’ in the scheme proposed by Fleming and Hayuth (1994). If RH = 0, then the city functions as pure origin/destination node. If RH = 1, then the node functions exclusively as an intermediate switching point for passenger traffic. The third measure, in turn, acknowledges that hubs not only connect a large number of passengers, but also a large number of different cities. Thus, rather than the two previous measures, which focus on the total number of connected passengers, this third measure looks at the number of cities that make intense use of a hub (denoted CH). The hub function CH of a node can hereby be computed as follows:
Whereby N is the total number of nodes in the network, C j equals 1 if passengers from city j employ a city as hub, and C jequals 0 if this is not the case. This measure may be misleading if it neglects the intensity of the connections between the different cities. Therefore, in our analysis, C j is only assigned a ‘1’ if more than 10 000 passengers from city j use this city as a hub in the period under investigation5. A large value of CH suggests that a node acts as a switching point for a large number of different cities, a small value suggests that hub passengers set out from a relatively few cities. It can, of course, be expected that results of this measure will be influenced by the total number of hub passengers (AH), and a correct interpretation of the CH-results therefore requires a confrontation with the AH-results. Put simply: a higher position in the CH-ranking than in the AH-ranking suggests that, on average, hub passengers are pulled in from a larger number of different network nodes. Taken together, these three measures allow ranking cities on the basis of their ‘hubness’ in airline networks. However, they do not give insight in the spatiality of a city’s hub function: these measures are in a way ‘de-spatialized’ because they simply focus on the number of passengers/cities that use a node as a switching point. In our empirical analysis, we will therefore equally focus on the spatial patterning of some major hubs. This will be achieved through an examination of the proportion of ‘regional’ hub passengers and a discussion of some notable case studies. 2.3. Data2.3.1. Problems associated with standard data sources - Although the lack of an agreed upon hub definition has not facilitated large-scale empirical studies, the real reason for the absence of such research has been inadequate data (Veldhuis 1997). The first and most obvious data problem is that hub measures require information on the actual routes flown by passengers. Standard data sources, however, contain information on the individual legs of a given trip rather than on the trip as a whole. This implies that if a passenger makes use of a hub, both the spatiality of the ‘real’ trip and the hub function of the employed switching point remain obscure (Derudder & Witlox 2005a,b). As a consequence, these data sources do not allow separating a city’s hub function from its role as genuine origin/destination node. Thus, when a passenger flies from Paris to Seattle via New York, neither the intensity nor the spatiality of New York’s hub function can effectively be gauged through the measures outlined in the previous paragraph. In other words, the whole idea of hubs is that passengers make onward connections, but such information is only seldom registered in standard airline statistics (e.g. International Civil Aviation Organization (ICAO), International Air Transport Association (IATA), Official Airline Guide (OAG) and the Association of European Airlines (AEA)). Second, none of the standard data sources are truly global. Airline statistics tend to be either international (e.g. ICAO, IATA) or regional in focus (e.g. AEA). International data capture inter-state rather than trans-state flows. Thus, for instance, important connections such as Los Angeles-New York and Chicago-New York do not feature in the ICAO data, while the pre-1997 air passenger traffic between Hong Kong and London was equally considered to be ‘national’ (Derudder & Witlox 2005a,b). This subtle bias towards international rather than global flows may undervalue the hub function of cities that are situated in large and/or significant nation-states (notably the United States)6. Regional data, on the other hand, obviously focus on a specific world region. This makes them, of course, inadequate for a hub analysis of the global airline network. A solution here may be to combine several regional data sources into a single dataset, but further problems may arise: data are not necessarily gathered, measured, and published in the same year7. 2.3.2. A new dataset - The lack of readily available data of actual flown routes in the global airline network makes standard data sources ill-suited for our purposes. We will therefore employ a new and previously untapped data source that does not suffer from the above-mentioned drawbacks: the so-called ‘Marketing Information Data Transfer’ (MIDT) database. This database contains information on airline bookings made through so-called Global Distribution Systems (GDS)8. These are electronic platforms used by travel agencies to manage airline bookings, hotel reservations and car rentals. Well-known examples of GDS are Galileo, Apollo, Sabre, Worldspan, Amadeus, Topas, Infini and Abaccus (Shepherd Business Intelligence 2004). For every booking, the MIDT database contains information on airline codes, flight numbers, board on/off cities, switching points, booking date, departure date, agency name, cancellation indicators, and so on. Through the cooperation of an airline, we were able to make use of the information contained in a MIDT database that covers the period January-August 2001 and gives information on a total of 547 410 397 passengers movements9. Although most airline bookings are made through GDS, this MIDT database admittedly bypasses a fair amount of bookings. For instance, our dataset is largely void of information on low cost carriers such as Southwest, EasyJet or Ryanair. The latter company, for instance, makes exclusive use of direct sales, thereby avoiding the use of intermediate agencies and GDS. Because of reduced costs, direct sales are also increasingly important for major carriers: estimates show that direct bookings via the Internet cost an airline 1 US$ on average, while costs for bookings at travel agents may be as high as 10 US$ (Goetzl 2000). It is estimated that in 1999 about 20% of all airline trips were sold through direct booking (Miller 1999). That said, low-cost carriers, the most important users of direct sales, are known to make less use of hub-and-spoke models (De Groote 2005), which suggests that our GDS-based data source gives only a slightly biased picture of hub use. To prepare our database for analysis, we first transformed it so that only information on origin, destination and stopovers (if any) was preserved10. Second, we removed the least important destinations from the database: airports servicing less than 100 000 passengers throughout this eight month period were deleted (this equals a volume as low as 400 passengers/day). The third transformation entailed recoding IATA codes to city codes: employing the FAA definition implies that data on multiple airport cities has to be aggregated11 . Thus, JFK, La Guardia and Newark data were combined in a single New York measure. This transformed database summarizes the actual linkages between the 687 most connected nodes in the global airline network for the period January-August 2001. For each city-pair, it is possible to investigate how many passengers made use of this particular connection, and, more importantly, it equally becomes possible to assess the spatiality of this connection. One further advantage is that our dataset does not distinguish between intra-state and inter-state flows: the connection New York-Chicago is treated similarly to the connection New York-Toronto. Table 1, which summarizes the actual routes employed on the Paris-Seattle and Miami-Seattle connections, reveals the possibilities of this dataset. The most popular way of flying from Paris to Seattle is via London, closely followed by a direct connection between both cities. Other popular hubs for this connection are New York, Copenhagen and Pittsburgh. Miami and Seattle, in contrast, have fairly well developed direct connections: 17665 passengers took a direct flight opposed to 24342 passengers that made use of one or more hubs. St. Louis, Dallas and Atlanta are the most important hubs for this particular connection.
Table 1: The number of passengers on the Paris-Seattle and Miami-Seattle connections (top ten hubs + direct)
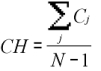
3. Hubs in the global airline network: an empirical analysis3.1. Rankings of CitiesTables 2-4 feature the 25 most important cities for each of the three hub measures. Taken together, the tables point to an overwhelming dominance of European and North American cities, and therefore different organizational trajectories in the global airline network. Figures 2-4 therefore present an overview of the 5 most important hubs per ‘world region’ for each measure12. The most straightforward hub measure focuses on the total number of passengers that make use of a node as a switching point (AH). Perhaps unsurprisingly, Table 2 reveals that major nodes in the global airline network also function as major hubs in the airline network as a whole (perhaps with the exception of Tokyo, and, to a lesser degree, New York). There is a notable regional focus in this ‘global’ hierarchy: 24 of the 25 most important hubs in absolute terms are located in North-America or Europe. The only exception here is Singapore, which is ranked 23th. The table suggests that hub-and-spoke systems are particularly well developed in airline networks centered on North American and European cities. However, that said, the figure clearly shows that this does not imply that airline networks in other regions are characterised by the absence of hubs: the absence of cities from other parts of the world in Table 2 merely hints that the volume of traffic through these hubs is at present too small to feature prominently in rankings based on transnational data. As a consequence, h ubs are by no means unique to US air transportation (see Button 2002, p. 180), albeit that this organisational model seems to be somewhat more developed in the United States and Europe. The chief cause for this regional focus lies in the earlier liberalisation of economic regulations which significantly affected the market conditions (Doganis 2001, p. 6). The reasons for the relative dominance of the Unites States vis-à-vis Europe is that until recently “US carriers can fly from any airport in the United States to a wide range of airports in the EU,” while “European airlines can only operate to the United States from their own country” (Doganis 2001, p. 46). It is, however, important to stress that these patterns are likely to shift in the near future: the European Union and the United States recently took further steps to allow greater airline access across the Atlantic by signing a preliminary agreement that will almost certainly result in greater international competition and expanded service to cities on both sides of the ocean (Doganis 2005).
Table 2: 25 most important hubs in absolute terms
Figure 2: Five most important hubs per region in absolute terms (AH)
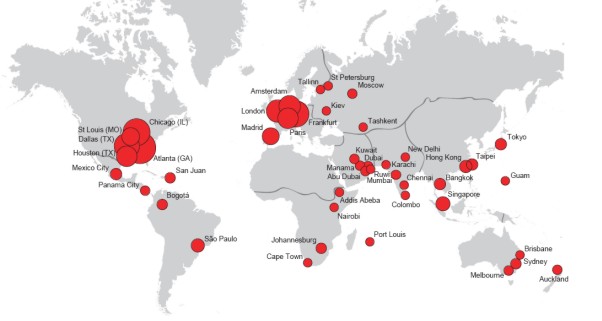
The second hub measure is based on the ratio between the number of passengers using the node as hub and the total number of passengers that make use of this node (RH, Table 3). This measure of ‘intermediacy’ paints a somewhat different picture than that of mere ‘intensity’: cities such as Manama, Panama City, Doha and Reykjavik now feature as major hubs, while they are not particularly strong hubs in absolute terms (where they respectively feature in place 56, 62, 65 and 89). Major nodes such as Miami, London and New York, in contrast, disappear from the upper rungs of the hierarchy (here they respectively feature in place 28, 51 and 90). Cities such as Charlotte, Pittsburgh, Cincinnati and St. Louis are now ranked much higher than Chicago and New York, which implies that these cities function as intermediate gateways for passenger traffic: their major purpose in the network lies in the throughput of passengers rather than in serving as a proper point of origin or destination. In spite of the somewhat different results for ‘intensity’ (Table 2) and ‘intermediacy’ (Table 3), one can still note a largely similar regional focus: 22 cities in the top-25 are located within the United States or Europe (exceptions are Panama, Doha, and Manama). The US dominance is even more markedly here, with 8 cities in the top-10. Figure 3 suggests that the emergence of designated switching points away from major nodes is also apparent in other parts of the world (e.g. Alice Springs in Australia and San Salvador in Brazil), albeit that the shake-up is far less dramatic than in the United States.
Table 3: 25 most important hubs in relative terms
Figure 3: Five most important hubs per region in relative terms (RH)
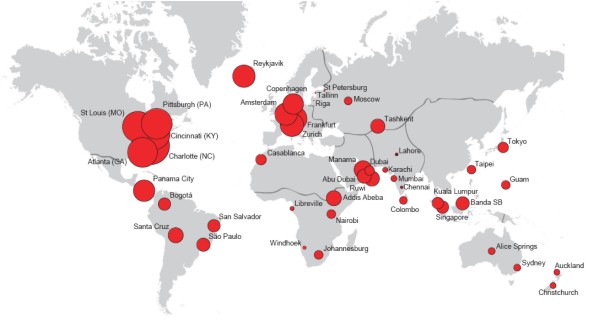
The third measure focuses on the number of cities (rather than the number of passengers) connected by a network node (CH, Table 4 and Figure 4): a city is considered to be an important hub if it connects a large number of cities (with a threshold of 10000 passengers for the period under review). At first sight, this measure yields similar results to the AH-measure: nodes that are used by many passengers en route to their final destinations also connect a large number of city-pairs. This is, of course, somewhat commonsensical, but there are nonetheless some notable changes. In particular, major ‘world cities’ tend to rank higher on the CH-measure than on the AH-measure. Key cities such as Chicago (from 2 nd to 1 st position), Paris (from 8 th to 6 th position), New York (from 10 th to 8 th position) and Los Angeles (from 14 th to 12 th position) move up in the ranking, while secondary cities such as Dallas (from 4 th to 7 th position), Houston (from 7 th to 9 th) and St. Louis (from 9 th to 16th position) are relegated to less important positions. This suggests that, on average, passengers making onward connections in secondary cities set out from a smaller set of cities than passengers making onward connections in the most important cities. Designated hubs such as Reykjavik, Cincinatti, and Charlotte (i.e. cities that rank high on the RH-measure and low on the AH-measure), are on average not important in the CH-ranking, which suggest that their privileged position is subjected to a fair degree of vulnerability to the whims and fancies of major airlines. Key world cities, in contrast, are less dependent on specific supply flows (and therefore corporate strategies), because they recruit their transfer passengers from a broader set of network nodes.
Table 4: 25 most important hubs in terms of the number of connected cities (CH).
Figure 4: Five most important hubs per region in terms of the number of connected cities (CH)
3.2. Spatial Analysis of some Selected HubsTaken together, the rankings in the previous section paint a detailed but essentially despatialized picture of hubness in the global airline network: the rankings reveal which cities act as transaction centres for airline traffic, but they do not give information on the spatial characteristics of a city’s hub-function. In this section, we therefore complement these rankings through an assessment of some key spatial characteristics of hubness: we assess to what degree hubs connect extra-regional passengers, and complement this ranking with a more detailed examination of some notable examples. Table 5 ranks all cities mentioned in Tables 2-4 on the basis of the percentage of hub passengers connected within the same region. Cities such as Salt Lake City, St. Louis, Denver, Cincinatti, Pittsburgh, and Memphis almost exclusively connect passengers that travel within the United States. Interestingly, these are hubs that tend to rank high on ‘intermediacy’ and relatively low on ‘centrality’. Furthermore, this presence of designated regional hubs is particularly well-developed in the United States. Indeed, with the exception of New York, Miami and Los Angeles, most US hubs have a regional focus. This regionality is far less clear-cut in the case of European cities, although Copenhagen, Brussels and Rome can be designated as ‘European hubs’. Previous empirical world city studies rank Milan higher than Rome (e.g. Beaverstock et al. 1999; Derudder et al. 2003; Taylor & Derudder 2004), and this ‘internationality’ is confirmed in our analysis, with Milan connecting a significantly higher percentage of international passengers. Singapore, London, Miami, Amsterdam and Manama are the most ‘international’ among the important airline hubs. E.g., only 5% of the passengers making an onward connection in Miami travel between two North American cities: as a hub, Miami functions almost exclusively as a gateway for passengers travelling from or to another region.
Table 5: Percentage of hub passengers connected in the own region (only cities featuring in Tables 2-4 are listed).
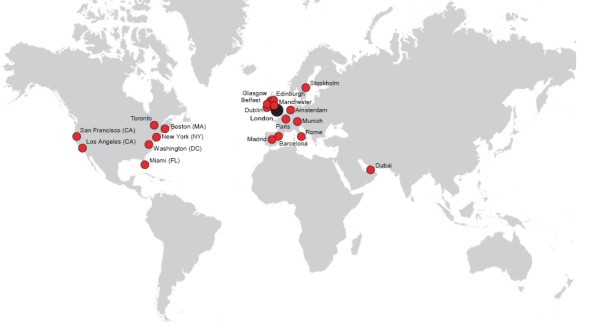
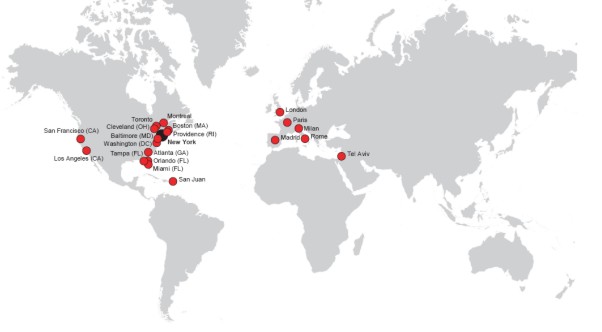
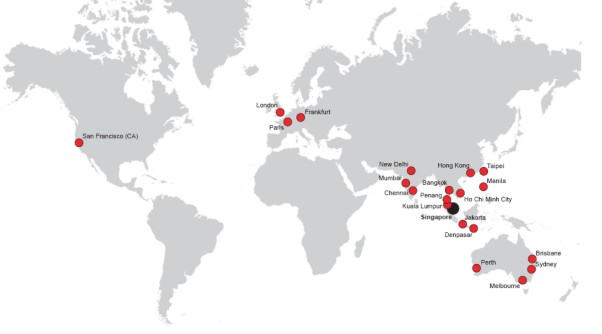
Figures 5-9 reveal the spatiality of the hub function of London, New York, Singapore, Atlanta and Miami. For each of these cities, the figures show the 20 cities that make the most intensive use of this node as hub. The hub function of London and New York is fairly international, albeit that the dominant feeding flows chiefly emanate from North America and the Europe (with the exception of San Juan and Tel Aviv for New York). Singapore’s position is even more international, with an important gateway function for cities in Asia, Australia, and Europe (in addition to San Francisco). The ‘internationality’ of London, New York and particularly Singapore is in sharp contrast with Atlanta, whose dominant resource cities are all located in the United States. Thus, although Atlanta connects a larger number of passengers than New York, its hub function is far more restricted from a geographical point of view. Its most important non-US feeding connections are San Juan (ranked 21), London (ranked 45), and Nassau (ranked 54) . As a consequence, in addition to significant divergences in (i) the level of hubness and (ii) the chief character of a city’s hubness (centrality versus intermediacy), there is equally a scalar differentiation among network nodes: cities with similar patterns of hub intensity for the various measures (centrality, intermediacay, number of cities thoroughly connected) may be very different in their geographical focus.
Figure 5: Twenty cities that make the most intense use of London as hub
Figure 6: Twenty cities that make the most intense use of New York as hub
Figure 7: Twenty cities that make the most intense use of Singapore as hub
Figure 8: Twenty cities that make the most intense use of Atlanta as hub
Figure 9: Twenty cities that make the most intense use of Miami as hub.
Arguably the most interesting case is Miami, which clearly functions as a gateway between North and Latin America. Although Miami does not usually feature as a major world city, our analysis is picking up the suggestion that it does perform a very important regional role as switching point between the USA and Latin America. As a city it has indeed been designated as unusual before, the ‘most foreign city’ in the USA (Nijman 1997), a contingent political (CIA) creation (Grosfoguel 1995), a sort of ‘extra-mural capital’ of Latin America (Brown et al. 2002, see also Derudder et al. 2006), and our analysis lends further empirical support for these theses. 4. ConclusionThe global airline network is a principal channel for the flows that define the architecture of transnational urban networks. In trying to better understanding a specific aspect of the spatial organisation of the global airline network, this paper has attempted to contribute to the literature on the rise of a ‘world city network’ (Taylor 2004) and ‘new network cities’ (Townsend 2001a,b). Perhaps the major finding of our empirical analysis refers to the clear-cut difference between hubs in absolute and relative terms. This lends evidence to recent claims that we are witnessing the rise of a new kind of functional centrality in which certain cities derive their status from a privileged position in urban networks beyond the major ‘world cities’. The emergence of erstwhile less important cities as major hubs can be traced back to their locational advantages (Horner & O’Kelly 2001), i.e. cost savings associated with agglomeration in less important urban areas. The congestion around cities such as Los Angeles, New York and Chicago implies that it becomes increasingly fruitful to bypass them as hubs in regional hub-and-spoke models. This implies that the hub-and-spoke model as a whole may become somewhat dissociated from the major origin/destination nodes in the network, hence the appropriate designation of these hubs as ‘new network cities’. The mounting global interconnectedness of cities thus entails the outsourcing of connectivity down the urban hierarchy. It is, however, obvious that this evolution is still hesitant in that it is largely confined to the emergence of second-tier cities in a regional context: the hub-and-spoke networks centred on these locations typically consist of a limited network of local flights and spokes from other hubs. Figures 6 and 8 clearly demonstrate this: all important spoke flights to and from Atlanta have a regional focus (similar geographies are found for cities such as Charlotte and Salt Lake City), while New York’s spoke flights have an international geography. This suggests the emergence of a scalar division amongst and possibly within network cities. Our MIDT database is fully capable of investigating such scalar divergences, and this sort of analysis we will hope to carry out in the next phase of this research project. REFERENCESAEA ( Association of European Airlines) (2002), Yearbook 2002, www.aea.be. Bowen, J. (2002), Network change, deregulation, and access in the global airline industry. Economic Geography 78 (4), pp. 425-440. Bryan, D.L. & M.E. O’Kelly (1999), Hub-and-spoke networks in air transportation: an analytical review. Journal of Regional Science 39 (2), pp. 275-295. Burghouwt, G. & J.Veldhuis (2005), De concurrentiepositie van hub-luchthavens op de transatlantisch markt. Tijdschrift Vervoerswetenschap 41 (2), pp. 2-10. Button, K., S. Lall, R. Stough, , M. Trice ( 1999), High-technology employment and hub airports. Journal of Air Transport Management 5 (1), pp. 53-59. Button, K. (2002), Debunking some myths about airport hubs. Journal of Air Transport Management 8 (3), pp. 177-188. Button, K. (2004), Economic development and transport hubs. In: K. Button, D.A. Hensher, K.E. Haynes & P.R. Stopher, eds., Handbook of Transport Geography and Spatial Systems (Volume 5, Handbooks in Transport), pp. 77-95. Amsterdam: Elsevier. Brown, E., G. Catalano & P.J. Taylor (2002), Beyond world cities. Central America in a space of flows. Area 34, pp. 139-148. Castells, M. (1996), The Information Age: Economy, Society, and Culture Vol. I – The Rise of the Network Society. Oxford: Blackwell. Castells, M. (2002), Local and global: cities in the network society. Tijdschrift voor Economische en Sociale Geografie 93 (5), pp. 548-558. Chou, Y.-H. (1990), The hierarchical-hub model for airline networks. Transportation Planning and Technology 14, pp. 243-258. Dennis, N. (1994), Airline hub operations in Europe. Journal of Transport Geography 2 (4), pp. 219-233. Dennis, N. (2001) Developments of hubbing at European airports. Air & Space Europe 3 (1), pp. 51-55. De Groote, P. (2005), The Success Story of European Low-Cost Carriers in a Changing Airworld. GaWC Research Bulletin 174 - www.lboro.ac.uk. Derudder, B., P. J. Taylor, F. Witlox, & G. Catalano (2003), Hierarchical tendencies and regional patterns in the world city network: a global urban analysis of 234 cities. Regional Studies 37 (9), pp. 875-886 . Derudder, B. & F. Witlox (2005a), An appraisal of the use of airline data in assessing the world city network: a research note on data. Urban Studies 42 (13), pp. 2371-2388 . Derudder, B. & F. Witlox (2005b), On the use of inadequate airline data in mappings of a global urban system.Journal of Air Transport Management 11 (4), pp. 231-237. Derudder B. , F. Witlox & P.J. Taylor (2006), United States cities in the world city network: comparing their positions using global origins and destinations of airline passengers. Urban Geography, accepted for publication . Doganis, R. (2001), The Airline Business in the 21 st Century. Routledge: Londen and New York. Doganis, R. (2005), The Airline Business in the 21 st Century. Second Edition. Routledge: Londen and New York. Federal Aviation Administration (FAA) (2000), Airport Activity Statistics of Certificated Air Carriers: Summary Tables 2000. http://www.bts.gov. last accessed 25/08/2006. Fleming, D. K. & Y. Hayuth (1994), Spatial characteristics of transportation hubs: centrality and intermediacy. Journal of Transport Geography 2 (1), pp. 3-18. Fotheringham, A.S. & M.E. O’Kelly (1989), Spatial Interaction models: Formulation and Applications. Normwel, MA: Kluwer. Goetzl, D. (2000), Southwest airlines takes flight fare fight to the web. Advertising Age 71 (40), pp. 20-22. Gorman, S. (2002), Where are the web factories: the urban bias of e-business location. Tijdschrift voor Economische en Sociale Geografie 93 (5), pp. 522-536. Grosfoguel, R. (1995), Global logics in the Carribbean city system: the case of Miami. In: P.L. Knox, & P.J. Taylor, eds., World Cities in a World-System, pp. 156-170. Cambridge: Cambridge University Press. Lai, S.L. & L. Whei-Li (2005), Impact analysis of September 11 on air travel demand in the USA. Journal of Air Transport Management 11, pp. 455-458. Horner, M.W. & M.E. O’Kelly (2001), Embedding economies of scale concepts for hub network design. Journal of Transport Geography 9, pp. 255-265. Malecki, E. (2002), The economic geography of the Internet’s infrastructure. Economic Geography 78, pp. 399-424. Malecki, E. & S. Gorman (2001), Maybe the death of distance, but not the end of geography: the Internet as a network. In: T. Leinbach & S. Brunn, eds., Worlds of E-Commerce: Economic, Geographical and Social Dimensions, pp. 87-105. Chichester: John Wiley & Sons. Miller, W.H. (1999) Airlines take to the internet. Industry Week 248 (15), pp. 130-134. Nero, G. (1999), A note on the competitive advantage of large hub-and-spoke networks. Transportation Research E 35, pp. 225-239. Nijman, J. (1997), Globalization to a Latin beat: the Miami growth machine. Annals of the American Academy of Political and Social Sciences 551, pp. 163-176. O’Kelly, M.E. (1986), The location of interacting hub facilities. Transportation Science 20 (2), pp. 92-107. O’Kelly, M. E. (1992), A clustering approach to the planar hub location problem. Annals of Operations Research 40, pp. 339-353. Reynolds-Feighan, A. (2000), The U.S. airport hierarchy and implications for small communities. Urban Studies 37 (3), pp. 557-577. Rutherford, J., A. Gillespie & R. Richardson (2004) , The territoriality of Pan-European telecommunications backbone networks. Journal of Urban Technology 11 (3), pp. 1-34. Rutherford, J., A. Gillespie & R. Richardson (2006) , Technological Connectivities of European Cities? The Potentials and Pitfalls of the Use of Telecommunications Data in Measurements of World City Network Formation. GaWC Research Bulletin 181. Sassen, S. (2001), The Global City: New York, London, Tokyo. Princeton University Press: Princeton, NJ. Shaw, S.-L. (1993), Hub structures of major US passenger airlines. Journal of Transport Geography 1 (1), pp. 47-58. Shepherd Business Intelligence (2004), www.shepsys.com. last accessed 25/08/2006. Smith, D.A. & M.F. Timberlake ( 2001), World city networks and hierarchies, 1977-1997: an empirical analysis of global air travel links. American Behavioral Scientist 44, pp. 1656-1679. Taylor , P.J. (2004), World City Network: a Global Urban Analysis. London: Routledge. Taylor , P.J. & B. Derudder (2004), Porous Europe: European Cities in Global Urban Arenas. Tijdschrift voor Economische en Sociale Geografie 95 (5), pp. 527-538. Townsend, A.M. (2001a), Network cities and the global structure of the Internet. American Behavioral Scientist 44 (10), pp. 1697-1716. Townsend, A.M. (2001b), The Internet and the rise of the new network cities (1969-1999). Environment and Planning B 28, pp. 39-58. Veldhuis, J. (1997), The competitive position of airline networks. Journal of Air Transport Management 3 (4), pp. 181-188. Zook, M.A. (2005), The geography of the Internet industry: Venture Capital, Dot-coms and Local Knowledge . Blackwell Publishers: Oxford. Zook, M.A. & S.D. Brunn (2006), From podes to antipodes: positionalities and global airline geographies. Annals of the Association of American Geographers 96 (3), pp. 471-490.
NOTES*Ben Derudder, Ghent University Department of Geography - Krijgslaan 281/S8 - B9000 Ghent - Belgium, Tel: (+32)92644553, Fax: (+32)92644985 E-mail: ben.derudder@ugent.be ** Lomme Devriendt, Ghent University Department of Geography - Krijgslaan 281/S8 - B9000 Ghent - Belgium, Tel: (+32)92644553, Fax: (+32)92644985 E-mail: lomme.devriendt@ugent.be *** Frank Witlox, Ghent University – Department of Geography - Krijgslaan 281/S8 - B9000 Ghent - Belgium, Tel: (+32)92644553, Fax: (+32)92644985 E-mail: frank.witlox@ugent.be 1It seems therefore fruitful to speak in terms of a so-called ‘hinterworld’, which can be defined as the spatial patterning of a city’s relations with other cities across the world (Taylor 2004). 2 This is, of course, the reason why data on airline passenger movements have been commonly employed as a common sense data source in world city network research (see Smith & Timberlake 2001). 3 In this respect, the rise of hub-and-spoke networks is just a further consequence of the cut-throat competition between the different airline companies, alongside with ‘open skies’, global alliances, low-cost, no frills carriers, electronic commerce and privatisation (Doganis 2001). 4The time lag between both deregulation pacts lag is the main reason why the hub-and-spoke system is still primarily considered to be a ‘US’ way of organizing route structures, although Button (2002) has convincingly argued that this is a misconception. 5 Admittedly, this use of a threshold ‘dumbs down’ our rich dataset by converting the complex flow of passengers into a binary measure, but it does allow to grasp whether hub connects a large number of cities. 6 In addition, in order to preserve the confidentiality of the countries and the airlines, the ICAO only provides air traffic data for international city pairs if at least two airlines are representing at least two different states. As a consequence, hub locations that are serviced by only one airline are not represented in the data. 7 This overwhelming dominance of non-global data is, of course, the chief reason why previous research efforts tend to focus on a specific region, e.g. Robert et al. (1999) and Reynolds-Feighan (2000) for the United States and Dennis (1994, 2001) for Europe. 8 In a recent paper on spatial patterns in the global airline network, Zook and Brunn (2006) equally make use of GDS-based information. By employing a GDS they are able to focus on actual airfares and flying times, which results in a more refined measure of ‘access’. 9 Working with data covering the period before September 2001 may have the advantage that it does not include the impact on passenger air transport induced by the terrorist attacks on 11 September 2001. During the months following this date many destinations were not serviced since numerous connections were (temporarily) removed, and some carriers disappeared from of the market (Lai & Whei-Li 2005). The Association of European Airlines (AEA) announced an intra-European traffic decrease by 11.6% during the last 4 months of 2001, compared to the same period in 2000. On the North-Atlantic routes air traffic dropped severely in November 2001 with 30-35% relative to the previous year. Thereafter the losses diminished and stabilised at 20% at year-end. On the Far Eastern routes, the number of passengers decreased to more than 20% in October and November 2001. However, by March 2002, traffic had almost returned to previous year’s levels (AEA 2002). None of these traffic changes will therefore bias our data. That said, we may have the disadvantage that our data covers only one period, so that no comparisons are possible; we are not able to track changes over time and study the evolution of specific connections. 10 For practical reasons, we only focused on trips that involved one or two stopovers. This seems a justifiable move since the vast majority of airline trips entail three legs or less (Bryan & O’Kelly 1999). 11 In reality, airport codes do not exclusively include airports, but also encompass train and bus stations. Many major airports are indeed directly connected with rail services that provide an alternative to short-haul flights. For example, in addition to the air link between Brussels and Paris Charles de Gaulle, Air France provides the Thalys High Speed train from Brussels South train station. This means that it is possible to ‘board’ at the Brussels station, which has thereby obtained an IATA airport code. However, this implies that because traffic emanating from Brussels’ international railway station has been added to its air transport links, this alternative way of travelling does not distort our analysis (http://www.airfrance.be, last accessed 24/11/2005). 12 The world is hereby divided in nine regions: North-America, Latin-America, Europe, Former Soviet Union/Central Asia, Middle East North Africa (MENA), South Asia, East Asia and the Pacific and Oceania. Some regions do not have five cities with CH > 0, hence the presence of some ‘blank spots’ in Figure 4.
Edited and posted on the web on 14th December 2005; last update 21st February 2007 Note: This Research Bulletin has been published in Tijdschrift voor Economische en Sociale Geografie, 98 (3), (2007), 307-324 |
|||||||||||||||||||||||||||||||||||||||||||||||||||||||||||||||||||||||||||||||||||||||||||||||||||||||||||||||||||||||||||||||||||||||||||||||||||||||||||||||||||||||||||||||||||||||||||||||||||||||||||||||||||||||||||||||||||||||||||||||||||||||||||||||||||||||||||||||||||||||||||||||||||||||||||||||||||||||||||||||||||||||||||||||||||||||||||||||||||||||||||||||||||||||||||||||||||||||||||||||||||||||||||||||||||||||||||||||||||||||||||||||||||||||||||||||||||||||||||||||||||||||||||||||||||||||||||||||||||||||||||||||||||||||||||||||||||||||||||||||||||||||||||||||||||||||||||||||||||||||||||||