GaWC Research Bulletin 77 |
|
|
|
This Research Bulletin has been published in Urban Geography, 24 (5), (2003), 431-441.
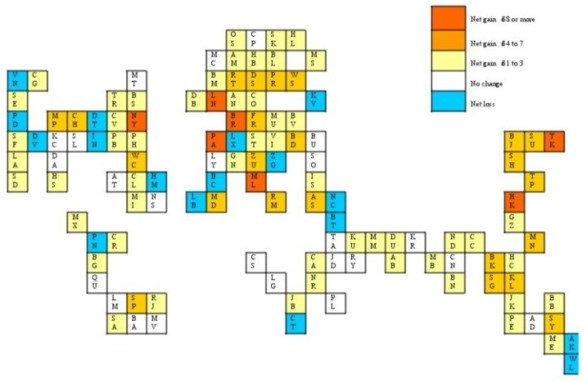
Globalization takes place in cities and cities embody and reflect globalization. Global processes lead to changes in the city and cities rework and situate globalization. (Short and Kim, 1999, p. 9) This is the first report on a research project that is attempting to measure the dynamics of globalization. The specific globalization processes being monitored are the worldwide provisions of advanced producer services (Bagchi-Sen et al., 1997). The production of such services is identified by Sassen (2001) as a key identifier of contemporary world/global cities. In the research reported on here we take her argument a stage further to focus on the network level of world cities, the space of flows through which the cities operate (Castells, 1996, chapter 6). Many firms offering these financial and business services have 'gone global' in the last couple of decades by locating their offices in numerous cities across the world. Through this process world cities are 'interlocked' into a worldwide network by service firms: the resulting world city network is specified in detail in another paper (Taylor, 2001). In this project we are looking at alterations in these office networks over a five-year period from 2000 to 2004. Changes observed in the first year of this period are the subject matter of this initial paper. Since 2000-01 has been a year of world economic downturn, the results reported below indicate how advanced producer services are faring in relatively 'bad times' and how this is impinging on cities worldwide. This is an empirical paper based upon two sets of unique data that allow us to provide a city-based glimpse of contemporary global change. The paper is divided into three parts. First, the foundation data from which the change is monitored is described in terms of collecting information on services and cities and subsequent measuring of global network connectivity. Second, how change is observed is described and its distribution across six service sectors is discussed. Third, the changes are analysed geographically in terms of the importance of cities in the world city network and by world regions. FOUNDATION DATAThe data for 2000 were collected as part of a project that was attempting to specify and measure world city network formation. During a census period of 'summer 2000'1, information was gathered on selected firms in order to describe a world city network in terms of financial and business services. This exercise is described in detail elsewhere (Taylor et al. , 2002a). However, because these data form the starting point of the current project the main features of its collection are presented here. Gathering Data on 'Global Service Firms': The "GaWC 100"Global service firms are defined as producer service firms with offices in at least 15 different cities and which must include at least one city from each of the main globalization arenas: northern America, western Europe and Pacific Asia. They were identified by going down published size rankings of firms in different sectors and checking their geographies from their websites. In addition, because we were interested in comparisons between service sectors we only included sectors in which we could find at least ten global service firms. All such firms for which relevant information could be obtained (largely from websites) were included in the study. This produced 100 firms across six sectors: 18 in accountancy, 15 in advertising, 23 in banking/finance, 11 in insurance, 16 in law and 17 in management consultancy (Appendix A). We term these the "GaWC 100" and it is these firms that we are monitoring in the current project. Information on offices was collected for 316 cities across the world. There were no formal rules for city selection, basically the capital cities of all but the smallest states were included plus many other cities that were known to be relatively important. The idea was to include many more cities than would be subsequently analysed to ensure there were no notable city omissions in the study. For each firm two types of information were collected relating to each city in which it was located. First, we looked for indications of the size of a firm's presence in a city. The best data for this was the number of practitioners a firm employed in a city but this was not always available. Other information such as number of offices or contacts (phones, faxes, etc.) was used as alternative measures of size. Second, extra-territorial functions of offices were recorded. These were offices where there was responsibility for business beyond the city. The obvious examples are headquarters and regional offices but there were many other functions recorded such as inter-city business referrals, technology centres and training centres. The end-result of this data collection was a stock of information describing sizes and functions of the operations of 100 global service firms in 316 cities worldwide. Global Network Connectivity: The Most Connected 123 CitiesThe first analysis on these data was to convert the information on each firm in each city to a 'service value' between 0 and 5 in terms of increasing importance of a city to a firm's global service strategy: no presence in a city scores 0, the city housing the firm's headquarters scores 5, evaluation of size and function information produce intermediate scores (i.e. 2, 3, or 4) - see Taylor (et al., 2002a) for details on defining the boundaries between the levels of score. This created a 100 x 316 matrix of service scores that was used to measure each city's global network connectivity. This was computed as follows: for a given city, (i) take each firm in turn and multiply its service score with the service score for every other city; (ii) sum these products over all firms; (iii) convert this very large sum for each city into a proportion of the largest sum (which is for London) to create relative connectivity measures between zero and unity. For a fully description and justification of this measure see Taylor et al. (2002a). Using these measures, it was decided to concentrate on just those cities with at least one fifth of London's connectivity. This is obviously an arbitrary cut-off point but since it produces a group of 123 cities it provides a selection that is, again, much larger than is normal in studies of world cities. For the purposes of this study, this preliminary network analysis provides a roster of world cities, selected not simply by quantity of services, but, more importantly, in terms of a city's connectivity in the provision of global financial and business services. MONITORING CHANGEDuring our second census period. 'the summer of 2001'2, each of the GaWC 100 firms was investigated and changes in their office networks recorded. These covered a range of alterations including the opening or closing of offices, the addition or reduction of staff and the changing of office functions. Because of this variety of types of change, we standardised the information by reducing it to basic change data. Thus, for the purposes of this paper each example of an alteration between 2000 and 2001 is designated one unit of change. In other words, at this stage of the project we are not differentiating between degrees of change by a firm in a city, we just use the fact that there has been a change and we record it as either an expansion or a retraction. Useable data on change could be found for 86 of the GaWC 100 firms. This reduction in number of firms was due to two main reasons: updating of firms' websites in such a way to forestall comparison, and the elimination of firms through mergers. Nevertheless there remains a large selection of global service firms to monitor. In all 1,074 changes were observed, just over two thirds (68%) of which were expansions. Clearly in this period of world economic downturn, global service firms were able to continue their recent remarkable record of growth. This initial finding is, however, only an aggregate result that conceals important differences between sectors. As can be seen from Table 1, there are clear winners and losers amongst the sectors. In terms of ratio between expansions and retractions, law was by far the most successful global service in 2000-01. Downturns provide rich pickings for lawyers as forced restructuring of economies requires legal expertise to protect all sides from the changes being forced upon them. Insurance seems to be also doing well but in this case there are only a small number of changes from only a few firms so that such an interpretation should treated with caution. Accountancy has an average ratio of expansions to retractions which probably reflects the wide range of services offered by large accountancy firms some of which may do well in a downturn (e.g. bankruptcy management) and others less well (e.g. general auditing).3 There are three services that our results indicate are doing appreciably worse than the services average: banking/finance, advertising, and management consultancy are suffering from less demand for their services resulting in a rather higher proportion of retractions. Notice, however, that all sectors exhibit positive ratios confirming continued growth across advanced producer services albeit to different degrees. GEOGRAPHIES OF CHANGEIn cross-sectional analyses of the foundation data there are two aspects of geography found to be particularly important in describing inter-city relations (Taylor et al. 2002b, 2002c). First, the ranking of cities was critical in the way inter-city relations were organised. Second, although we are dealing only with global service firms, there were strong regional patterns in the inter-city relations. The question arises therefore whether these two geographies are present in the change data. Looking at regions first, the pattern shown in Table 2 is a rather mixed one. From the ratios of expansions to retractions we can see that Pacific Asia is by far the region of greatest service growth. This may represent a 'bounce back' from the Asian financial crisis of 1997-98 but we have no comparable data to confirm this plausible interpretation. Notice that neither Europe nor northern America share in this relative high level of growth. Northern America, in particular, records nearly as much retraction as expansion faring even worse than the ex-USSR region (CIS). In fact, northern America has the next to lowest ratio in this table with only sub-Saharan Africa below. The latter region is the only one with more retractions than expansions recording almost twice as many of the former. This is largely caused by the retreat of banks from the continent. Elsewhere in the erstwhile third world the regions are doing slightly better than Europe recording above average ratios of expansion to retraction. These results are both fairly predictable (e.g. for Pacific Asia) and also quite surprising. The latter is certainly the case for those expecting a traditional 'North-South' pattern to change: it is extremely rare for the richest region (northern America) to be paired with the poorest region (sub-Saharan Africa) in comparisons of world regions. In terms of strata of cities the pattern of expansions and retractions are quite clear-cut: higher ranked cities have larger ratios of expansions to retractions (Table 3). This is what is to be expected in an economic downturn wherein firms focus expansion and consolidation where they have their most profitable offices. Thus there is a definite pattern of increasing concentration of services in the leading cities over the short period 2000-01. This finding might be thought to contradict the failure to find a 'North-South' regional pattern since the vast majority of leading world cities is located in the 'North'. But this is to interpret the results in territorialist terms rather than through network thinking. Quite simply, the 'North' as well as having many leading world cities also has many medium and small world cities. If retraction is a feature of city strata it will be found as readily in the 'North' as in the 'South'. This can only be shown by disaggregating changes down to the level of the individual cities themselves. In Figure 1 changes are shown as net gains or losses for the 123 most connected cities. Although the numbers recorded at this level are relatively small, the resulting pattern is both unambiguous overall and quite sensitive in particular regions. Thus the main gainers are definitely the leading world cities: the top two categories in Figure 1 include almost all those cities commonly discussed in the world city literature. The most notable feature is the high gains with no losses for cities in Pacific Asia which complements the regional result in Table 2. However the interesting cities in Figure 1 are the 17 recording a net loss and these are spread across the world beyond Pacific Asia. They are, without exception, minor cities on the world stage including four USA cities and four specialist small financial centres (Hamilton (Bermuda), Luxembourg, Nicosia and Panama City). In addition, these winners and losers patterns are sensitive when viewing sections of the map in detail. For instance, in Iberia there is concentration in Madrid in stark contrast to Barcelona and Lisbon, in eastern Europe three cities stand out - Budapest, Prague and Warsaw - in contrast to the rest, and in Australasia Sydney stands out especially in relation to the New Zealand cities. These are all examples of local concentration of services within the global whole. Finally, there is one important difference between 'North' and 'South' in Figure 1: the former exhibits much more change, both gains and losses, the latter shows much less change. This is a pattern of a dynamic 'North' and a much more inert 'South' in terms of provision of global business services in world cities. CONCLUSIONGlobalization is inherently dynamic and this research note has shown the geography of one important aspect of economic global change. The main finding is that advanced producer services have become more concentrated in leading world cities over the period 2000-01. Since this period is part of an economic downturn, we have interpreted this as a network version of 'bringing home the legions'. However, this is just one year's results in a research field where there are no other global-scale data on cities to compare with. Thus we cannot rule out the possibility that these one-year changes are merely part of a longer-term process of service concentration for which the economic slowdown has little or no relevance. We will only be able to assess such alternative interpretations as and when our project creates more change data for different world economic circumstances. ACKNOWLEDGEMENTSWe acknowledge the support of the Economic and Social Research Council (UK) for funding projects R000223210 "World City Network Formation in a Space of Flows" (2000-01) and R000239478 "World City Network Formation: Global Connections Audit and Analysis". REFERENCESBagchi-Sen S., and Sen, J. 1997, The current state of knowledge in international business in producer services. Environment and Planning A, Vol. 29, 1153-1174. Castells, M., 1996, The Rise of the Network Society. Oxford, UK: Blackwell Short, J. R. and Kim, Y-H, 1999 Globalization and the City. London: Longman. Sassen, S., 2001, The Global City. Princeton NJ, Princeton University Press. Taylor, P. J., 2001, Specification of the world city network, Geographical Analysis, Vol. 33, 181-94. Taylor, P. J., Catalano, G. and Walker, D. R. F., 2002a, Measuring the world city network, Urban Studies, Vol. 39 Taylor, P. J., Catalano, G., and Walker, D. R. F., 2002b, Exploratory analysis of the world city network, Urban Studies, Vol. 39 Taylor, P. J., Catalano G., and Walker, D. R. F. 2002c, Multiple globalisations: regional, hierarchical and sectoral articulations of business services through world cities, The Services Industries Journal, Vol.
NOTES* Department of Geography, Loughborough University, UK. ** Dipartimento di Sociologia e Scienza Politica, Universita` degli Studi della Calabria, Italy. *** Department of Sociology, University of York, UK. 1.Because of the quantity of data collected the census period could not more precise than this. 2. See footnote 1. 3. The table also shows that the largest proportion of changes are in accountancy: this reflects the fact that accountancy firms have far more offices than other global service firms (see Taylor et al. (2002a), Table 1). Table 1: Change by sectors
Table 2: Change by world regions
Australasia includes Austalia, New Zealand, Pacific Islands Europe includes Turkey, Cyprus and Baltic states, not CIS Latin America includes Caribbean states North Africa/Middle East includes African and Asian states (except Turkey) with a Mediterranean coast plus Arabia and Gulf states Northern America includes USA, Canada, Bermuda Pacific Asia includes all Asian states with a Pacific coast Sub-Saharan Africa includes all African states without a Mediterranean coast South Asia includes from Pakistan to Myanmar (Burma) CIS (Commonwealth of Independent States) includes ex-USSR states in Europe (except for Baltic states) and Central Asia
Table 3: Change by strata
Figure 1: Service change in world cities, 2000-01
This cartogram places cities in their approximate relative geographical positions. The codes for cities are: AB Abu Dubai; AD Adelaide; AK Auckland; AM Amsterdam; AS Athens; AT Atlanta; AN Antwerp; BA Buenos Aires; BB Brisbane; BC Barcelona; BD Budapest; BG Bogota; BJ Beijing; BK Bangkok; BL Berlin; BM Birmingham; BN Bangalore; BR Brussels; BS Boston; BT Beirut; BU Bucharest; BV Bratislava; CA Cairo; CC Calcutta; CG Calgary; CH Chicago; CL Charlotte; CN Chennai; CO Cologne; CP Copenhagen; CR Caracas; CS Casablanca; CT Cape Town; CV Cleveland; DA Dallas; DB Dublin; DS Dusseldorf; DT Detroit; DU Dubai; DV Denver; FR Frankfurt; GN Geneva; GZ Guangzhou; HB Hamburg; HC Ho Chi Minh City; HK Hong Kong; HL Helsinki; HM Hamilton(Bermuda); HS Houston; IN Indianapolis; IS Istanbul; JB Johannesburg; JD Jeddah; JK Jakarta; KC Kansas City; KL Kuala Lumpur; KR Karachi; KU Kuwait; KV Kiev; LA Los Angeles; LB Lisbon; LG Lagos; LM Lima; LN London; LX Luxembourg; LY Lyons; MB Mumbai; MC Manchester; MD Madrid; ME Melbourne; MI Miami; ML Milan; MM Manama; MN Manila; MP Minneapolis; MS Moscow; MT Montreal; MU Munich; MV Montevideo; MX Mexico City; NC Nicosia; ND New Delhi; NR Nairobi; NS Nassau; NY New York; OS Oslo; PA Paris; PB Pittsburgh; PD Portland; PE Perth; PH Philadelphia; PL Port Louis; PN Panama City; PR Prague; QU Quito; RJ Rio de Janeiro; RM Rome; RT Rotterdam; RY Riyadh; SA Santiago; SD San Diego; SE Seattle; SF San Francisco; SG Singapore; SH Shanghai; SK Stockholm; SL St Louis; SO Sofia; SP Sao Paulo; ST Stuttgart; SU Seoul; SY Sydney; TA Tel Aviv; TP Taipei; TR Toronto; TK Tokyo; VI Vienna; VN Vancouver; WC Washington DC; WL Wellington; WS Warsaw; ZG Zagreb; ZU Zurich Appendix A: The "GaWC 100"
Edited and posted on the web on 5th March 2002; last update 26th November 2002 Note: This Research Bulletin has been published in Urban Geography, 24 (5), (2003), 431-441 |
||||||||||||||||||||||||||||||||||||||||||||||||||||||||||||||||||||||||||||||||||||||||||||||||||||||||||||||||||||||||||||||||||||||||||||||||||||