GaWC Research Bulletin 61 |
|
|
|
This Research Bulletin has been published in Stadt und Region: Dynamik von Lebenswelten, Tagungsbericht und wissenschaftliche Abhandlungen, 53. Deutscher Geographentag Leipzig, 29. September bis 5. Oktober 2001. Edited by A Mayr, M Meurer and J Vogt. Leipzig: Deutsche Gesellschaft für Geographie, 2002, 68-76.
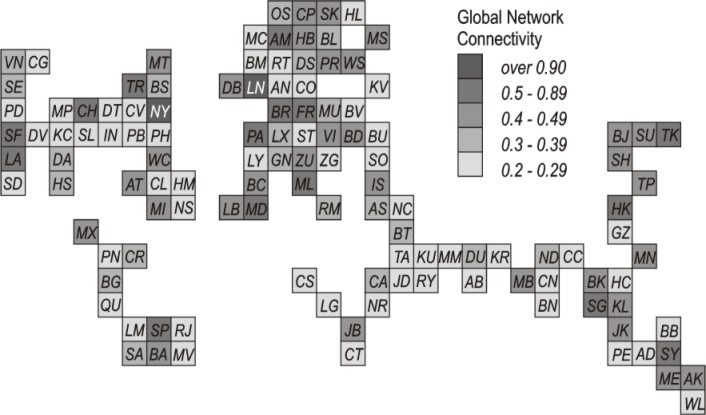
INTRODUCTION: GLOBAL URBAN STUDIESThe paper summarises the initial results of a project to describe the configuration of the world city network. This research is a culmination of work by the Globalization and World Cities (GaWC) Study Group and Network at Loughborough University that focuses upon inter-city relations. This has been a neglected theme in both urban and globalization studies for two prime reasons. First, there has been a severe data deficit: there is little or no published information of any type on relations between cities. Second, there has been a conceptual deficit: studies of contemporary globalization have neglected urban spatial theory and, in any case, contemporary urban theory has largely eschewed its inter-city models. This research project is the first sustained attempt to overcome both of these debilitating problems and initiate rigorous global urban studies. Early work at GaWC focussed upon filling the data lacuna within world city research. However, it was soon realised that putting this research onto a sound empirical basis was not enough. The question of how world cities related to each other had to be confronted. Was there a 'global urban hierarchy' that simply had the form of a 'national urban hierarchy' writ large? The early empirical evidence did not support such an assumption. Instead a new conceptualisation has been developed that specifies a 'world city network'. Only with such a specification can data collection be focussed to provide a meaningful description of the configuration of inter-city relations under conditions of contemporary globalization. This description provides an empirical grounding for understanding many contemporary issues: for instance, the configuration of inter-city relations can be used to inform new trends in global geopolitics or it can underline different processes of regionalization under conditions of contemporary globalization. Further, the emerging or/and the consolidating of distinct cities in specific business fields within specialised regions can offer a different way to locate and interpret peripheral and core economic areas. Thus, this project while being very specific in its focus, has the potential to begin the broader task of unravelling many of the intricate and inter-related processes of contemporary globalization. Specification and data are described in the first section below. Armed with these new research tools we can begin the task of measuring cities within the world city network and delineating their multiple roles in producing and reproducing the network. In the second section, we present measures of the network connectivity of cities which allows completely new comparisons to be made of inter-city relations. Section three introduces analyses of the data outlining complementary investigations that delineate the basic structures of the world city network. In a short concluding section, we indicate some more general implications of this research. THE WORLD CITY NETWORKOne of the key characteristics of contemporary world/global cities is the production of advanced producer services. Therefore, for the study of inter-city relations we consider these cities to be 'global service centres' for the provision of financial and other business needs. It follows that the key agents in the creation of a world city network are the service firms that provide these financial and business services across the world. This means that the network can be specified as an interlocking network consisting of three layers: the network level which is the world economy, the nodal level of the cities, and the sub-nodal level consisting of the service firms. It is an interlocking network because the firms, through their striving to provide a 'seamless service' for corporate clients, have created global distributions of offices across cities. It is these intra-firm connections between offices - flows of information, knowledge, instruction, ideas, personnel - that provide the linkages which underpin the network: cities are 'interlocked' one to another through the global strategies of advanced producer service firms (Taylor 2001). The data requirements of this specification are straightforward. Information is required on the office networks of leading financial and business service firms. We focus upon 'global service firms' which we define as those with offices in at least 15 different cities and with at least one office in the three prime globalization arenas of northern America, western Europe, and Pacific Asia. Data has been collected for 100 such firms, the "GaWC 100", in accountancy (18), advertising (15), banking/finance (23), insurance (11), law (16), and management consultancy (17). For each firm, information on their offices has been gathered across 316 cities worldwide. For each firm, the importance of a city to its office network has been graded from 0, indicating no presence, to 5 indicating the city or cities most important to that firm (usually the site of the headquarters of the firm). We term these scores the 'service values' of cities to firms. The end result of this data collection is a large matrix of 31,600 service values for 100 firms across 316 cities (Taylor et al. 2001a). GLOBAL NETWORK CONNECTIVITYIn a network the most important measure of a node is its connectivity. The degree to which each city is 'interlocked' into the network we call 'global network connectivity'. This is computed as the aggregate, for all 100 firms, of the sum of the products of a city's service value for a given firm with the service values of each other city for that firm (Taylor et al. 2001a). This sum of all product sums for firms in a city defines the network connectivity of that city (see Figure 1). Cities housing the offices of many firms, and particularly where those firms have high service values, will record large measures of network connectivity. In our data London has the highest level of connectivity closely followed by New York. This measure can be disaggregated to consider just one particular service: for example, using just the 23 banking/finance firms identifies international financial centres. We present two sets of results from this measurement exercise. First, the top twenty cities for both global network connectivity (world cities) and banking connectivity (international financial centres) are shown in Table 1. The following features are particularly noteworthy:
There are no real surprises here but these inter-city relations have never before been measured in this conceptually precise and empirically comprehensive way. Second, in Table 2 we show the top five cities in terms of global network connectivity for three countries, USA, Germany and the UK, and for the EU. The contrasts between the three countries are stark. The top US cities are very well connected, German cities much less so, and with British cities showing an extreme 'primate' pattern. As well as having three cities in the top ten (Table 1), the USA has two other cities with much higher rankings than all other cities in Table 2 except for London and Frankfurt. Germany has only middle-ranked cities after Frankfurt and beyond London Britain's world cities are simply puny. An alternative comparison is between the USA and the EU and in this case the latter outranks US cities: at each of the five levels in Table 2 the EU city has a higher world ranking than its US counterpart. Once again, these results in general are not surprising but they are new and original and, we would argue, based upon sound measurement. DATA REDUCTION: PIVOTAL CITY ARTICULATIONS AND WORLD CITY REGIONAL FORMATIONSWithout parsimony, the details of individual firms and cities overwhelm the general picture. The first step in analysing large data sets, therefore, is to carry out some form of data reduction. The technique we use to this end is principal components analysis using a principal axes extraction and varimax rotation. The number of components is decided through careful consideration of the multivariate interpretability in different solutions. In addition we do not use all 316 cities in these analyses because of the sparseness of the matrix with the less important cities. We have drawn a line at one fifth of London's global network connectivity so that only the top 123 cities are included in the analyses. This still produces a 100 x 123 matrix with over 12,000 pieces of information. There are two forms that analysis of such matrices can take. In an R-mode analysis the relations between variables, in this case firms, are explored. Within our data, every column represents a codification of the global strategy of a given firm. Thus R-mode analysis looks for similarities and dissimilarities between the global strategies of firms. In a Q-mode analysis the relations between objects, in this case cities, are explored. Within our data, every row represents a codification of the service mix in a given city. Thus Q-mode analysis looks for similarities and dissimilarities between the service mixes of cities. We use both forms of analysis below and report on the main findings. Clusters of Firms and Pivotal CitiesThere are six distinctive components in our R-mode analysis (Taylor et al. 2001c). Firms with the highest ten loadings on each component are listed in Table 3. It is immediately apparent that the components tend to reflect the different service sectors in these component loadings. Table 3 shows firms with similar geographical biases in their global strategies of office location. The resulting sectoral ordering is not particularly surprising given that each sector has a different history of globalization and different current trends. Our interpretation of these components is as follows:
From a world city perspective the interesting aspect of these results is that the component scores show that each component has just one or two cities that are excessively important in each of these clusters of firms. We refer to them as 'pivotal cities', the small number of places through which the geographies of the sectoral components are especially articulated. The key pivotal cities for each of the above components are as follows:
In summary: the R-mode analysis shows a particular configuration within the world city network with sectoral groups of firms articulating distinct geographical patterns of provision through a few major pivotal cities. Clusters of Cities and World RegionsIn the Q-mode analysis we have identified a structure of five distinctive clusters of cities (Taylor et al. 2001b). In Table 4 the top fifteen cities loading on each component are listed. These show cities with similar mixes of service firms. The components can be interpreted as follows:
One important aspect of these results is the fact that many of the leading world cities hardly feature at all in Table 4. New York, Chicago and Los Angeles are conspicuous by their absence from the list of US cities, and London is missing from both the European and the Commonwealth lists. The Pacific Asian list is different in that their 'big three' (Tokyo, Hong Kong and Singapore) appear but are not ranked high. This is in contrast to the R-mode analysis where leading cities feature as pivotal centres. The key point is that the successful world cities are not typical cities, they have additional and distinctive service mixes and concomitant linkages. Even in the outer cluster, leading peripheral world cities, such as Sao Paulo, Mexico City, Johannesburg and Mumbai, are not listed. In summary: the Q-mode analysis shows that distinctive regional patterns of cities remain even within the service mixes of global firms operating under conditions of contemporary globalization. CONCLUSIONWe finish first, by considering the data and our findings within the concept of a global space of flows and second, by charting some general conclusions. Clearly our data does not directly measure flows between cities. However, it does use indirect measures of flows through its particular focus upon relations between cities and firms through an interlocking network. Firms do not set up networks of offices to offer simple isolated service from city to city. Every firm has a different pattern of movement of information and knowledge between offices, a different pattern of instruction between bureaucratic levels of offices, and a different pattern of transfer of personnel between offices both in training and as senior practitioners. These are all critical flows that make global service provision a contemporary economic practice. Our results are derived from estimates of the importance of offices in cities which relates to each of the above flows between offices and therefore between cities. Hence this is the first project to begin the task of comprehensively studying world city network formation in a space of flows. These measurements and analyses of inter-city relations represent just a first look at the configuration of the world city network. Clearly there are many other ways of analysing these data, here we have presented just the basic structures. Nevertheless important general conclusions concerning globalization are clear. First, interlinkages amongst particular firms mark out specific geographical regions that have historical and socio-cultural characteristics and ties in common. Hence we must begin to think about multiple regionalisations within a globalised process. Second, the research brings into a single global setting many of the key issues in contemporary financial and economic transactions. Beyond the concentration on service firms and cities we can see some of the regional dynamics currently unfolding within globalization: pan-Europeanism with Germany returning to its pivotal role, a distinctive and separate USA, financial integration of the Pacific Rim, and even the strange economic continuity of the 'old' Commonwealth. Such dynamics are essentially an outcome of the linkages above: the world city network constitutes a concrete framework for change in a globalised economy. ACKNOWLEDGEMENTSThe research reported was carried out as part of an ESRC-funded project "World city network formation in a space of flows". David Walker has been integral to the analysis sections of this project. REFERENCESTaylor, P.J. (2001): Specification of the world city network. In: Geographical Analysis 33, 181-194. Taylor, P.J., Catalano, G. and Walker, D.R.F. (2001a): Measurement of the world city network. GaWC Research Bulletin 43. Taylor, P.J., Catalano, G. and Walker, D.R.F. (2001b): Exploratory analysis of the world city network. GaWC Research Bulletin 50. Taylor, P.J., Catalano, G. and Walker, D.R.F. (2001c): Multiple globalizations: regional, hierarchical and sector articulations of global business services through world cities. GaWC Research Bulletin 55.
Table 1: Top 20 cities for global network connectivity and banking network connectivity
Table 2: Top 5 cities for global network connectivity in the USA, Germany, the UK and the EU
Table 3: Top 10 firms in R-mode clusters
Table 4: Top 15 cities in Q-mode clusters
Figure 1: The GaWC archipelago
The codes for cities are: AB Abu Dhabi; AD Adelaide; AK Auckland; AM Amsterdam; AS Athens; AT Atlanta; AN Antwerp; BA Buenos Aires; BB Brisbane; BC Barcelona; BD Budapest; BG Bogota; BJ Beijing; BK Bangkok; BL Berlin; BM Birmingham; BN Bangalore; BR Brussels; BS Boston; BT Beirut; BU Bucharest; BV Bratislava; CA Cairo; CC Calcutta; CG Calgary; CH Chicago; CL Charlotte; CN Chennai; CO Cologne; CP Copenhagen; CR Caracas; CS Casablanca; CT Cape Town; CV Cleveland; DA Dallas; DB Dublin; DS Düsseldorf; DT Detroit; DU Dubai; DV Denver; FR Frankfurt; GN Geneva; GZ Guangzhou; HB Hamburg; HC Ho Chi Minh City; HK Hong Kong; HL Helsinki; HM Hamilton(Bermuda); HS Houston; IN Indianapolis; IS Istanbul; JB Johannesburg; JD Jeddah; JK Jakarta; KC Kansas City; KL Kuala Lumpur; KR Karachi; KU Kuwait; KV Kiev; LA Los Angeles; LB Lisbon; LG Lagos; LM Lima; LN London; LX Luxembourg; LY Lyons; MB Mumbai; MC Manchester; MD Madrid; ME Melbourne; MI Miami; ML Milan; MM Manama; MN Manila; MP Minneapolis; MS Moscow; MT Montreal; MU Munich; MV Montevideo; MX Mexico City; NC Nicosia; ND New Delhi; NR Nairobi; NS Nassau; NY New York; OS Oslo; PA Paris; PB Pittsburgh; PD Portland; PE Perth; PH Philadelphia; PN Panama City; PR Prague; QU Quito; RJ Rio de Janeiro; RM Rome; RT Rotterdam; RY Riyadh; SA Santiago; SD San Diego; SE Seattle; SF San Francisco; SG Singapore; SH Shanghai; SK Stockholm; SL St Louis; SO Sofia; SP Sao Paulo; ST Stuttgart; SU Seoul; SY Sydney; TA Tel Aviv; TP Taipei; TR Toronto; VI Vienna; VN Vancouver; WC Washington DC; WL Wellington; WS Warsaw; ZG Zagreb; ZU Zurich
Edited and posted on the web on 29th October 2001 Note: This Research Bulletin has been published in Stadt und Region: Dynamik von Lebenswelten, Tagungsbericht und wissenschaftliche Abhandlungen, 53. Deutscher Geographentag Leipzig, 29. September bis 5. Oktober 2001. Edited by A Mayr, M Meurer and J Vogt. Leipzig: Deutsche Gesellschaft für Geographie, 2002, 68-76 |
|||||||||||||||||||||||||||||||||||||||||||||||||||||||||||||||||||||||||||||||||||||||||||||||||||||||||||||||||||||||||||||||||||||||||||||||||||||||||||||||||||||||||||||||||||||||||||||||||||||||||||||||||||||||||||||||||||||||||||||||