GaWC Research Bulletin 53 |
|
|
INTRODUCTIONParallel to the globalisation process stemming from the developments in transportation, information, telecommunication and in the mode of productions a new economical system has emerged. As a result of these developments the world becomes smaller and the developments in distant places affect each other. The management and control of the new system is being done by the network of cities which according to Friedmann;
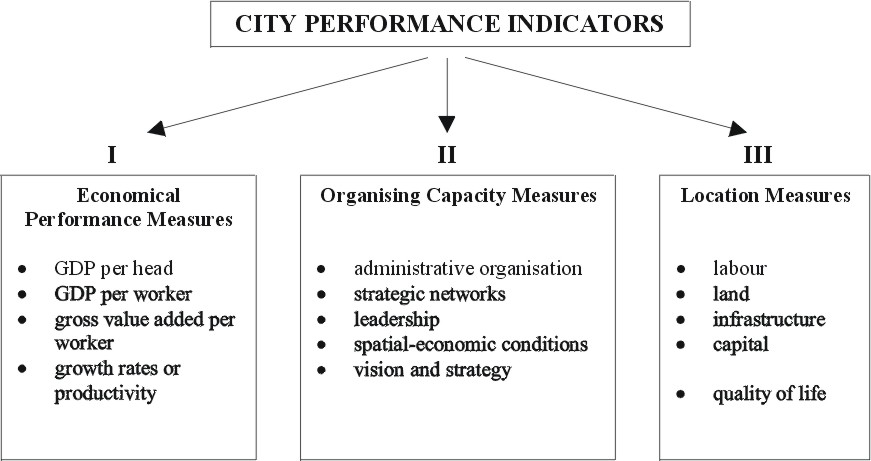
The increasing share of the world's economy by multinational interactions made certain cities to become what termed as "world cities" or "global cities". In other word, through the globalisation, the movement of capital, people and information is continually expanded in geographical space and as result of this it has to enable and produce new spatial infrastructures such as airports, highways, informational networks, ports and institutions through which the capital is to circulate in a faster pace. According to Shachar; ".a world city as a large urban agglomeration specialising in international control capabilities, manifested spatially by three interrelated components: a management and financial centre of a global reach, a very high concentration of advanced producer services and an extremely rich physical and social infrastructure" (Shachar, 1994). Multinational economic aspects of globalisation has led cities to be capable of independent. They are now seeking to identify their advantages, assets and power to compete with other cities. Competitiveness therefore is among the most critical factor against which cities are to identify their global role (Friedmann, 1986; Friedmann, 1993; Sassen, 1994; Shachar, 1994; van den Berg, Braun, van der Meer, 1996; Haila, 1997; Lever, Turok, 1999; Lever, 1999; Begg, 1999; van den Berg, Braun, 1999; Beaverstock, Taylor, Smith, 1999; Rogerson, 1999). GLOBALISATION AND URBAN COMPETITIVENESSMetropoles are the arenas of global interaction. They redefine the conditions and process of local and regional developments. They began to regenerate the infrastructural conditions of the global economy. They are becoming the critical of economic developments for national, regional and local planners and developers world wide. The cities change their traditional role in economical domain to a system of metropolitan centered regional economies overpassing the municipal boundaries. As cities increasingly engage in global market, they find themselves to be competent enough with others in certain areas. That is to say competitiveness is an attribute of cities through which they get advantages against others, and through which they attract investments. There seems to be no clear definition about the competitiveness. In the globalisation context there are various arguments about the concept of competitiveness. It is generally taken as the performance of an economy securing or defending market share. One view takes the competitiveness as dependence on the structure of the economy and on its sectoral specialisation as well as contextual condition such as the character and effectiveness of institutions, the quality and spread of infrastructure and other factors which influence the efficiency of national system as a whole. The others take it as "the ability to sustain change in the factors that give rise to productivity growth (technology, human resources, etc., but also the structure of economy and how policy seeks to shape it." (Begg, 1999). All these approaches show that investment in human and physical capital is important aspect of competitiveness besides the institutional and organisational capacities. This implies that some cities perform better than other in so far as the competitiveness measures are concerned. Are there measures for competitiveness? If so, what they might implies for cities? Before establishing variables to help to clarify competitiveness in metropolitan areas, the following definition is accepted: Urban competitiveness is "the degree to which cities can produce goods and services which meet the test of wider regional, national and international markets, while simultaneously increasing real incomes, improving the quality of life for citizens and promoting development in a manner which is sustainable" (Lever and Turok, 1999). This definition implies that cities, in order to be competitive, have to have attributes such as a skilled and educated labour force, efficient modern infrastructure, a responsive system of local governance, a flexible land and property market, high environmental standards, high quality of life. This is to emphasize that for cities' competitiveness an effective local authority and efficient institutional governance are of importance. And yet, competitiveness requires better organisational performance. Competitive performance of a city can be measured by economical, organising capacity and locational measures (Figure 1). The figure indicate the main axes against which cities' competitive capacity can be ranked, as prime, major and minor, in certain aspects. Those cities that perform all the variables of the model may fall into the rank of the prime, while the others may be the major or minor according to the significance of the indicators. The competitiveness of cities reflects their capacity to engage with global capital, to perform an effective organisation and to provide spatially attractive amenities. In this paper the second aspect, the organising capacity is taken as major area of study to measure Istanbul's competitiveness for it needs to overcome as to be a world city. The organising capacity is defined as "ability to enlist all actors involved and with their help generate new ideas and implement a policy designed to respond to fundamental developments and create conditions for sustainable development" (van den Berg, Braun, van der Meer, 1996). In the framework of the organising capacity, administrative organisation, strategic networks, leadership, spatial-economic conditions, vision and strategy are the critical variables in the performance of cities. These variables developed in the work of van den Berg et al. (1996) are recapitulated as following: Administrative Organization; indicates the institutional framework and the role of actors involved in decision-making process. In this framework "co-operativeness" of the metropolitan municipality is the most crucial variable in the effectiveness or in the performance of administration and planning procedure. That is to say public and private actors that are involved in the projects require adequately functioning administration that is mediating the balance between the public interest and private development potentials. Strategic Networks; are gaining importance in the performance of the cities. Since the governance is limited to the process of initiating, influencing and balancing the public and private sectors involved in the cities, in the view of the present day' developments and dynamics, staging patterns of interactions between mutually related interest groups that are evolved around policy and projects is important for the implementation phases. Defining strategies that will put public, semi-public, and private actors with common interest in the same projects is among the necessary conditions for a city's performance. Leadership; on the hand is equally important in cities' performance. This indicate a key figure or organization has the competence to initiate the potentials of new and existing networks, to lead the projects that envolve with various parties. Spatial-Economic Conditions; it is a fact that metropoles are areas of concentration of many human activities. They pose opportunities and threats to the spatial-economic conditions (Sassen, 1994). So, for the success of the metropolitan cities, the organization of the spatial-economical conditions and networks is important problem area. The problems call for the collaborations of parties involved. Specially social and political supports in solving problems are of importance. Vision and Strategy; implies the integrities of all the urban policies put together in a metropolitan development plans. This includes strategies, clearly defined means and actors, implicit objectives. This is a necessity also for the sustainable development plans to prevent inconsistency and obstacles. Planning the metropolitan cities cover combination of factors which have tendency to function independently. It is therefore for a city to control its competitive performance needs to be installed with a network of knowledge and information to be available at every stage of development and to every actors involved. This also help to enhance the leadership and visionary aspects of the city. In next section Istanbul as to be a world city will be evaluated based on the city performance indicators as described on Figure 1. COMPETITIVE POTENTIALS OF ISTANBULIstanbul is one of the largest metropolitan cities of the world. It is a fast growing city with a population of 9.057.747 (S.I.S., 1998). It is estimated that by the year of 2010 the population will reach up to 13.000.000 (Greater Istanbul Municipality, 1995). This indicate that the labour and the economical activities will be dispersed within metropolitan boundary which extends to nearly 100 km. posing threats and opportunities which will be explored later on. The city has a history which streches back over 2600 years. It is a special city which stands upon two continents. The ancient city is located at the southeastern tip of Europe and the Asian part is located at the southwestern tip of the continent are separated by the Bosphorus. The Golden Horn divides the European part into two as the old imperal section known as the historical peninsula on the south bank and the port quarter of Galata on the north bank which in time expands and centered with Taksim business and cultural district. The modern city spreads far into upto Gebze on the Asian side and up to the Silivri on the Thracian plain of European side. The development patterns of city show a linear form on the east and west direction. Ferry and railways that follow coast lines transporting people from suburban areas to centers and to new industrial zones and residential areas are among the reasons that effected its linear development through the years (Karaman, 1998). The geopolitical location of the city is a critical one. Being on the connecting point between two continents of Europe and Asia make the city strategically advantageous in terms of global interactions. Its advantageous and status increasingly developed after the political changes in Eastern Europe. This changes opened opportunity to the city to function as not only as a transition nodes of economical exchanges from Asia to Europe or vice-versa, but also it gained a status toward being a world city due to external and internal dynamics. It is now being called as the capital "Euro-Asia". It serves as political, economical and social capital of this free market region. It is for instance the center of initiation of Black Sea Economical Co-Operation Association which includes Greece, Bulgaria, Romania, Moldavia, Ukraine, Russia, Georgia and Turkey, each has large economical and social relationship with European and Asian countries. The competitive performance of the city differs in economical, in organising capacity and in locational measures. As the largest metropolis of Turkey Istanbul carries most of the population and is to perform cultural, financial, commercial, industrial, tourism and service function simultaneously. As a result of this, major capital accumulation concentrates within the metropolitan areas. Gross Domestic Product (GDP) share of Istanbul is 21.26 percent of Turkey. While Gross Domestic Product Per Capita in Istanbul is 4286 USD, this rate is 2888 USD for Turkey in general (S.I.S., 1996). In the review of the sectoral division of GDP it is significant to note that Istanbul's shares in imputed bank service changes, financial institutions, business and personal services, trade and manufacturing are comparably higher than Turkey's share in general (see Table 1). The rates of imputed bank services with 53.27 %, financial institutions with 41 %, business and personal services with 40.16 % shares show that Istanbul far more higher in Turkey's averages. Its share with 30 % in manufacturing, trade and hotels, restaurants services also show the weight of Istanbul in Turkey. The distribution of GDP in sectors of industry with 30 % and in trade with 30 % making up 60 % total generated in Istanbul metropolitan area. The transportation, communication and imputed bank service sectors follow with 15 %. These figures show the role of Istanbul as effectively functioning metropolitan city. The same performance can be observed in the attraction of foreign direct investments. There began an increasing foreign direct investments in Turkey with the liberalisation policies starting in 1980s. The numbers of firms were 78 in 1980. This number has reached to 1856 in 1990s and to 4950 in 1999. While the ceilings of the foreign investments was limited to 97 million dollars in 1980, this rate has reached to 1 billion dollars between the period of 1989-1998 (Table 2). It is expected that the movements of the foreign investments will be raised up to 7.6 billion dollars. This will stem from positive climate created by the privatisation policies, foreign investments of communications, energy and infrastructures. The rate of the sectoral division of international firms that are actively investing in Turkey are as follows; 56.70 % in manufacturing, 40.80 % in services, 1.48 % in agriculture and 0.3 % in mining. The significant aspect of these rates is that the service sector's percentage increasing steadily between 1980-1999s. That is, it is raised to a rate of 30 % in 1999 from 8.5 % of 1980s. In the same period the manufacturing rate decreased from 91.5 % to 66 % (Table 3). The number of foreign firms activating in Istanbul is 20 %. As of 1990, 30 % of industrial firms and 70 % of service sectors active in Istanbul are of foreign capital (Table 4). As the numbers in population, economical activities, socio-cultural treats reveal that Istanbul is full of potentials to be world city. With this capacities which are locally and internationally significant requires for a metropolis to be competent enough to tackle with opportunities and threats. In other word, it has to have organising capacity to help all economic flows are properly led, in time and space. The following is an attempt to examine Istanbul's organising capacity in terms of indicators summarized in Figure 1. The analyses will be in reference to actual situation as well as to Metropolitan Area Development Plan's Vision. Administrative Organisation: Istanbul is a metropol administrated with system of Greater Municipality under which districts municipalities function according to their limited power. The Greater municipality performs the duty of making, organising and implementing the master plans and of it of the metropolitan areas. The city is highly urbanised and it accomodate 15 percent of the Turkey's population of 63 millions. Because of the agglomeration of local and international economies it produces 26 percent of the gross added values of the Turkish economy. All branches of economic activities are represented in the metropolitan areas or sub-region of Istanbul. The municipality help to organise these socio-economical potentials within the framework and policies described in the master plans proper. The metropolitan municipality favors co-operativeness between public and private sectors to implement the objectives of the development plans. This is clearly stated in the notes of master plans, in the target and in the policy statements. 16 targets and their policies put forwards means and actors which would carry the city's potentials to international relationships. Target 2 for instance states that "making Istanbul a center where governing and decision making mechanisms (all actors involved) gets together within the economic relations, that unifies with the economic structure of the world and regional countries (Middle East, Balkans, Asia and Europe) and that utilizes the regional opportunities" (Greater Istanbul Municipality, 1995). To realize this global economic target 5 policies developed. Number 1 states that "predicting the development of the primary centers of central business district, the investments and planning decision be directed accordingly" (Greater Istanbul Municipality, 1995). Target 3 also give importance to be world city potentials; "ensuring the growth and development of the metropolitan area in coherence with the national and regional progress in social, economic, cultural terms and increasing its influence and achieving the status deserved among the ranks of world metropolitan cities" (Greater Istanbul Municipality, 1995). The 5 item policy to support this target especially focuses on "encouraging the service sector in the whole Istanbul Metropolitan Area while ensuring decentralization of industry both country wide and regionally" (Greater Istanbul Municipality, 1995). Strategic Networks: The Greater Municipality has certain power of staging the interaction between related interest groups that are involved in policy and projects in public and private domains. This capacity is demonstrated only at level of providing location and permission to the development in question as seen in the practices of free trade zones, private universities, olympic village, and the subway all under construction as of today. Leadership: Competence of Istanbul reflects itself in different sector at various capacity. Istanbul Culture and Art Foundation for instance show high level of institutional leadership by organising the International Istanbul Festival for nearly 30 years which enhanced Istanbul competitive capacity in cultural domains. Union of Housing Cooperatives, Chamber of Commerce, Emlak Bank are among the institutions which initiated and implemented projects with various parties. Garden City is one of the new town realized within Istanbul by a consortium network of public and private co-operation. The Emlak Bank as the public part of the project are engaged to work together with 3 private partners including land owner, and two developers. The project was awarded among the best practices prices of HABITAT II, 1996 held in Istanbul. The new suburban developments serving to middle and high income groups may be given as good examples of projects which are realised with a network where the district municipality is public, union of cooperative is semi-public and cooperatives are private parties. Spatial-Economic Conditions: Spatial-economic conditions of Istanbul as metropolitan city are highly competitive in regional, national and international scale. Being an economical bridge connecting to continents of Europe and Asia make its spatial location strategically important as stated in earlier pages in details. According to the roster of world cities developed in the work of Beaverstock et al. (1999) which is based on the construction of an inventory of world cities, Istanbul ranges between 55 world cities. This inventory of world cities based upon their level of advanced producer services and global service centers are identified and graded for accountancy, advertising, banking/finance and law. In other word, the global capacity of cities defined in terms of selected services they provide and evaluated at three levels as prime, major and minor global service centers. In the list of global advertising service centers Istanbul ranges between the major centers (Table 5) which are defined as "remaining cities with top 50 headquarters plus cities in which five, six or seven of the specific firms/groups studied have an important presence in the city". In the list of global banking service centers Istanbul ranges between the minor centers (Table 6) which are defined as "cities with scores of 2 to 4". In the list of global legal service centers Istanbul ranges between the minor centers (Table 7) which are defined as "the rest of the world (ROW), cities with at least two to four US/UK law branches: US/UK, cities housing two or three law firms with foreign branches". On the other hand, some theoretical schemes drawn to show the interdependency hierarchy and priorities between European cities bring the attentions to their spatial-economical axial relationship naming them as Octopus or Bananas (Lever, 1999). According to Golden Banana Axis developed in late 1980s starts with Lisbon covering Madrid, Barcelona, Milano, etc. and ending with Athens. Considering the socio-economical conjonctures of Europe in 1990's that made the Central Asian market attractive put Istanbul's position forward. It therefore has to be liasoned to southeastern tip of the Grey Banana model as a new actor (Figure 2). The master plan of the city give special emphasize on the allocation of all sectors to be distributed spatially meaningfull, economically integral with world economy and ecologically sustainable. In target 4 of the master plan it is aimed the city to be developing "...special strategies towards the improvement of the quality of life, make the necessary special arrangements within the estimated period and structure, guiding the investor bodies for the infrastructure investments towards this target and develop the necessary institutional management and financial proposals to realize the plans" (Greater Istanbul Municipality, 1995). Among the policies to implement this target is the decentralization of the population and functions in the metropolitan areas and sub-regions through the attraction centers on both banks ensuring certain developments in these sub-centers. Maintaining the linear and multi-centered development trends. The strategy of the decentralization has been going on since 1980s. The industries that have scattered in the central parts of the city over the years are being taken away forward to the east and western fringes of the city nearing Corlu-Buyukkaristiran and Cerkezkoy in the west where 80 large size industries have settled along E-5 highway. In the eastern part of the city small size industries have been moving out. Tanning, leather sector have moved to Kurtkoy and larger size sectors mostly metal and chemical industries move out to Gebze and Izmit along the E-5 highway (Karaman, 1998). All these industries are oriented to local and international markets (Figure 3). Vision and Strategy: The decentralization policy, maintaining the linear development of the city's macroform for the sake of preserving the green zones on the north and putting into the value of the unique townscape, historical, natural and cultural identity while developing strategies to play a key role in the world market are to be the basic motives for the vision and strategy of Istanbul (Karaman, Baycan Levent, et al., 2000). Consideration of all these parameters in the generation of master plans and in the implementation of it help to integrate all the urban policies including means and actors. It is not easy to say that this is being done so as far as implementation phase of the plans are concerned. The city and institutional actors are sensitive enough to control the development according to master plan's visions. But, since there are combination of factors that have tendency to function independently that poses threats to the sustainability. The pressures of global capital are sometimes so demanding and so fast in choosing location of investment that contradicts with spatial economical visions. The location of shopping centers may pose threats to green zones on the north, the density of residential developments may contradict with earthquake zones or the location of high rise towers may compete with the unique siluet of the historical districts. The city now is being very careful about the consequences of the developments without clearly defined objectives, means, models and actors. Table 8 summarize the organising capacity of Istanbul in terms of actors' role. CONCLUSIONSIstanbul as a metropolis is performing cultural, financial, commercial, tourism and services functions simultaneously while the demands and pressures of global investments are trying to define its role mainly as service sector. The city in fact alternatively developing transport system relying on sea, public buses, lightrailway, effective private minibus services, shared taxi, subway under construction, a highly developed telecommunication network, two modern airport, sea terminals, modern business districts, alternatively developed housing system realised by public, private investments serving to various income groups, research centers, universities, international trade exhibition centers, all of which act to strengthen to city's global competitiveness. In order to maintain this capacity it has to pay more attention on strategically critical ssues such as:
REFERENCESBeaverstock, J.V., Taylor, P.J., Smith, R.G., (1999) "A roster of world cities", Cities, Vol. 16, No. 6, 445-458. Begg, I., (1999) "Cities and Competitiveness", Urban Studies, Vol. 36, Nos 5-6, 795-809. Friedmann, J., (1986) "The World City Hypothesis", Development and Change, Vol. 17, 69-83. Friedmann, J., (1993) "Where we stand: a decade of world city research", paper prepared for the Conference on "World Cities in a World System" held in Stirling, Virginia, April 1993. Greater Istanbul Municipality, (1995) Istanbul Metropolitan Area Sub-Region Master Plan by 1/50 000 Scale, Greater Istanbul Municipality, Planning and Zoning Control and Construction General Department, City Planning Directorate, Istanbul. Haila, A., (1997) "The neglected builder of global cities", Cities in Transformation-Transformation in Cities: Social and Symbolic Change of Urban Space, Edited by Kalltorp, O., Elander, I., Ericsson, O., Franzen, M., Ashgate Publishing Limited. Karaman, A., (1998) "Planning Istanbul: Changing Identity of a World Metropolis", Lecture text given at Hogeschool voor de Kunsten Utrecht, Workshop '98. Karaman, A., Baycan Levent, T., et al., (2000) "Metropolitan Areas and Urbanization Strategies for Istanbul" in the 8th Five-Year Development Plan: Regional Development, Commission Report prepared for S.P.O., Ankara, Turkey, 141-177. Lever, W.F., (1999) "Competitive Cities in Europe", Urban Studies, Vol. 36, Nos 5-6, 1029-1044. Lever, W.F., Turok, I., (1999) "Competitive Cities: Introduction to the Review", Urban Studies, Vol. 36, Nos 5-6, 791-793. Rogerson, R.J., (1999) "Quality of Life and City Competitiveness", Urban Studies, Vol. 36, Nos 5-6, 969-985. Sassen, S., (1994) Cities in a World Economy, Pine Forge Press. Shachar, A., (1994) "Randstad Holland: A 'World City'?", Urban Studies, Vol. 31, No. 3, 381-400. S.I.S., (1996) Gross Domestic Product by District, 1996, S.I.S., Ankara. S.I.S., (1998) Census of Population, 1997, State Institute of Statistics, Ankara. Van den Berg, L., Braun, E., van der Meer, J., (1996) "Organising and Implementing Major Metropolitan Projects", European Regional Science Association 36th European Congress CD-ROM, ETH Zurich, Switzerland, 26-30 August 1996. Van den Berg, L., Braun, E., (1999) "Urban Competitiveness, Marketing and the Need for Organising Capacity", Urban Studies, Vol. 31, Nos 5-6, 987-999.
NOTE* Aykut Karaman (Mimar Sinan University, Department of Urban and Regional Planning, E-mail: karaman@msu.edu.tr) and Tüzin Baycan Levent (Istanbul Technical University, Department of Urban and Regional Planning, E-mail: baycan@arch.itu.edu.tr). Table 1: GDP by Economic Activity (1996)
Source: State Institute of Statistics (1996)
Table 2: Foreign Direct Investments Inflows to Turkey (1980-2000)
Source: Undersecreteriat of Treasury (2000)
Table 3: Sectoral Breakdown of Authorized Foreign Direct Investments (1980-2000)
Source: Undersecreteriat of Treasury (2000)
Table 4: Sectoral Distribution of Foreign Capital Companies Operating in Istanbul (1980-1998)
Table 5: Global Advertising Service Centers
Source: Beaverstock, Taylor and Smith, 1999. Table 6: Global Banking Service Centers
Source: Beaverstock, Taylor and Smith, 1999.
Table 7: Global Legal Service Centers
Source: Beaverstock, Taylor and Smith, 1999. Table 8: A Summary of Organizing Capacity and Its Actors in Istanbul
Figure 1: City Performance Indicators
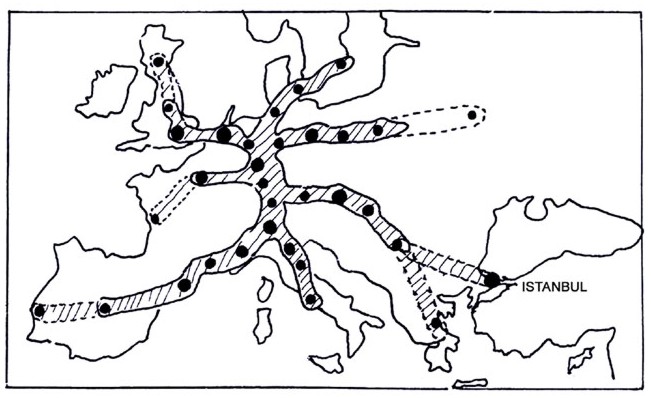
Figure 2: Istanbul's Strategic Location in 'Red Octopus' (adopted and modified from Lever (1999))
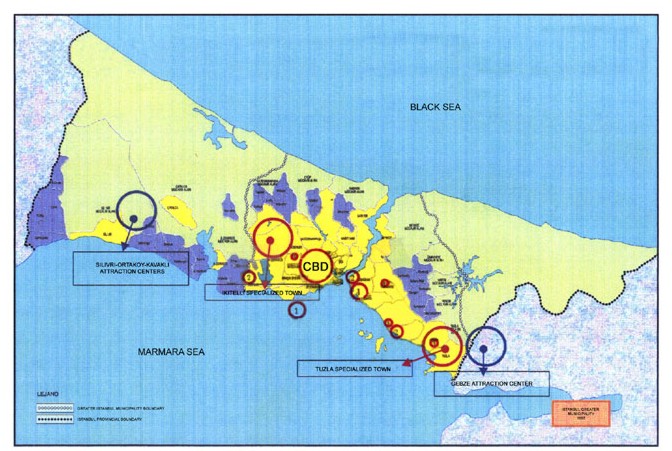
Figure 3: Specialized Cities and Centers of Attractions (adopted and modified from Greater Istanbul Municipality, 1995)
Edited and posted on the web on 30th August 2001 |
|||||||||||||||||||||||||||||||||||||||||||||||||||||||||||||||||||||||||||||||||||||||||||||||||||||||||||||||||||||||||||||||||||||||||||||||||||||||||||||||||||||||||||||||||||||||||||||||||||||||||||||||||||||||||||||||||||||||||||||||||||||||||||||||||||||||||||||||||||||||||||||||||||||||||||||||||||||||||||||||||||||||||||||||||||||||||||||||||||||||||||||||||||||||||||||||||||||||||||||||||||||||||||||||||||||||||||||||||||||||||||||||||||||||||||||||||||||||||||||||||||||||||||||||||||||||||||||||||||||||||||||||||||||||||||||||||||||||||||||||||||||||||||||||||||||||||||||||||||||||||||||||||||||||||||||||||||||||||||||||||||||||||||||||||||||||||||||||||||||||||||||||||||||||||||||||||||||||||||||||||||||||||||||||||||||||||||||||||||||||||||||||||||||||||||||||||||||||||||||||||||||||||||||||||||||||||||||||||||||||||||||||||||||||||||||||||||||||||||||||||||||||||||||||||||||||||||||||||||||||||||||||||||||||||||||||||||||||||||||||||||||||||||||||||||||||||||||||||||||||