GaWC Research Bulletin 458 |
|
|
|
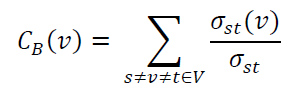
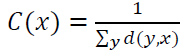
IntroductionThe United Nations (2013) has predicted that 64.1per cent of the developing and 85.9 per cent of the developed world will be urban by 2050. Much of this growth refers to the world’s largest agglomerations, which will contribute a major proportion of global GDP (Dobbs et al., 2011). In seeking to explain agglomeration, many scholars have focused on local urban specialization (for example, Marshall, 1920; Isard, 1956; Krugman, 1991; Glaeser, 2010). Marshall (1920) specified three sources of agglomeration economies: labour pooling, scale economies of intermediate input, and tacit knowledge spillovers. Krugman’s (1991) ‘new economic geography’ proposed that the cumulative accumulation of people, capital and knowledge associated with agglomeration economies lead to circular causation effects, urban specialization and persistent ‘core-periphery’ development. In contrast, Jacobs (1969, 1984) argued that local diversification drives agglomeration externalities, prioritizing heterogeneity versus homogeneity in generating urban knowledge spillovers. In the contemporary ‘network society’ facilitated by IT and technological breakthroughs, urban agglomeration processes combined with ‘city network’ processes generate integrated markets and inter-city flows of labour, knowledge and capital (Castells, 1996; Alderson and Beckfield, 2004; Taylor, 2004). Both Jacobs (1969) and Castells (1996) emphasized agglomeration as a process involving flows between cities at diverse scales. Inter-city investments significantly develop and reproduce capital and labour pools and diffuse technology, knowledge etc. (Anderson, 1990; Barro, 1991). Scott (2001: p. 813) speculated that the inter-city relations of extra-nationally networked ‘global city-regions’, could transform existing uneven core-periphery relations (Friedman, 1986). In the contemporary Chinese context, combining the capital accumulation and the diffusion effects of capital mobility emphasized by new economic geography and Jacobsean economists respectively, Foreign Direct Investment (FDI) in particular, is associated with knowledge-intensive city networks and spillovers (Madariaga and Poncet, 2007; Lin et al., 2009) while Domestic Investment (DI) is seen as the cornerstone supporting market size and attracting foreign capital (Rama, 1993). FDI is characterized by transnational practices, international exchange, complex ownership, long-term intentions, complementary capital, and export incentivization, with international attributes (De Mello, 1999; Kim and Seo, 2003). FDI by multinational corporations (MNCs) especially, contributes to transnational labour supply, trade, and the transfer of capital, high value-adding skills and technologies (Borensztein et al., 1998; Blomstrӧm and Sjöholm, 1999; Liu, 2008) and arguably has positive impacts on domestic firms, upgrading their capital stock (De Mello, 1999). FDI flows contribute to local economic growth specifically, because MNCs connect places to global networks with specialized knowledge and innovation capacity that boost productivity through positive externalities and spillover (Barba and Venables, 2004). The capital flow network across territories can therefore potentially contribute important insights into agglomeration economies and externalities associated with China’s dramatic urbanisation and ‘opening up’ to foreign investment. The analysis presented in this paper addresses a specific research gap in the association between DI and FDI interlinking Chinese cities in network space. FDI has increasing importance for developing countries, whose share of total inward flows surpassed that of developed countries for the first time in 2012, whilst developing countries retained the highest share of earnings at about 40 per cent (UNCTAD, 2013). Krugman (2011) acknowledged that a focus on local agglomeration drivers is ‘less and less applicable to the actual location patterns of advanced economies’ (p. 13) but referred to China’s ongoing high manufacturing, per capita GDP and regional differentiation as ‘a clear cousin to the emergence of the U.S. manufacturing belt in the 19th century’ (2011: p. 15), concluding, ‘it turns out that the concepts and approaches of the new economic geography aren’t backward-looking after all. They’re utterly relevant to understanding developments in the world’s fastest-growing economies’ (2011: p. 16). Yet, significantly, since China’s late 1970s ‘opening up’, major urbanization and economic globalization have encouraged staggering FDI concentration. By 2012, China’s FDI had surpassed that of the USA, reaching 18 per cent of total inward investment (UNCTAD, 2013), making China the world’s biggest host economy. There is no doubt that FDI has contributed significantly to China’s miraculous growth in recent decades. However, most previous studies focus on the crowd-in or crowd-out effect of FDI and DI by investment volume while ignore the flow attributes of investments, which leaves a research gap in illuminating the association between FDI and DI in network lens. In this context, this paper aims to contribute to understanding of the implications of intensifying Chinese connectivity to international investment flows by examining FDI agglomeration and its association with DI. Kimino et al. (2014) pioneered work using the domestic network to explain FDI, however, their domestic network was restricted to interlocking 'Keiretsu'1 enterprises as opposed to direct investment flows across territories, leaving a void in network analysis of the association of DI and FDI. We fill the void by investigating the multi-directional DI network across Chinese cities. Three specific research questions are addressed: First, what are the roles and functions of different Chinese cities in the DI network? Second, beside agglomeration factors, what is the association between DI network measures and urban attractiveness for FDI, and does the geographic distance of DI matter? Third, what are the implications of the results for development policies from network lens in China? Accordingly, the first part of the paper introduces the methodological issues and the approach to the analysis of DI and FDI, in which cities and investments in China are nodes and ties in networks. In the second part, the characteristics of the DI network and its association with FDI are analysed, also investigating whether distance matters. In the third part, econometric models are introduced to identify the significance of DI factors in the attraction of FDI to Chinese cities. Finally, based on the results, the functions and roles of cities in investment networks are considered, and implications for urban development policies are proposed. Explaining the Urban Agglomeration Process Using a City-Network ApproachCurrently, there are two main approaches to explain agglomeration economies - location factor analysis and network analysis. Location factors are perceived as endogenous drivers, such as local market size, labour pool, accessibility, industrial configuration, institutional context, high-tech clusters and cultural atmosphere (Florida, 2002). Turok (2004) conceived the focus of urban development strategy as embedded in the utilization of indigenous strengths. According to urban competitiveness literature, location factors are critical in boosting industrial innovation and upgrading capacity, regarded as core competitiveness factors underlying globalization processes (Porter, 1990). In this context, it is shown that MNCs benchmark cities and nations according to various agglomeration factors, and that the more similar these endowments are in cities, the more cities compete to attract FDI (Wall and van der Knaap, 2011). Furthermore, Boschma (2004) asserted that competition has extended from an organizational to a territorial level, and argued that, like firms, cities compete under conditions of strong economic specialization in similar markets where the impacts of FDI depend on the absorptive capability of cities and regions. Specifically, human capital, financial markets, and technology gaps are critical location factors for attracting and absorbing FDI (Glass and Saggi, 1998; Alfaro et al., 2004; Mahroum et al., 2008). The epidemic of purely urban attribute analysis seeking to explain development has been critiqued (Meijers, 2007). It is argued that markets stem intrinsically from social networks in which ideas, thoughts, innovations and learning are generated and shared (Powell et al., 1996). Jacobs (1984) argued that the interaction and exchange of ideas in city work and trade expand economic activity and transfer dynamism to surrounding regions that draw in labour from rural areas. Therefore, global and globalizing cities in networks are regarded as ‘engines’ of regional development (Scott, 2001; UN-Habitat, 2013: p. v) that should allow countries to move beyond Jacobs’ ‘transactions of decline’ (Pain, 2012: p. 90). Nevertheless, this does not mean that the location and network approaches are mutually exclusive. In fact, they are complementary since networks (exogenous influence) and location factors (endogenous influence) coincide in cities (Wall and Stavropoulos, 2016). Berry (1964) discussed ‘cities as systems within systems of cities’, emphasizing a network perspective that supplements the overwhelming focus of endogenous mechanisms on urban productivity. It is claimed that establishing linkages and collaboration networks can help firms to access external knowledge and boost urban productivity as an outcome (Powell et.al., 1996; Mahroum et al., 2008). Moreover, due to fuzzy production modes, different specializations and the division of labour, functional relations between cities tend to be more complementary than competitive, benefitting from scale economies, knowledge exchange and synergies (Capello, 2000). With globalization, big cities are more interconnected globally by investment flows and have more functional interrelations with other big cities than with neighbouring smaller cities (Meijers, 2007). Therefore, agglomeration and networks are complementary to each other in terms of knowledge diffusion and productivity gains (Johansson and Quigley, 2004). For these reasons, we cannot ignore the links between knowledge diffusion, urban productivity and investment, because investment, especially foreign investment, is an important pipeline in knowledge diffusion and production modes (Branstetter, 2006). Therefore, it is necessary to observe the agglomeration of urban activities in a network way. Accordingly, this paper tests the attractiveness for FDI conferred on Chinese cities by their positions in the established DI network and the policy implications of this. Social network analysis (SNA) is employed to complement the traditional focus on location factors, emphasizing the relations among economic agents and incorporating geographical coordinates to illustrate the pattern of networks and agglomeration (Borgatti and Foster, 2003). Focal Area ChinaChina was central in an East-Asian merchant-led trading system based on overlapping city networks that existed prior to the 16th century and continued until 1840 (Abu-Lughod, 1991). Accompanying accelerating urbanization and integration in global markets, China has become both the second biggest economy and the biggest FDI host country in the world, making it an important case for research into contemporary FDI agglomeration. Major flows of FDI into China are equipped with knowledge and production modes that can be transferred to indigenous firms (Liu, 2008; Lin et al., 2009). The potential for FDI to add value to manufacturing production in China seems substantial (Dahlman and Aubert, 2001). Ouyang and Fu (2012) noted the inter-regional spillover of FDI from highly urbanized coastal areas of China to inland areas. However, systematic analysis is still required to assess not only urban attractiveness for FDI associated with urban indigenous factors, but also the functions and roles of different cities in DI network, and the relevance of distance. Data and MethodologyThe aim of the analysis is to investigate whether FDI into Chinese cities is affected by the network centralities of the same cities within the established DI network, controlling for agglomeration factors. In other words, besides agglomeration factors, are DI network measures associated with attracting FDI? FDI data are sourced from the Financial Times fDi Markets database, concerning ‘greenfield’ investments in which parent companies start up entirely new ventures in foreign countries by developing new operational facilities from the ground up. The reason for focusing on greenfield FDI, is that these projects can be considered a strong indicator of a city’s attractiveness to foreign investors. Firstly, greenfield projects have high company profile requirements, and are normally carried out by influential MNCs. Secondly, when MNCs start up new operational branches, they explore domestic markets, which demands domestic capital connectivity. Thirdly, greenfield projects directly facilitate the growth of capital formation, local productivity and employment. Lastly, in contrast to international financial investments, such as mergers and acquisitions (M&A), greenfield projects tend to transfer core technology and production processes. Regarding data availability, DI data are only available for the year 2012. Since the analysis investigates the simultaneous association and subsequent relations between the established DI network and urban attractiveness for FDI, 2743 FDI projects in the period 2012 to 2014 are used to express the FDI attractiveness of Chinese cities. Thus, the relations between the established DI network in 2012 and FDI between 2012 and 2014 were examined. The research is interested not only in capital formation but also in positive externalities, such as technology, management modes, information and learning processes more generally. Therefore, the analysis focuses on the more reliable investment counts to shed direct light on FDI attractiveness. The DI data are sourced from the Orbis Database (Bureau van Dijk, 2012) concerning shareholder data, which is used as a proxy for DI. Unlike FDI greenfield projects, the DI data cover several investment categories, including M&A, financial investments via agencies and personal investment etc., which are together regarded as contributors to the establishment of a DI network. The total number of projects is greater, thus, 9315 DI projects in 2012 are recorded. The FDI and DI data are geographically coordinated to identify both investment source city nodes and destination city nodes and the physical distances between them, organized into respective 1-mode matrices used for network analysis. The control variables (GDP, land area and population) are derived from the National Bureau of Statistics of China. By cross-matching cities represented in all three databases, 77 Chinese cities remained to make a complete dataset. After multicollinearity testing, several network centrality and structural measures are incorporated in the analysis. Network nodal centrality is divided into Indegree centrality and Outdegree centrality. Weighted Indegree concerns the total number of investments that a city receives to indicate cities’ centripetal forces from source cities and ‘prestige’, or attractiveness. The FDI Weighted Indegree serves as the dependent variable. DI Weighted Indegree serves as one of the independent indicators. The DI Weighted Outdegree is a measure of the total number of outward DI projects of cities and an indicator of source cities’ centrifugal forces to expand their controlling function in the DI network. It is a measure of the ‘power’ of cities to invest in other cities and to extend their connections intuitively in the DI network (Alderson and Beckfield, 2004). It is hypothesized that the more prestigious or powerful a city is in the DI network, the more FDI projects it will attract. DI Indegree and Outdegree are unweighted measures estimating the number of cities that invest in a particular city on the one hand, and particular cities invested in on the other hand. These measures are representative of a city’s relative degree of ‘integration’ within the DI network. It is hypothesized that the more a city is inwardly or outwardly connected in the DI network, the more FDI projects it will attract. In addition to the above nodal measures, Betweenness is used to investigate cities’ structural positions within the DI network. The Betweenness measure is an advanced network indicator, which measures how often a node (city) appears on the shortest paths between other nodes in the network. It represents a ‘broker’ or ‘gateway’ function of a node in the network. It is hypothesized that the more ‘bridged’ a city is to other cities (and thereby strategically positioned in the network), the more it will be able to attract FDI. More formally, in equation (1), where Closeness, another structural measure, represents the sum of the geodesic functional distances to other nodes, i.e., the reciprocal of the sum of node’s functional distances from all other nodes. It serves as a gauge for how closely related nodes are in a network, or how tightly linked they are within the network, and it is therefore an indicator of functional ‘clustering’. Distinct from geographical clustering, the Closeness measure thereby emphasizes the nodal relations’ distance via virtual investment linkages. It is hypothesized that the more that cities are interlinked with each other in close network clusters, the more they will be able to attract FDI. More formally, in equation (2),
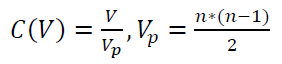
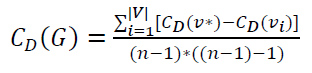
Where d(y,x) is the shortest functional distance between vertex x and all other vertices y. In addition, the overall structure characteristics of the DI network are estimated using density and degree-centralization. Density C(V) is the total number of ties V divided by the total number of possible ties Vp as formulated in equation (3). Degree centralization CD(G) represents the degree of inequality in the network G as a percentage of that of a perfect star network2 H of the same size, as formulated in equation (4).
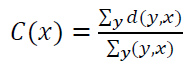
Where n is the number of vertices, CD(v *) is the highest degree that node v * possesses. Lastly, in addition to investigating the association between DI network positions and attractiveness for FDI, physical geographical influence is considered. We hypothesize that an increase in the geographic distance of a DI node’s connections, will negatively influence its network performance and attractiveness for FDI. To test this, based on the geo-coordinates of cities in the DI network, the mean distance of all investments between a city and the other cities it is connected to is then taken as the observable variable. DI Indegree Distance is the mean distance of destination cities with their source cities, while DI Outdegree Distance is the mean distance of source cities with their destination cities. It is a measure of the geographical proximity of a city to all other cities within the DI network, whereby, it is hypothesized that the physical proximity of functional linkages will have a positive relation with the attractiveness for FDI. The average distance of node x, C(x), is the quotient of the sum of the distance ∑yd(y,x) by the sum of linkage count ∑y(y,x), formulated in equation (5) as,
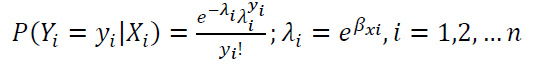
For the regression models, a distinction is made between types of network measures in terms of linkage and nodal types. These measures are conceptually different and they are therefore treated separately in the analysis. Firstly, Betweenness and Closeness are derived from the linkage structure of the network. They are derived from a dichotomized matrix of binary values (indicating the presence or non-presence of a linkage) and do not possess any directionality. Secondly, the nodal values concern weighted and directional measures of the vertices. Because the directionality concerns either inward flows or outward flows, these flows are treated separately. Lastly, land area, population and GDP index are included to control for agglomeration effects. Land area and population are used to control for physical and demographic size respectively. The GDP Index is used as a proxy to control for market size. Given the choice of models, since the available data is incomplete in terms of monetary value, but complete in terms of number of investments, the dependent variable chosen is count FDI. As the classic count model, the Poisson regression model (PRM) estimates the number of investment linkages between source city i and destination city j and has a Poisson distribution with the conditional mean that is a function of several independent variables. The FDI number of the city i is assumed to have a nonnegative integer value, the exponential of the independent variables is taken, which must be zero or positive. More formally in equation (6),
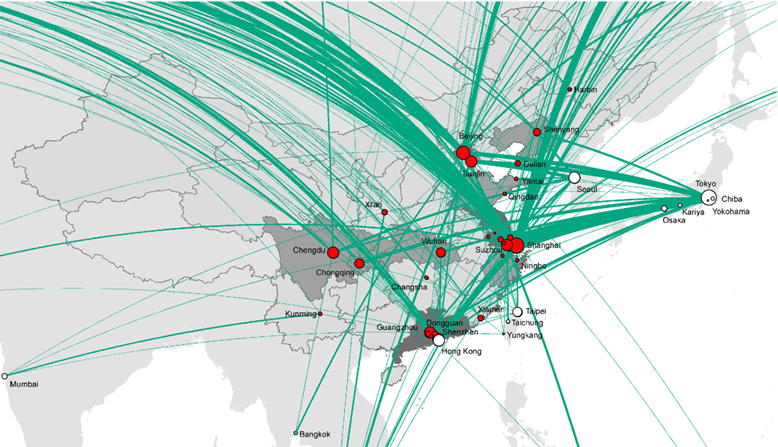
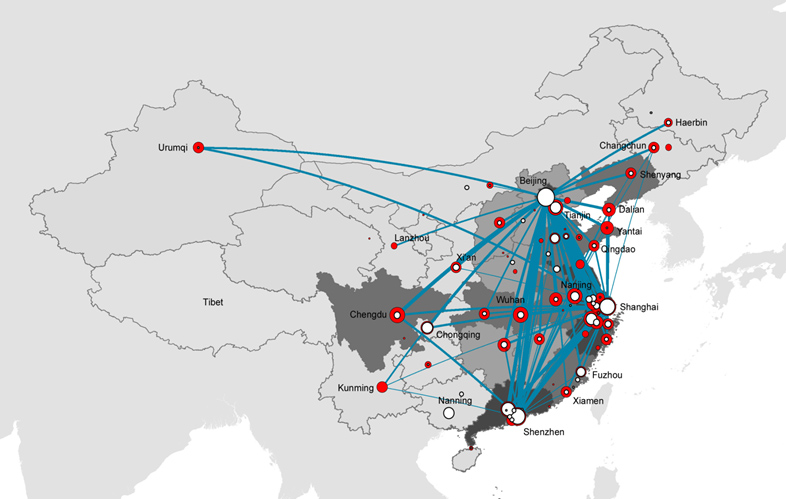
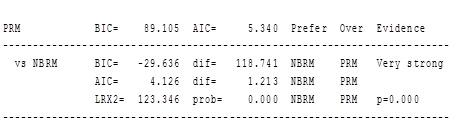
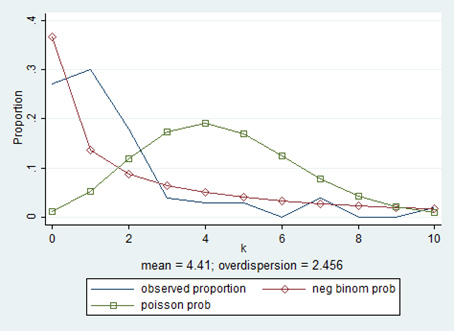
Parameter ƛi depends on a vector of covariates Xi, which indicates the factors that possibly attract FDI. In this analysis, these covariates concern the DI network measures. The β is the regression coefficient of each Xi. An important assumption of the PRM is that it assumes the equi-dispersion (the conditional variance should be equal to the conditional mean). Often, this condition is not satisfied and the dependent variable is over-dispersed. In order to correct for over-dispersion, the model is adapted to the negative binomial regression model (NBRM). The NBRM allows the variance of dependent variable greater than mean value and captures the degree of over-dispersion (see Erdman et al. 2008, for adaption details). Therefore, we employ the NBRM to unveil the association of DI network characteristics with the urban attractiveness for FDI. In addition, post-tests identified the better fitness of NBRM over PRM. The countfit test shows that the NBRM is preferred over the PRM (Appendix Figure 3). Furthermore, the graphical representation shows both the Poisson distribution and the negative binomial distribution based on the mean (4.41) and dispersion of the count data (2.456), and found the negative binomial distribution is more fitted to the actual number of investments received in these cities (Appendix Figure 4). ResultsFirst, the characteristics of the geographical distribution of FDI and DI are illustrated. Given FDI, as shown in Figure 1, most top destination cities are located along the coastline, agglomerating at the Bohai Economic Rim (BER), the Yangtze River Delta (YRD) and the Pearl River Delta (PRD). On the other hand, some cities in the western and central areas are becoming prominent such as Chengdu, Chongqing, Wuhan, Xi’an and Changsha, but not in a physically contiguous form as is the case for the three coastal regions. In contrast to FDI, as shown in Figure 2, although coastal areas are still the hotspots for DI, the geographical pattern of the DI network is stretched in a dispersed formation to the centre and the west, indicating more prominent cities in DI network from the centre and the west. Meanwhile, by comparison between inward and outward investments, it is manifest that most cities play ‘sinker’3 roles in the DI network. In addition, it is noticeable that the four top cities (Beijing, Shanghai, Shenzhen, and Guangzhou) have an overwhelming capacity in outward investment and play ‘outsider’4 roles in the DI network, while other cities depend heavily on inward investment. In conclusion, the general geographical pattern of FDI and DI is still characterized by regional core-periphery disparity from the coastline to the inland area. However, significantly, Sichuan and Chongqing in the west and the Mid-Yangtze River (MYR) region in the centre are catching up to relieve the disparity between China’s core and periphery regions. Figure 1 FDI distribution in China
Note: red nodes represent destination cities, white nodes represent source cities, size of nodes represents the volume of FDI, and linkages represent the trajectory of FDI. Figure 2 DI distribution in China
Note: red nodes represent destination cities, white nodes represent source cities, size of nodes represents the volume of DI, and linkages represent the trajectory of DI. Given the overall pattern, the DI network is a centralized network where power is concentrated in core cities and interactions between peripheral cities are sparse, reflecting the low density and high degree of centralization shown in Table 1. In order to clarify cities’ positions, selected network measures are calculated and shown in Table 1. Given its attractiveness for FDI, Shanghai is the dominant city, followed by Beijing and 22 of the top 30 FDI destinations are located along the coastline. Surprisingly, Tianjin, as an industrial port and a less economically developed city than the top four, obtained the third position and Shenzhen dropped to the 7th place. These second tier cities with more than 90 projects (from Tianjin to Shenzhen), are distinctive from first tier cities, Shanghai and Beijing, yet they significantly outperform the rest. Given the DI network Weighted Indegree and Weighted Outdegree, it is found that the gap between China’s core cities and other cities is much bigger in Outdegree. Specifically, Hangzhou has surpassed Guangzhou to become the fourth most attractive DI destination, but has dropped behind in outward DI. Given Indegree and Outdegree, in addition to Beijing, Shanghai, Shenzhen and Guangzhou, more major cities such as Tianjin, Chongqing, Hangzhou and Nanjing are shown to be building outward relations, indicating that these cities tend to diversify their outward partner profile even though they have a smaller number of outward projects. Surprisingly, Nanning, the medium-sized capital city of the less developed Guangxi province, is a city with a strong outward orientation in comparison to similar cities, and is ranked in the top 10 for both Weighted Outdegree and Outdegree but not ranked in the top 30 for either Weighted Indegree or Indegree. With respect to the structural positions expressed by Betweenness and Closeness, Beijing and Shanghai dominate the network as bridging5 cities and are the most functionally clustered cities in the DI network, followed by Shenzhen and Guangzhou. Surprisingly, Jinan and Haikou, which are the medium-sized capital cities of Shandong province and Hainan province respectively, and which rank relatively low in all degree-related estimators, are ranked in the top 10 bridging cities, which may indicate that they hold gateway roles in connecting their regional markets to the national market. Given Closeness, by contrast with the top four cities and other major cities, Nanning has become the most clustered medium-sized city in China regardless of its disadvantageous location and less developed economy. Lastly, the distant cities are geographically located in the west and northeast. However, amongst distant cities, Chengdu is an outperformer in terms of other measures. In conclusion, the structure of the DI network is characterized by centralization processes. Regarding the four top cities, holding the second position in attracting FDI, Beijing holds the most powerful position in the DI network, followed by Shanghai and Shenzhen. Nevertheless, Guangzhou, which is regarded as one of China’s four top cities, has relatively weak performance in attracting investment and bridging function when compared to the other three. Despite a major disparity between these four top cities and others, some major cities are catching up in circulating investment flows and capturing advantageous structural (prestige, controlling, bridging, clustering and physically proximate) positions, such as Tianjin, Hangzhou, Chongqing, Chengdu, Nanjing and Wuhan. Amongst medium-size cities, Nanning is an outlier, that nonetheless ‘punches above its weight’ in outward investment and clustering which give it an unexpected strategic network position. On the contrary, Suzhou, which has high prestige in attracting both FDI and DI, nonetheless fails to capture other structural positions in the network, such as the controlling position and the bridging position. Table 1 Top 30 cities in FDI and DI centrality
Furthermore, as shown in Table 2, three models are specified, the first two based on either inward or outward nodal measures, and the latter based solely on linkage structure measures. In Model 1, Indegree is identified as a highly significant variable that contributes to attracting FDI, while Weighted Indegree is insignificant. Interestingly, the former is a measure of the number of cities that a city is connected to (i.e. integration), and holds significance over the latter, which is a measure of tie-strength. Similarly, in Model 2, only Outdegree is identified as significant. It is revealed therefore that diversifying the partner profile is more strategically important than accumulating investments in fixed partner cities for the sake of attracting FDI. In addition, Indegree Distance has a significant negative association with the urban attractiveness for FDI, which means that potential recipient cities that are further from their DI origin cities are less capable of attracting foreign investment. Therefore, intertwined with the spatial clustering of FDI and DI distribution (as shown in Figures 1 and 2), the cities clustering in the YRD and PRD can generate advantageous conditions in attracting FDI, while the cities located in the northeast and west have less advantageous conditions. Nevertheless, in model 2, Outdegree Distance is not identified as being significant, which may indicate that outward DI is an advanced investment form lacking spatial constraints. In Model 3, Closeness is highly significant in attracting FDI. Because the measure concerns the functional clustering of nodes to each other, it indicates that the more a city is functionally close to all other cities in the DI network, the more it is able to attract FDI. In addition, Betweenness is also highly significant in attracting FDI positively, which indicates the benefit of a broker position, indicating that developing a city’s strategic gateway function will improve cities’ competitiveness in attracting FDI. Table 2 NBRM results
Robust standard errors in parentheses; *** p<0.01, ** p<0.05, * p<0.1. Lastly, given the control variables, GDP is identified as being positively significant in all three models, indicating the importance of local market size in attracting FDI. In addition, it is evident across all three models that urban land size is negatively associated with FDI attraction, suggesting that land capture is meaningless in attracting FDI. This finding resonates with the fact that the cities in the west and northwest generally have a larger land area compared to the cities clustering in the YRD, PRD and BER. In conclusion, the established DI network proves significant in attracting FDI. Specifically, capturing bridging positions, engaging in regional clustering, and diversifying linkage profile in the DI network, are likely to enhance the attractiveness of cities to foreign investors. DiscussionThis paper sets out to fill a gap in the investigation of the association of DI and FDI using a network approach. Here we return to the three specific research questions initially posed. First, what are the roles and functions of different Chinese cities in the DI network? The network analysis shows that the distribution of FDI and DI is associated with the pattern of agglomeration and economic gravity that is mainly located along the Chinese coastline and the Yangtze River. Four cities, Beijing, Shanghai, Shenzhen and Guangzhou, dominate the core in inter-city network relations, while other cities have relatively sparse linkages, indicating centralization (Sassen, 1991) and hierarchical tendencies (Friedmann, 1986). These four agglomerations have command and control functions in circulating FDI as well as DI flows that suggest their global city-region status (Scott, 2001). Nevertheless, the Chinese DI network is not saturated. New linkages and significant network positions might be established, suggesting that there may be opportunities for more cities to upgrade their network performance. For example, Nanning currently lacks network prestige due to its relatively undeveloped economy and small market relative to other cities of similar size, however, both its extending outward linkage profile and its clustering performance may contribute to improving the urban attractiveness for FDI. Furthermore, Nanning’s extending outward linkages could help less developed cities to capture advantageous positions within an established network. The analysis therefore indicates that Chinese cities play different but complementary DI network roles that underpin diverse linkages between cities and increase their attractiveness for FDI. Second, besides agglomeration factors, what is the association between DI network measures and urban attractiveness for FDI, and does the geographic distance of DI matter? The network analysis found several significant DI variables associated with urban attractiveness for FDI, especially Betweenness, Closeness and Degree measures. Therefore, the first hypothesis that the more prestigious or powerful a city is in the DI network, the more FDI projects it will attract, is rejected since the strength of inward and outward investment (investment volume), is not identified as significant in the model. However, the second hypothesis, that the more a city is inwardly or outwardly connected in the DI network (integration), the more FDI projects it will attract, is supported. In addition, the third and fourth hypotheses, that the more ‘bridged’ a city is to other cities and the more that cities are interlinked with each other in close network clusters, the more they will be able to attract FDI, are verified, indicating the importance of cities’ broker roles and regional clustering. Although the four top cities dominate in bridging and clustering functions, there is scope for other cities to build broker roles in their regional markets by developing stronger links to core cities with a bridging role. This finding has particular relevance for major cities such as Hangzhou, Tianjin, Chengdu, Wuhan, Chongqing and Nanjing, for domestic and foreign economic agents with ambitions to become more connected to the core Chinese cities, Shanghai, Beijing, etc., and for policy makers seeking to address China’s uneven space-economy structure. Functional clustering reinforces the position of cities in a regional market, and the development of network bridging roles is important in this because it assists city integration in foreign investment networks and the development of global production functions. The results from network analysis therefore lend support for Jacobs’ (1984) thesis that interaction between cities supports economic expansion that benefits all cities and underpins linked urban growth. Resonating with Scott’s (2001: p. 813) global city-region thesis also, the results illustrate how the emergence of synergistic inter-city network relations could potentially begin to reduce uneven regional development in China. Further research is required to explore how intercity network linkages could be further strengthened by considering nuanced DI strategies, for example, relating to industrial classification differentiation, company characteristics, project objectives etc. In relation to the fifth hypothesis that the physical proximity of functional linkages will have a positive association with urban attractiveness for FDI, our analysis finds that geographical distance is not irrelevant for FDI attractiveness. There is no doubt that the relevance of physical distance is declining as a constraint for trans-local economic activities, however, the influence of physical proximity is limited to inward distance, suggesting the importance of geographical closeness to origin domestic cities in attracting FDI. Combined with identified functional Closeness, we can therefore speculate that the cities which are functionally clustered in the geographical centre of China, such as Zhengzhou, Wuhan, Changsha and Hefei, have significant opportunities to upgrade their performance in the DI network and attract more FDI projects. For cities that are peripheral to the core system, their geographic disadvantage can be tackled by strongly improving physical connectivity (road, rail and air), as well as attracting inward investment connectivity (Indegree), from cities that are regionally well embedded (Closeness). Third, what are the implications for development policies from network lens in China? The DI network pattern of cities is a potentially powerful economic resource, which could be exploited by forward strategic economic and spatial planning. City DI-FDI interactions are already a major contributor to the country’s contemporary economic growth, however, both forms of investment require appropriate regulatory and planning responses to ensure an appropriate balance between them. Policies stimulating trans-local ties between cities are likely to be advantageous in attracting inward investment by foreign firms. Policy for cities with established DI network positions should therefore exploit this advantage in strategies to support sustainable economic growth. Meanwhile, plans for cities in less advantageous network positions, should be aware of the opportunities to develop efficient network interlinkages, for example through the promotion of active city links to broker cities, as opposed to the pursuit of competitive inter-city relations. Attracting investment for economic expansion is contingent on inter-city public-private actor relations, therefore actor network relationship building demands further qualitative research. Finally, the results illustrate that city network analysis offers an important complementary analytical methodology to the new economic geography approach by highlighting the complexity of contemporary location drivers in the fast-changing Chinese economic context. The new economic geography ‘kind of steampunk feel’ discussed by Krugman (2011: p. 13) in relation to the world’s advanced economies, may therefore become increasingly applicable in the Chinese case. REFERENCESAbu-Lughod, J. L. (1991) Before European Hegemony: The World System AD 1250–1350. Oxford University Press, Oxford. Alderson, A.S. and Beckfield, J., 2004. Power and position in the world city system. American Journal of sociology, 109(4), pp.811-851. Alfaro L., Chanda, A., Kalemli-Ozcan, S. and Sayek, S. (2004) FDI and economic growth: the role of local financial markets, Journal of International Economics 64(1), 89–112. Anderson, D. (1990). Investment and economic growth, World Development 18(8) 1057–1079. Barba, G. and Venables, A. J. (2004) Multinational Firms in the World Economy. Princeton University Press, Princeton, NJ. Barro, R. J. (1991) Economic growth in a cross section of countries, Quarterly Journal of Economics 106(2), 407–443. Berry, B. J. (1964) Cities as systems within systems of cities, Papers in Regional Science 13(1), 147–163. Blomström, M. and Sjöholm, F. (1999) Technology transfer and spillovers: does local participation with multinationals matter? European Economic Review 43(4), 915–923. Borensztein, E., De Gregorio, J. and Lee, J. W. (1998) How does foreign direct investment affect economic growth? Journal of international Economics 45(1), 115–135. Borgatti, S. P. and Foster, P. C. (2003) The network paradigm in organizational research: A review and typology, Journal of Management 29(6), 991–1013. Boschma, R. (2004) Competitiveness of regions from an evolutionary perspective, Regional Studies 38(9), 1001–1014. Branstetter, L. (2006) Is foreign direct investment a channel of knowledge spillovers? Evidence from Japan’s FDI in the United States, Journal of International Economics 68(2), 325–344. Capello, R. (2000) The city network paradigm: measuring urban network externalities, Urban Studies 37(11), 1925–1945. Castells, M. (1996) The Rise of the Network Society: The Information Age: Economy, Society and Culture, Volume I. Blackwell, Oxford. Dahlman, C. J., and Aubert, J. E. (2001) China and the Knowledge Economy: Seizing the 21st Century. World Bank Publications, Washington DC. De Mello, L. R. (1999) Foreign direct investment-led growth: evidence from time series and panel data, Oxford Economic Papers 51(1), 133–151. Dobbs R., Smit S., Remes J., Manyika J., Roxburgh C. and Restrepo A. (2011) Urban World: Mapping the Economic Power of Cities. McKinsey Global Institute. Erdman, D., Jackson, L. and Sinko, A. (2008) Zero-inflated Poisson and zero-inflated negative binomial models using the COUNTREG procedure. Paper presented at the meeting of SAS Global Forum, March. SAS Global Forum, San Antonio, TX. Florida, R. (2002) The economic geography of talent, Annals of the Association of American Geographers 92(4), 743–755. Friedmann, J. (1986) The world city hypothesis, Development and Change 17, 69–84. Glaeser, E. L. (2010) Agglomeration Economics. University of Chicago Press, Chicago, IL. Glass, A. J. and Saggi, K. (1998) International technology transfer and the technology gap, Journal of Development Economics 55(2), 369–398. Isard, W. (1956) Location and Space-Economy: A General Theory Relating to Industrial Location, Market Areas, Land Use, Trade, and Urban Structure. MIT Press, Cambridge, MA. Jacobs J. (1969) The Economy of Cities. Random House, New York. Jacobs J. (1984) Cities and the Wealth of Nations. Random House, New York. Johansson, B. and Quigley, J. M. (2004) Agglomeration and networks in spatial economies, in Florax, R. and Plane, D. A. (eds.) Fifty Years of Regional Science, pp. 165–176. Springer, Berlin. Kim, D. and Seo, J. S. (2003) Does FDI inflow crowd out domestic investment in Korea? Journal of Economic Studies 30(6), 605–622. Kimino, S., Driffield, N. and Saal, D. (2014) Spillovers from FDI and local networks: The importance of transactional linkages and vertical keiretsu in Japan, Multinational Business Review 22(2), 176–193. Krugman, P. (1991) Geography and Trade. MIT Press, Cambridge, MA. Krugman, P. (2011) The new economic geography, now middle-aged, Regional Studies 45(1), 1–7. Lin, P., Liu, Z. and Zhang, Y. (2009) Do Chinese domestic firms benefit from FDI inflow? Evidence of horizontal and vertical spillovers. China Economic Review 20(4), 677–691. Liu, Z. (2008) Foreign direct investment and technology spillovers: Theory and evidence. Journal of Development Economics 85(1), 176–193. Madariaga, N. and Poncet, S. (2007) FDI in Chinese cities: Spillovers and impact on growth, World Economy 30(5), 837–862. Mahroum, S., Huggins, R., Clayton, N., Pain, K. and Taylor, P. J. (2008) Innovation by Adoption: Measuring and Mapping Absorptive Capacity in UK Nations and Regions. National Endowment for Science, Technology and the Arts (NESTA), London. Marshall, A. (1920) Principles of Economics: An Introductory Volume. Macmillan and Co. Ltd., London. Meijers E. (2007). From central place to network model: Theory and evidence of a paradigm change, Tijdschrift voor economische en sociale geografie 98(2), 245–259. Ouyang, P. and Fu, S. (2012) Economic growth, local industrial development and inter-regional spillovers from foreign direct investment: Evidence from China, China Economic Review 23(2), 445–460. Pain, K. (2012) Spatial transformations of cities: Global city region, mega-city region? In Derudder, B., Hoyler, M., Taylor, P. J. and Witlox, F. (eds.) International Handbook of Globalization and World Cities, pp. 83–93. Edward Elgar, Cheltenham. Porter, M. E. (1990) The competitive advantage of nations, Harvard Business Review 68(2), 73–93. Powell, W. W., Koput, K. W. and Smith-Doerr, L. (1996) Interorganizational collaboration and the locus of innovation: Networks of learning in biotechnology, Administrative Science Quarterly, 116–145. Rama, M. (1993) Empirical investment equations for developing countries. In Servén, L. and Solimano, A. (eds.) Striving for Growth after Adjustment: The Role of Capital Formation (pp. 107–146). World Bank Publications, Washington DC. Sassen, S. (1991) The Global City, New York, London, Tokyo. Princeton University Press, Princeton, NJ. Scott, A. (2001) Globalization and the rise of global city-regions, European Planning Studies 9(7), 813–826. Taylor, P. J. (2004) World City Network: A Global Urban Analysis. Routledge, Abingdon. Turok, I. (2004) Cities, regions and competitiveness, Regional Studies 38(9), 1069–1083. UNCTAD (United Nation Conference on Trade and Development) (2013) World Investment Report. United Nations Press, New York. UN-Habitat (2013) State of the World’s Cities 2012/13. Routledge, Abingdon. United Nations (2013) World Population Prospects: The 2012 Revision. Population Division, Department of Economic and Social Affairs, United Nations, New York. Wall, R. S. and van der Knaap, G. A. (2011) Sectoral differentiation and network structure within contemporary worldwide corporate networks, Economic Geography 87(3), 267–308. Wall, R S. and Stavropoulos, S. (2016) Smart cities within world city networks, Applied Economics Letters 23(12), 875–879.
APPENDIXFigure 3 Tests and model fit statistics
Note: AIC – Akaike’s information criteria; BIC – Bayesian information criteria; LrX2 – likelihood-ratio X2. Figure 4 Distribution of count data for NBRM and PRM
NOTES* Shuai Shi and Kathy Pain, Real Estate & Planning, Henley Business School, University of Reading, UK (email: k.pain@reading.ac.uk) ** Ronald Wall, Erasmus University Rotterdam, Netherlands and School of Economics & Business Sciences, Faculty of Commerce Law & Management, University of the Witwatersrand, Johannesburg, S. Africa 1. Keiretsu is an informal Japanese company association scheme, involving business partnerships and cross-shareholdings. 2. In the star network pattern, one star node dominates the network while other nodes are connected only via the star node. 3. A sinker role denotes inward investments that outweigh outward investments. 4. An outsider has outward investments that outweigh inward investments. 5. Actors with a bridging role have the capacity to link unconnected parts of a network.
|
|||||||||||||||||||||||||||||||||||||||||||||||||||||||||||||||||||||||||||||||||||||||||||||||||||||||||||||||||||||||||||||||||||||||||||||||||||||||||||||||||||||||||||||||||||||||||||||||||||||||||||||||||||||||||||||||||||||||||||||||||||||||||||||||||||||||||||||||||||||||||||||||||||||||||||||||||||||||||||||||||||||||||||||||||||||||||||||||||||||||||||||||||||||||||||||||||||||||||||||||||||||||||||||||||||||||||||||||||||||||||||||||||||||||||||||||||||||||||||||||||||||||||||||||||||||||||||||||||||||||||||||||||||||||||||||||||||||||||||||||||||||||||||||||||||||||||||||||||||||||||||||
 (1)
(1)
 (2)
(2)
 (3)
(3)
 (4)
(4)
 (5)
(5)
 (6)
(6)