GaWC Research Bulletin 442 |
|
|
|
This Research Bulletin has been published in Urban Studies Please refer to the published version when quoting the paper
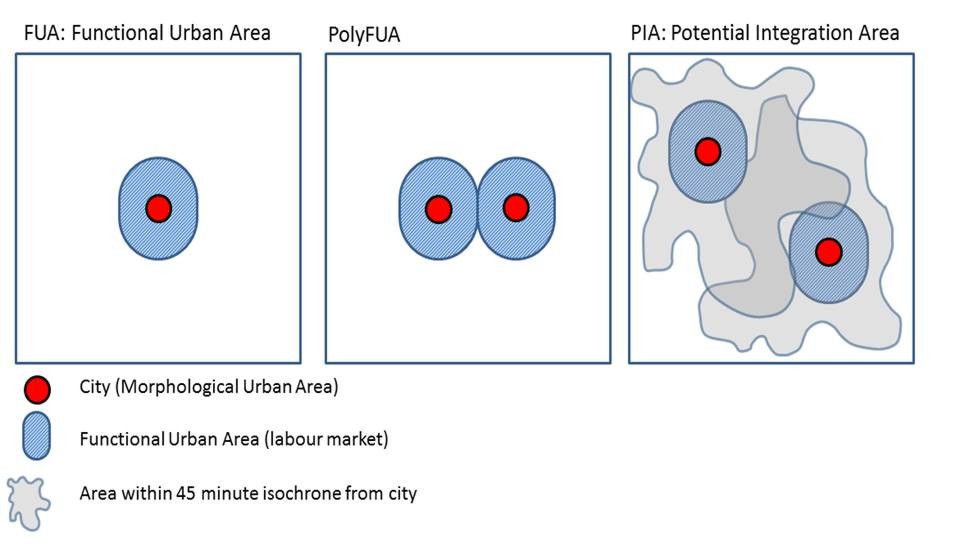
INTRODUCTIONA new spatial-economic planning concept is rapidly gaining prominence in the Low Countries. In the Netherlands and Flanders, national and spatial-economic development policies in progress have coined the borrowed size'1 concept as an important means of overcoming a perceived lack of critical mass in their cities (RLI, 2014; Ministerie van de Vlaamse Gemeenschap, 2012), herein supported by the OECD (OECD, 2014). As such, the borrowed size concept represents a governmental response to an abundance of literature, and particularly New Economic Geography literature, which stresses the importance of agglomeration benefits of large cities as key drivers of economic growth (Glaeser, 2011). Certainly from an international perspective, these countries lack large metropolises and are instead densely dotted with small- and medium-sized cities that, given their size, do not appear overly endowed with agglomeration benefits. Indeed, Henderson (2000) concluded that the Netherlands and Belgium are two of the few countries worldwide with too little urban concentration and that this negatively affects economic growth. This lack of urban concentration is the product of deliberate political and societal decision-making. Fear of agglomeration costs such as overcrowding, congestion, unhealthy living environments, large-scale social unrest, and socialist movement dominance have for a major part of the 20 th century affected urban development policies in the Netherlands and Flanders. Such policies have either been anti-urban (Flanders) or were aimed at urban containment and redistribution and deconcentration (Netherlands) (Kesteloot & De Maesschalck, 2001; Zonneveld, 2007). While dominant cultural and political attitudes do not generally support further development concentration in a dominant core, policy-makers feel that it should nevertheless be possible to organise the benefits of a large metropolis in a network of small- and medium-sized cities through the borrowed size' planning principle. New planning concepts have historically been embraced without sound conceptual elaboration and strong empirical underpinning. Such concepts have perhaps been adopted precisely because such conceptualisations and substantiations have been missing. In turn, a wide variety of stakeholders can translate a concept into terms amenable to their situation. However, this raises serious questions regarding the actual value of ill-defined and un-empirically justified policy concepts in reaching policy objectives, and hence whether accompanying investment programmes are being prioritised most effectively. On this issue, Phelps (2004:980) remarks that while the concept of borrowed size is intuitively appealing in its simplicity ', it is difficult to pin down analytically and its utility remains to be demonstrated '. This paper scrutinises the concept of borrowed size' for the purpose of conceptual clarification and to explore its empirical justification thus far in this early stage of policymaking and debate. In addition to providing a synthesis of existing literature regarding empirical justifications of the concept, we aim to develop novel information by presenting several explorative analyses of the concept's key premises as they were put forward in the original conceptualisation by Alonso (1973). In this paper, we first discuss the origins and meaning of the borrowed size concept. Alonso's original conceptualisation is deconstructed into five main premises (section 2). Building on studies that directly assess the concept as well as those that indirectly address any of its constituting premises, we then discuss whether borrowed size' is an empirical phenomenon (section 3). As evidence surrounding the borrowed size concept is far from conclusive, explorative empirical analyses in section 4 examine 1) instances of borrowed size in differently organised urban systems; 2) whether borrowed size is unique to small cities; and 3) whether borrowed size processes are enabled through spatial integration. This analysis generates novel information for better framing the concept of borrowed size, allowing us to stretch the concept to enhance its instrumental value as a planning principle (section 5). Origins and meaning of the borrowed size' conceptThe borrowed size' concept originates from the work of well-known planner and economist William Alonso, who coined the concept in a 1973 paper that discussed pros and cons of population growth. Although Alonso does not offer a clear definition, it is possible to distil key characteristics of the borrowed size concept from less than one page of writing he dedicated to describing the concept. The five basic premises of the concept are that it involves (A) a situation in which (B) especially smaller cities (C) located within larger megapolitan complexes do (D) perform more favourably due to their (E) access to the agglomeration benefits of larger neighbouring cities. We further explain these five premises below. A) Analytical concept - While this paper opened with the observation that borrowed size has become a normative policy concept, Alonso's description presents it as an observable and analytical concept. B) Small cities - Alonso presents borrowed size as a one-way process through which small cities borrow size from larger neighbours, and not vice versa. He uses the concept to explain why smaller cities positioned close to large metropolitan areas of the Megalopolis along the Northeastern Seaboard of the U.S. perform relatively better than isolated cities. His description leaves room for the broader notion that also small cities of equivalent size can borrow size among each other when he writes that borrowed size: [i] s also quite visible, although virtually unstudied, in certain European urban patterns, such as those of Germany and the Low Countries, whose cities, quite small by our [American sic] standards, apparently achieve sufficient scale for the functioning of a modern economy by borrowing size from each other . (Alonso, 1973:200). C) Multicentric metropolitan areas - Not all smaller cities can borrow size. Alonso highlights a distinction between smaller cities that are part of larger metropolitan areas and independent metropoles of equivalent size (Alonso, 1973:200). As such, he emphasises the need for geographical proximity and functional interconnectedness. A city must be positioned close to other cities and must form part of the same functional entity to borrow size. D) Balance of agglomeration benefits and costs - Small cities in multicentric metropolitan areas perform more favourably than isolated small cities largely due to the former's superior balance of agglomeration benefits and costs: While they retain many advantages of smaller size, such as lower levels of congestion, they enjoy advantages of larger size through their easy access to other centers. Their people can use the shopping and entertainment facilities of other cities to complement their own, their businessmen can share such facilities as warehousing and business services, and their labor markets enjoy a wider and more flexible range of demand and supply (Alonso, 1973:200). E) Network connectivity - Alonso stresses that it is the access to large city urbanisation advantages that provides smaller cities an advantage. Accessibility and network connectivity are necessary for borrowed size to occur. As a proxy for connectivity, he recommends the use of population potential', defined as the number of people who can be reached easily and thus opportunities for interaction available in a given space. These five basic features of Alonso's (1973) original conceptualisation (analytical concept; small cities; multicentric metropolitan areas; balance of agglomeration benefits and costs; and network connectivity) are scrutinised in the following section. Existing evidence of borrowed size'For unclear reasons, after this initial 1973 publication on the borrowed size concept, the concept did not attract much research interest in following decades, with the exception of occasional references (Hoffman & Killefer, 1975; Hepworth, 1992). Yet, the concept began to serve as part of an explanatory research framework in studies by Phelps (1998; 2004) and colleagues (Phelps et al., 2001), who used the concept to explain economic developments in edge cities, or suburban places. This section brings together existing empirical studies that address (elements of) the borrowed size concept to assess its empirical justification. Our discussion focuses on the five features of borrowed size identified in the previous section. Analytical Concept: Operationalising Borrowed SizeTo be an analytical concept, borrowed size' requires an operationalisation that renders it a testable notion. Alonso (1973:200) offers clear guidelines in his statement that borrowed size involves a small city or metropolitan area exhibiting some of the characteristics of a larger city if it is near other population concentrations . This is indeed central to operationalising the concept: there must be a disconnection between the size of a place and a characteristic of that place, and this disconnection should be caused by the position of a place vis-à-vis other (larger) cities. Hence, the operationalisation of borrowed size involves addressing two questions. First, what are these characteristics? Alonso mentions per capita income and faster (population) growth indicators also used by Partridge et al. (2008; 2009; 2010), who also add housing cost development. More recent explorations adopt a functional or sectoral approach. For instance, Hesse (2014:5), discussing the position of Luxembourg, associates borrowed size with the observation that the rather small place has been able to specialise in a set of functions that are usually confined to major metropolitan areas, particularly gaining a high share of occupation in the financial and corporate services sub-sectors . Burger et al. (2015) consider the presence of cultural amenities. Phelps (1998) focuses on service sector employment and office and retail floor space, while Phelps et al. (2001) use the concept to explain the presence of (small) firms in service sectors based on an assumption that such firms would normally perform better in large cities due to the existence of agglomeration externalities. This latter assumption is indeed a critical one: to explore a disconnection between size and function or another performance measure, research should have previously established that such characteristics are or were strongly connected to city size. This is certainly true of the indicators mentioned here (Eaton and Eckstein, 1997; Polèse and Shearmur, 2006; BBSR, 2011), although in a system characterised by borrowed size, this relationship should have grown increasingly unclear. This may partly explain why, for instance, wage differentials are low (Groot et al., 2014) in countries such as the Netherlands. The second question concerns how a city's positioning should be measured relative to another. One can essentially measure the distance (in kilometres or time) to the closest larger city (or a hierarchy of places, see Partridge et al., 2008) or whether a city is located within a pre-defined metropolitan unit. Alternatively, one may use an accessibility measure or another indicator of network embeddedness (connectivity). Alonso evidently stressed the use of accessibility measures by recommending the use of the population potential' indicator. Small CitiesDo only small cities borrow size? Undeniably, the borrowed size concept is generally employed by authors that study the fortunes of small- or medium-sized cities, suburban places or edge cities Phelps (2004) even refers to some of these as banal' places. In policy-making, it is adopted by public authorities addressing small cities that appear to lack the mass necessary for large-scale agglomeration economies. While numerous studies examine the effects of a city's location relative to larger or higher-tier cities (see Sohn, 2012), we are not aware of studies that explicitly examine the effects of proximity to smaller or lower-tier cities. Perhaps the positive effects of having smaller neighbouring cities are largely taken for granted, which is for instance reflected in the recent adoption of ideas rooted in central place theory in New Economic Geography. Smaller cities that surround larger cities are merely considered part of the urban hinterland from which larger cities draw support for urban functions. However, this would encompass a rather evident case of borrowed size, as it implies that the size and function of the central city becomes disconnected though interactions with surrounding hinterland cities. In addition to considering the role of large cities when determining whether the borrowed size phenomenon is rightly associated strictly with small cities, we may equally question whether such effects are reserved for cities at all. Polèse and Shearmur (2006), for instance, suggest that differences between small cities and surrounding non-urban areas within larger metropolitan areas are growing less distinct. Multicentric Metropolitan AreasAccording to Alonso, borrowed size constitutes a phenomenon observable in multicentric metropolitan areas, whereas policy-makers in the Netherlands and Flanders emphasise its occurrence in polycentric metropolitan areas. A paper by Brezzi and Veneri (2015) that explores multicentricity (multiple cities in a metropolitan area irrespective of their size distribution) and polycentricity (multiple cities of more or less equal size in a metropolitan area) in large OECD regions shows that multicentricity has no significant effect on GDP per capita. In other words, having neighbouring agglomerations does not affect regional performance at large. However, in cases where there are multiple relatively equally sized agglomerations in a region, the authors find that polycentricity has a negative effect on regional performance. This corresponds to earlier empirical work in which polycentricity is associated with lower performance due to a lack of agglomeration benefits and a duplication of lower-order urban functions (Meijers, 2008; Burger et al., 2014). Likewise, Partridge et al. (2009) identify growth shadow effects among relatively equally sized small cities in polycentric metropolitan areas, though the size of their small city' category is too broad (50k-250k) to draw final conclusions regarding polycentricity. Whether this implies that there is no borrowed size effect (Brezzi and Veneri, 2015) is difficult to determine. While individual cities may be punching well above their weight, on a regional scale, this may constitute a zero-sum game. It is at the local scale and not the regional scale that borrowed size effects occur, according to Alonso's conceptualisation. Studies examining local effects of having neighbouring cities on small cities have generated mixed results. Erickcek and McKinney (2006) found that U.S. metro areas located within larger consolidated metropolitan areas did not perform significantly better in the 1990s than isolated areas. However, Polèse and Shearmur (2006) found that employment rates grew substantially faster in the last decades of the previous century in small cities positioned close to large cities than in small peripheral cities. The same holds true for population growth. Partridge et al. (2008:753) find that greater distance from higher tiered urban areas negatively affects population growth, and despite declines in transport costs, technological advances in communication and the dispersion of manufacturing to low-cost locations, the economic costs of remoteness appear to be increasing . Dobkins and Ioannides (2001), examining urban population growth in the evolving U.S. urban system over a much longer period, found that distance to higher-tier cities does not always determine growth. The authors do, however, find that growth in nearby cities leads to local urban growth, thereby diminishing the importance of local growth factors (Dobkins and Ioannides, 2001). It could be argued that positioning within a multicentric or polycentric metropolitan area may also negatively affect growth. Such an argument builds on the agglomeration shadows' concept, a New Economic Geography (NEG) term coined by Krugman (e.g., 1993) to describe a shadow effect of firm agglomeration on surrounding areas. The concept implies that growth near concentrations of firms will be limited by competition effects. Positioning within the shadow' is not profitable for firms. The agglomeration shadow concept is clearly inspired by central place theory in that spaces within the agglomeration shadow' of a central place are smaller and can only offer the most basic goods and services. As with industries, the geographical size of the agglomeration shadow is shaped by central place functions involved. Neighbouring cities may cast an agglomeration shadow, consequently limiting development opportunities. This conception of agglomeration shadows then is the opposite of the notion of borrowed size. Balance of Agglomeration Benefits and CostsWhile it remains uncertain whether small cities offer firms and households potential cost savings, an abundance of literature stresses that firms and households are sensitive to agglomeration benefits offered through large cities (Erickcek and McKinney, 2006). The balance between agglomeration benefits and costs varies from place to place (Camagni et al., 2013) and this heavily shapes industry location patterns (Polèse and Shearmur, 2006). Additionally, households weigh up the presence of urban advantages (e.g., amenities) with their sensitivity to agglomeration costs such as congestion, exposure to environmental pollution and social problems such as higher crime rates. Though city size clearly affects the development of agglomeration benefits, so too does location vis-à-vis other cities. Smaller cities surrounding larger metropolitan areas are more attractive to industries than equally sized cities without a large neighbour. Such areas may profit from crowding out' processes affecting their larger neighbour, causing mid-tech, space-extensive industries that are sensitive to wage and land costs to relocate to smaller cities (Henderson, 1997; Polèse and Shearmur, 2006). Phelps et al. (2001) emphasise this complementarity between local advantages (such as lower rents and less congestion) and advantages drawn from nearby settlements through business transactions and interactions (access to sizeable markets, business services and knowledge, larger and more diversified labour markets and consumption amenities in, for instance, culture) as the essence of the borrowed size concept. Indeed, for many firms, accessibility, rather than presence in or close proximity to agglomeration advantages suffices (Parr, 2002). Perhaps polycentric metropolitan areas (areas where borrowed size would be especially likely to occur) are characterised by a special balance between agglomeration benefits and costs. Meijers and Burger (2010) show that in the U.S. urban system this balance is better in polycentric metropolitan areas than in those areas dominated by a large city. Interestingly, some scholars have suggested that agglomeration costs are confined more to the city boundaries than the spatial range of agglomeration benefits (Parr, 2002). Hence, if cities in polycentric metropolitan areas would borrow size to a greater extent, they may become highly favourable environments to locate. This constitutes one reason why borrowed size is being adopted as a policy concept in the polycentric Benelux countries. Network ConnectivityThus, it is quite clear that the fortunes of small cities are strongly linked to their positioning relative to other places. According to Partridge et al. (2008), factors relevant to metropolitan growth such as agglomeration, industry mix and congestion also hold for smaller cities, though the role that these factors play is mediated by a city's proximity to large metropolitan areas. The authors found that with every kilometre increase in distance from various tiers of higher-order cities, cities experience additional population growth penalties. Perhaps distance does not matter most. Rather, this factor may matter only because it impedes interaction. Phelps stressed that borrowed size is inextricably linked to interaction, the latter constituting both a measure of, and the mechanism enabling, borrowed size (Phelps et al., 2001:615). Given this emphasis on interaction rather than size, and given the importance of interaction for agglomeration economies to develop, Polèse and Shearmur (2006) even prefer the term borrowed agglomeration economies' to borrowed size'. Another term could be positive agglomeration spillovers' (Partridge et al., 2009). This need for interaction for borrowed size to occur may suggest limits to areas from which one can access agglomeration externalities elsewhere. A one-hour travel time distance is suggested by Polèse and Shearmur (2006:372), as [w] ithin the one-hour travel-time range, face-to-face contacts can still be maintained with the neighbouring metropolis, but without incurring the congestion costs of an intrametropolitan location . This allows firms to locate in small towns while still accessing specialised labour and informational external economies of larger nearby places, as Phelps et al. (2001) show. As labour represents one of the least mobile production factors, (specialised) labour market integration is a significant cause of borrowed size (Phelps, 1998). However, as connectivity and accessibility are not ubiquitous, borrowed size should not be interpreted as being reserved to a certain zone surrounding a city, but rather as a network phenomenon. Hesse (2014:6) remarks that borrowing size or significance no longer relies on physical proximity between the cities, but on embeddedness in overarching networks between and within polycentric city-regions, via corporate relations, market pervasion and, last but not least, information and communication networks . A recent study that explicitly links networks with borrowed size shows that being well embedded in national and international networks allows to borrow size in the sense that cities that are very well connected have more metropolitan functions, though the authors also show that networks cannot substitute for proximity for all types of metropolitan functions, and that in particular larger cities are especially capable of capitalising on network connectivity (Meijers et al., forthcoming). This study also shows that stronger regional network embeddedness (measured as the population potential that can be reached within 45 minutes) generally produces competition effects for certain metropolitan functions, resulting in agglomeration shadow dominance rather than borrowed size on the regional scale. Indeed, greater connectedness and access to large city benefits may also expose firms and households to fiercer competition (Meijers et al., 2012). In other words, isolation protects. Acting as service centres for surrounding rural areas, small peripheral cities tend to exhibit comparatively stronger professional and business services profiles (Polèse and Shearmur, 2006). Occasionally, these cities offer public services of general interest (education, a hospital, etc.) for which they lack the supporting critical mass independently, but which guarantee a just spatial distribution that allows for equal access to basic services. One may refer to the latter as a case of institutional borrowed size' rather than as a functional process. Exploring the borrowed size conceptOur review of existing literature on the borrowed size concept not only shows that findings are mixed and far from conclusive but also that important gaps remain in empirical explorations of the concept. In particular, we hold reservations over the assumed link between borrowed size processes and small cities, over whether having neighbouring cities close by is beneficial and on whether distance, accessibility or interaction promote borrowed size processes. This section presents an empirical analysis of these facets of the borrowed size concept to determine the validity of key premises of the concept as defined by Alonso. We address the following three questions: 1. Does borrowed size occur more frequently in multicentric or polycentric metropolitan regions? 2. Is borrowed size limited to small cities within multicentric/polycentric cities? 3. Is borrowed size related to spatial integration? Research ApproachAs discussed in section 3.1, borrowed size becomes evident in a (positive) disconnection between the size and a particular characteristic of a city that can be attributed to the city's positioning within a network of cities. In this paper, we adopt a functional view of borrowed size by examining the presence of metropolitan functions. A database on the location of metropolitan functions was obtained from the German Federal Institute for Research on Building, Urban Affairs and Spatial Development (BBSR, 2011). This database includes functions in the domains of Political-administrative functions' (including the presence of EU institutions, international organisations and NGOs); Science' (including the presence of major universities and international research organisations); Corporate functions' (including the presence of top-500 firms measured on the basis of turnover rate and staff size, advanced producer services, banks, and exhibition fairs); Culture' (subdivided into cultural events; including music concerts, art fairs and film festivals; and cultural venues; including top-tier theatres, opera houses, galleries and museums); and Sports' (including sport stadiums, Olympic summer games venues, and major sports events). Data on individual metropolitan functions were gathered for the 2004-2009 period, with the majority of data corresponding to 2008. For an extensive account on how these data were gathered, please consult BBSR (2011)2. In our analyses, we consider indices for these five domains with a primary focus on an aggregate index of all metropolitan functions. The indices were calculated by normalising the scores of each constituting indicator on a scale from 0 (no presence of metropolitan functions) to 100 (maximum), summing these scores and then dividing this value by the number of indicators involved. The metropolitan functions database was obtained at a highly detailed spatial scale (LAU2) for the entire European continent. Because our interest lies in urban agglomerations (cities), the LAU2 geographical level was aggregated to territorial units that best reflect city data: Morphological Urban Areas' (MUA), or contiguous built-up areas. This delimitation was provided through the ESPON 1.4.3 project (IGEAT, 2007), which updated similar work in the ESPON 1.1.1 project (Nordregio, 2004). We examined all 1,967 urban agglomerations (from now on, simply referred to as cities) that have been identified in the EU25 and in Norway and Switzerland. For each city, hinterland areas (defined from commuter basins) were also identified. Cities and hinterlands form so-called Functional Urban Areas (FUA) (see ESPON 1.4.3). A number of other territorial delimitations is available, which reflect increasingly less functionally integrated areas. The next level of functional coherence is the so-called polyFUA (see again ESPON 1.4.3). PolyFUAs are constructed when contiguous FUAs are merged based on criteria such as city sizes and distances between them. For instance, large cities (>500k) positioned less than 60 km apart with labour basins touching each other were merged, and for smaller cities, this threshold was set at 30 km. The ESPON 1.1.1 project defined metropolitan regions that are even less functionally integrated, as reflected through the name of these constructs: Potential Integration Areas (PIAs). These are constructed by merging FUAs of which the area that can be reached within 45 minutes overlaps by at least 33%. Figure 1 graphically presents these territorial delimitations. Figure 1. Territorial delimitations used in the study.
Finally, a distinction was made between isolated cities and those positioned near other cities. The latter are referred to as cases of multicentricity. These cities are located in a FUA, polyFUA or PIA that includes multiple cities. Furthermore, because the notion of borrowed size in policy debates predominantly arises through discussions on the future development of polycentric metropolitan areas, we examined the balance between nearby cities. Polycentric metropolitan areas lack a dominant urban core (Kloosterman and Musterd, 2001; Parr, 2004) and consist of rather evenly sized cities. Here, we adopt a morphological rather than functional perspective of polycentricity (see Burger and Meijers, 2012) by measuring the level of polycentricity of multicentric regions using the Herfindahl-Hirschman Index, a common indicator for measuring competition levels based on market concentration. This means that we squared the share of each city in the total city population of their metropolitan area and then summed the resulting number for each region. Summations approaching 0 indicate the absence of one dominant city, while summations approaching 1 suggest the presence of one dominant city. A threshold value of 0.56, under which a region should be considered polycentric, was determined as a reasonably good threshold, as it excludes obvious monocentric metropolitan areas and includes the usual suspects such as the Randstad, the RheinRuhr area, Central Belgium, the Zürich metropolitan region, the metropolitan region of Katowice, Tyneside, Leeds-Bradford, and Öresund, to name some of the larger examples.3 Our inventory shows that of all 1,967 cities included, 651 do not have neighbouring cities, while the other 1,316 do. Of these 1,316 cities located within a multicentric metropolitan area, 609 are located in what can be considered polycentric metropolitan areas. Borrowed Size, Multicentricity and PolycentricityAlonso (1973) expected that borrowed size occurs more in multicentric areas, while policy-makers relate it more to polycentric areas. We expect that both are right. Borrowed size becomes evident through a (positive) disconnection between city size and the presence of metropolitan functions. In addition, this disconnection must be caused by a city's position in the wider urban system. Here, we explore correlations between size and function (lower levels indicating a disconnection of size and function), and relate this to whether cities do have neighbouring cities or not. Table 1 presents the Pearson's zero-order correlations between size and the presence of metropolitan functions in cities. The first row presents bivariate correlations for all European cities. Considering for instance the aggregate index of metropolitan functions, the correlation with size is very high (0.886). Political-administrative functions appear least associated with size, though corporate functions are more common in larger cities. The next two rows of Table 1 consider multicentricity: whether a city is positioned close to neighbouring cities. Perhaps surprisingly, isolated cities exhibit a lower correlation between size and function than those with neighbouring cities. In particular, scientific functions are often present in small, isolated cities. Perhaps this more closely reflects historical and political patterns (institutional borrowed size') than a rational economic distribution. This suggests that there may be more driving forces behind borrowed size than the spatial-economic processes we are looking for. In any case, the presence of neighbouring cities does not automatically spur a process of borrowing size. The next two rows of Table 1 divide cities with neighbouring cities into two groups: those located within metropolitan areas without a dominant urban core (polycentric metropolitan areas), and those located within a more hierarchically organised metropolitan area (monocentric). We observed earlier that the borrowed size phenomenon has been associated with polycentricity. This is correct: borrowed size processes (and its counterpart agglomeration shadows) appear to occur more frequently in polycentric metropolitan areas. The correlation between size and function is much lower in such areas than it is for cities that form part of a metropolitan area with a dominant urban core. This holds true for all metropolitan functions with the exception of major sports venues and events. In cases of monocentricity, dominant cities appear to absorb all functions, producing a strong connection between size and function. Apparently, borrowed size processes occur more often between equally sized neighbouring cities than between neighbouring cities in general. Table 1. The (dis)connection between size and function in different urban systems Pearson zero-order correlations.
All correlations are significant at the 0.01 level (two-tailed). Obviously, the absence of a connection between size and the presence of metropolitan functions does not necessarily imply that deficits in one place are compensated by surpluses in a neighbouring city. To explore whether this is the case, we estimated the following reduced-form metropolitan functions model for the group of cities with neighbouring cities in a polycentric metropolitan area: MF ij = ? City Size ij + ? Size Rest PolyFUA jit + O MF Rest PolyFUA jit + S Control j + e j + µ ij Where MF ii is the value that the metropolitan functions index takes in city i in country j and City Size reflects the number of inhabitants in city i . Size Rest PolyFUA captures the rest of the population in the wider metropolitan area, MF Rest PolyFUA captures the sum of the metropolitan functions index of neighbouring cities in the same metropolitan area, Control ij is a vector of other city characteristics4, e i a vector of country dummies to control for country characteristics, and µ ij a residual error. In line with the theory on borrowed size, the population of neighbouring places would increase additional external demand, while the presence of functions elsewhere in the PolyFUA would result in external competing sources of supply, potentially reducing the number of functions in a city (Burger et al. 2015). Table 2 shows the results. All models were estimated using Ordinary Least Squares (OLS) using robust standard errors. Variance Inflation Factor statistics indicated no multicollinearity problems. The results show a negative association between the presence of metropolitan functions in neighbouring cities and the presence of metropolitan functions in the own city. However, the size of the population in neighbouring cities in polycentric metropolitan areas is positively associated with the presence of metropolitan functions. These results strengthen the belief that the absence of a connection between size and the presence of metropolitan functions in polycentric metropolitan areas is a sign of borrowed size. When re-estimating the model for the different metropolitan functions, we find especially evidence of borrowed size in the domains of corporate, cultural, and sports functions; although the coefficient of MF in the rest of the metropolitan area is negative for the estimations regarding political and science functions, there is too much uncertainty regarding the true value of the parameter estimate. Similar conclusions can be drawn regarding the coefficient of the population size in neighbouring cities. Table 2. OLS on Metropolitan Functions Index in Cities with Neighbouring Cities in Polycentric Metropolitan Areas.
Borrowed Size and City SizeAccording to Alonso's conceptualisation, borrowed size would be especially prevalent in small cities that form part of a larger megapolitan area with multiple agglomerations. We expect that it is not limited to just small cities. To explore the relationship between city size and borrowed size processes, we first determined whether cities borrow size or not, by regressing size on the total index of metropolitan functions. Institutional and development differences between countries were controlled for by including country dummies.5 Through subsequent inspection of residuals, it is straightforward to categorise cities as either borrowing size' (in functional terms) or not borrowing size'. A city with a positive residual does borrow size, as it supports more metropolitan functions than normally expected in a city of that size. However, a city with a negative residual manages fewer functions than expected given its size. This can be interpreted as a case of an agglomeration shadow. In addition, there is a third category consisting of (mostly small) cities that do not host any metropolitan functions at all, and that are also not expected to do so. Distinguishing between cities that are borrowing size and those that do not, we performed a logistic regression analysis to explore the probability that different sorts of cities borrow size. Table 3 shows the multivariate logistic regression analysis results for borrowing size, compared with agglomeration shadows or the absence of metropolitan functions. City size turns out to be an important predictor of the odds of borrowing size. Compared to small cities (<76k inhabitants), medium-sized cities (Odds Ratio [OR] 1.86, p<0.01), large cities (OR 1.87, p<0.01) and very large cities (OR 2.70 p<0.01), had significantly higher odds of borrowing size. No significant differences between the medium-sized (76-200k), large (201-500k), and very large cities (>500k) were found. Likewise, whether a city was isolated or situated in a monocentric or polycentric metropolitan area does not seem to affect the odds of borrowing size at first sight. However, when we interact our size class with city environment dimensions, we observe that the odds of borrowing size are significantly lower for medium-sized cities in polycentric metropolitan areas compared to isolated medium-sized cities (OR 0.55, p<0.05; Column 3). The odds of borrowing size are also lower for medium-size cities in monocentric metropolitan areas compared to isolated medium-sized cites (OR 0.67), but this difference is not statistically significant at the 5% level. On the contrary, large cities in polycentric metropolitan areas have higher odds for borrowing size compared to isolated large cities (OR=4.23, p<0.05; Column 4). Also large cities in monocentric metropolitan areas have higher odds (OR 1.88) of borrowing size compared to isolated large cities, but this difference is not statistically significant. For very large cities, no significant differences are observed, mainly due to a lack of statistical power: only a very small number of very large cities are isolated (n=5) (see Table 3, Column 5). Table 3. Multivariate Logistic Regression on Factors associated with Borrowing Size of Cities (N=1967) Dependent Variable: Borrowing Size (1=YES) based on positive residual based on estimation with size and country dummies
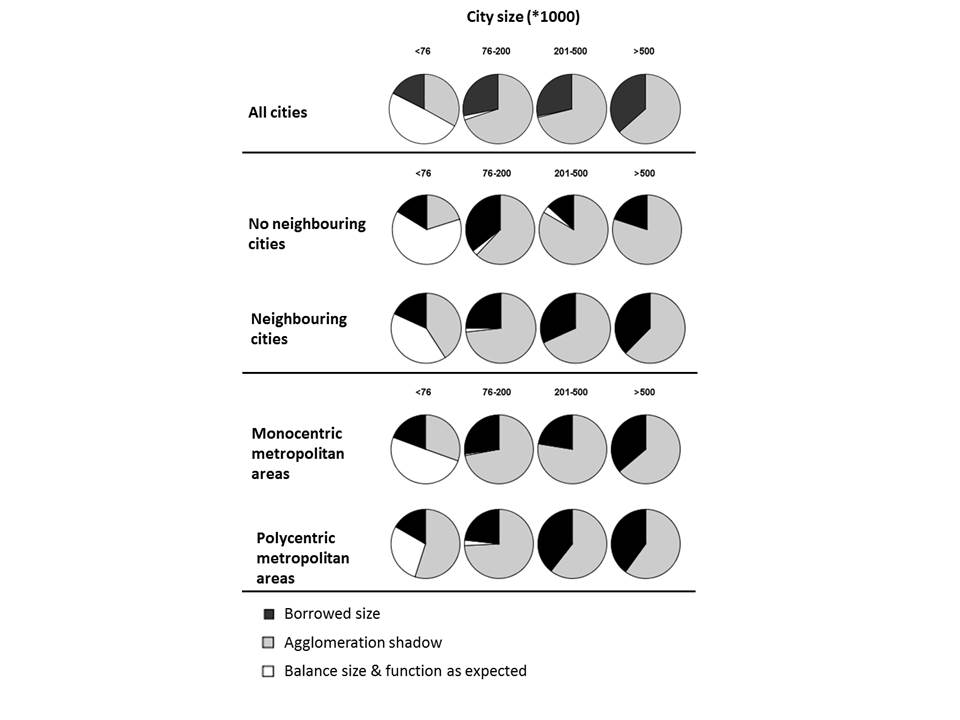
While the odds of borrowing size are against smaller cities, this does not exclude that some do, see Figure 2. The upper row displays general relationships between size and whether a city borrows size or not. The second and third rows of the pie diagrams determine whether a city is either isolated or surrounded by neighbouring cities. Finally, the fourth and fifth rows only consider cities with neighbouring cities and distinguish between cities located within a polycentric metropolitan area and those that are not (hence, located in a monocentric metropolitan area). Figure 2. City size, location and borrowed size.
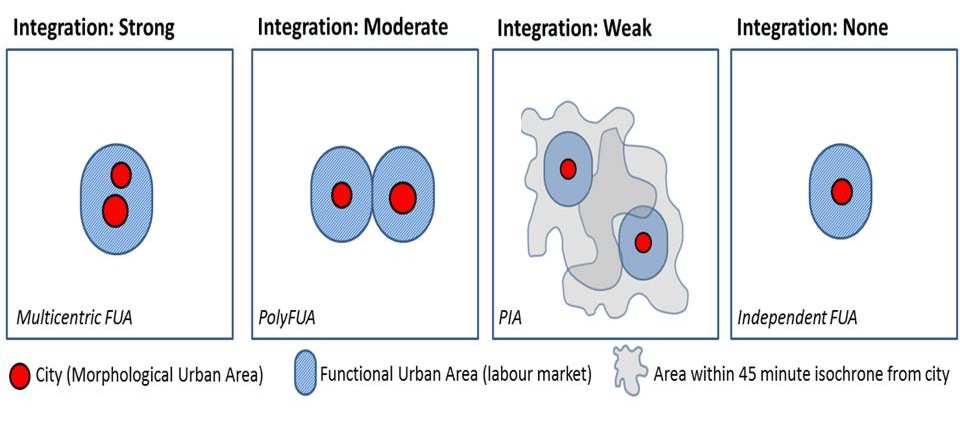
Figure 2 shows that a far greater part of the cities does not borrow size. Again, a clear relationship with size is evident, as larger cities more frequently borrow size than smaller cities. An absence of neighbouring cities results in fewer size-borrowing opportunities, especially for larger cities (row 2). However, medium-sized cities that are isolated face less agglomeration shadows than medium-sized cities with neighbouring cities. More often, these cities appear to play a more central role for their rural hinterland than similarly sized cities located within multicentric metropolitan areas. Small cities with neighbouring cities borrow size only slightly more often than small cities without neighbouring cities. Of those cities that do have neighbours, it appears that larger cities in polycentric metropolitan areas borrow size more often than those within monocentric metropolitan areas (rows 4 and 5). Overall, one may conclude that borrowed size (in functional terms) is not reserved to small cities, but instead occurs more often in larger cities, and especially among those that form part of a polycentric metropolitan entity. Borrowed Size and IntegrationMost studies directly or indirectly assessing borrowed size focused on proximity and/or accessibility. Instead, we focus on the role of functional integration. This is likely to be fostered by proximity and accessibility, but not necessarily. The various territorial delimitations applied in this study (see Figure 1) translate into different levels of functional integration between cities (see Figure 3). We expect that stronger integration between cities fosters size borrowing. Figure 3. Varying levels of integration between cities.
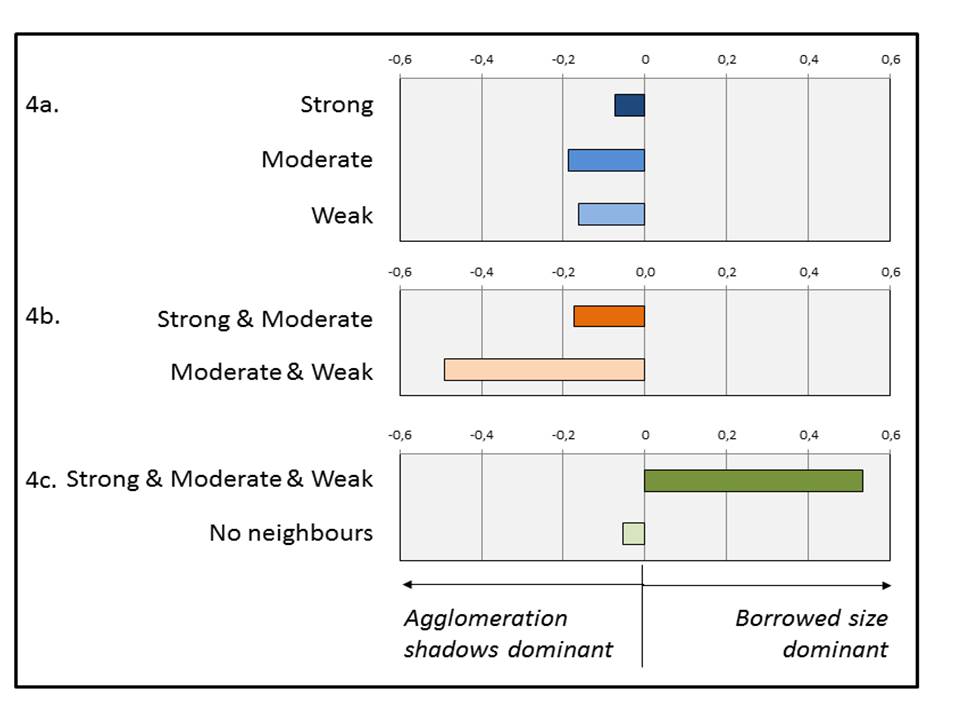
It can be assumed that the strongest degree of functional integration between two cities occurs when two or more cities form part of the same Functional Urban Area. Of the 1,967 cities examined, 586 are positioned within FUAs that include multiple cities . The next (lower) level of functional integration exists between cities in so-called polyFUAs'. Of the 1,967 cities examined, 327 form part of a polyFUA . Finally, the weakest degree of integration is found in what is termed Potential Integration Areas' (PIAs). In fact, the name of this territorial construct already shows that it is more about potential integration than integration that has materialised. Of the 1,967 cities examined, 1,035 form part of a PIA . Building on our previous regression analysis, in which we explained the index of metropolitan functions by size (and country dummies),6 we again consider residuals of this analysis.7 If stronger integration between cities promotes size borrowing, we expect that the average residual for cities in a strongly integrated metropolitan area (FUA) will be higher than that of cities in a moderately integrated metropolitan area (polyFUA), and certainly higher than that of cities that form part of a weakly integrated metropolitan area (PIA). We assume that using the average residual is advantageous, as we account for the extent to which a city borrows size or faces an agglomeration shadow. For instance, while multiple cities within a region may face a small agglomeration shadow, this can be more than compensated for if one city substantially borrows size. Figure 4 presents the relationship between integration levels and borrowed size. The analysis is complicated by the fact that many of the examined cities are located in both a FUA, polyFUA and/or a PIA, meaning that they have different levels of integration with other cities. Initially, we consider cities belonging to either a FUA, a polyFUA or a PIA, but not to any of the two other categories (see Figure 4a). We consider this the purest measurement of the effect of functional integration. In this case, it appears that cities that are strongly integrated with other cities perform better than cities that have neighbouring cities with which they are only moderately or weakly integrated. This suggests that a higher degree of functional integration between neighbouring cities may override negative effects of competition, diminishing agglomeration shadows. Next, allowing for the fact that many cities have relationships on multiple scales, meaning that cities are strongly integrated with some cities and moderately or weakly integrated with other cities, we compared cities with both strong and moderately strong ties with neighbouring cities with cities that have integrated only moderately and weakly with neighbouring cities (Figure 4b). While the general result obtained is similar, and agglomeration shadows continue to dominate, the shadow cast over the others is more pronounced in the absence of strong ties. This serves as another indication that functional integration is positive. Yet, these results should be considered with caution, as we cannot determine the exact ratio between strong and moderate ties or between moderate and weak ties for each city category. Finally, Figure 4c compares two extreme situations. On the one hand, cities exhibiting numerous strong, moderate and weak ties and on the other hand, cities that do not have neighbouring cities to connect with at all. The latter are not necessarily worse off as isolation protects against regional competition and naturally creates central place functions for the surrounding hinterland (institutional borrowed size'). However, it also implies that these cities cannot functionally borrow size, and what really stands out is that such a capacity is ultimately much more beneficial, as borrowed size effects dominate when cities have (many) strong, moderate and weak ties. Figure 4. Effects of level of functional integration with neighbouring cities on borrowed size (average surplus or deficit of metropolitan functions per city).
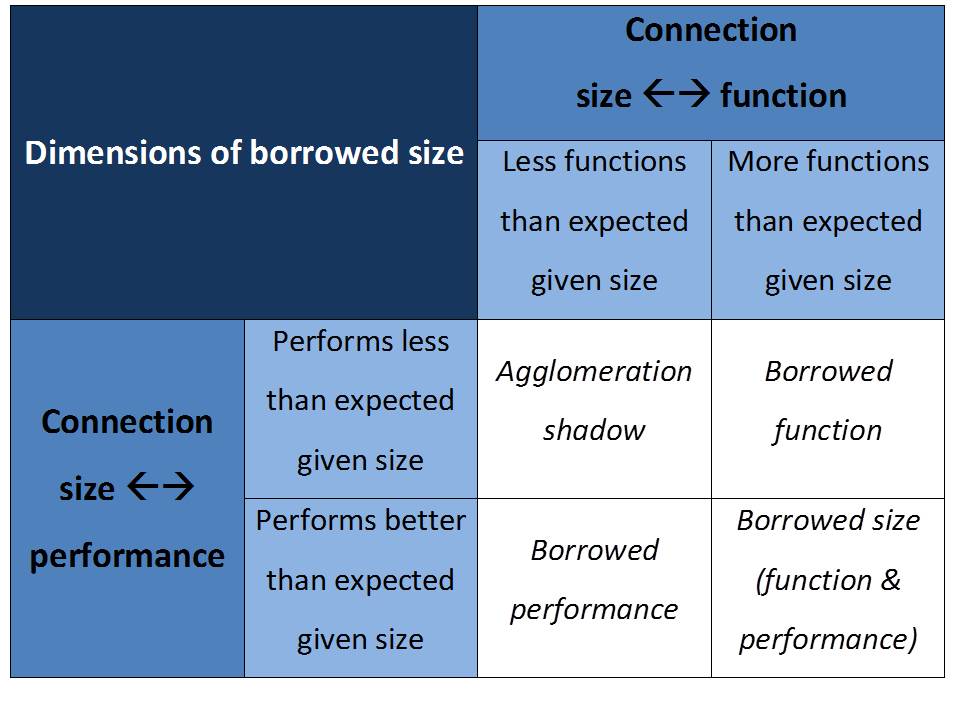
Number of cities per category: Strong ties with neighbouring cities (180), Moderate ties (18), Weak ties (611), Strong and moderate ties (85), Moderate and weak ties (103), Strong, moderate and weak ties (121), No neighbours (649). The strong and weak tie category (200) was omitted, as its results cannot be interpreted meaningfully. Conclusion: Stretching the concept of borrowed size'In its original conceptualisation by Alonso, the concept of borrowed size describes and explains the situation that especially smaller cities that are located in a larger megapolitan complex' do perform more favourably through access to agglomeration benefits offered by larger neighbouring cities. In this paper, we have scrutinised this concept to enhance its potential as a theoretical framework to study contemporary urban systems and to enhance its value as an emerging policy concept. Our review of existing literature and explorative analysis of borrowed size processes suggest that the borrowed size concept must be more carefully defined and needs to be stretched along several dimensions. These dimensions address the scope and scale of the concept and underscore the need for its redefinition. Borrowed Size: ScopeBoth the terms borrowed' and size' are imprecise. When coining the borrowed size concept, Alonso spoke of small cities exhibiting some of the characteristics of a nearby larger city. Hence, such characteristics can either refer to artefacts, activities or amenities (functions) typical of a larger city or to a performance level comparable to that of a larger city. So size' can refer to either the performance levels associated with larger size or the support base to achieve a functional profile commensurate with larger cities. Consequently, there are performance and functional dimensions of borrowing size (see Figure 5 that displays all theoretical possible outcomes). This is an important distinction that requires to be disentangled since their spatial distributions are likely very dissimilar, although they may occur together. As one city builds the support base of a nearby, linked city that consequently maintains a higher level of functionality not normally found in a city of its size (borrowed functions), the support lending city simultaneously has access to these functions and to other agglomeration benefits, allowing it to perform better (borrowed performance) than when positioned in isolation. However, it is likely that borrowed function often also implies borrowed performance, since amenity-rich places tend to grow faster. When both occur, we could label this genuinely as borrowed size'. Figure 5. Dimensions of borrowed size.
Concerning functional dimensions, Phelps (2004) mentions another important imprecision of the concept of borrowed size, when he criticises the concept of borrowed size for its indifference to the various types of agglomeration externalities. Depending on how mobile they are, externalities related to diversity of inputs and matching are more likely to be borrowed than for instance externalities evolving from knowledge spillovers. This corresponds to types of externalities that can be borrowed according to Polèse and Shearmur (2006), who reference high-order services and scale-sensitive institutions and infrastructure such as research labs, educational institutes, and airports, etc. Clearly, not all advantages associated with size can be borrowed an issue policy-makers should remain cognisant of. Related to this is the fact that size' does not just correspond to agglomeration benefits, but that costs are also associated with size, e.g., congestion, exposure to environmental pollution, crime, etc. This is clearly not what policy makers refer to when highlighting the benefits of size borrowing between cities. Borrowed Size: ScaleContrary to Alonso's original conceptualisation, there does not appear to be a compelling reason to reserve the borrowed size concept (functions, performance) for multicentric or polycentric regions, even though the dimensions of borrowed size manifest themselves most prominently in the latter regions. As we have shown, its occurrence strongly depends on processes of interaction. Currently, in a much more globalised world than in Alonso's time, interactions take place from metropolitan to global scales. However, different agglomeration externalities can be borrowed on various scales, and in particular urbanisation economies can be shared at the regional or metropolitan scales. Borrowed size is less a product of distance or access than it is of true interaction. Similarly, the borrowed size concept need not be limited to small cities. Our results show that not only small cities capitalise on agglomeration economies of larger nearby cities, but that the opposite frequently occurs as well. Rather, smaller cities help large cities maintain more metropolitan functions than they could originally support independently. Again, what is borrowed often varies, with larger cities more often borrowing functional benefits and with smaller ones typically borrowing in terms of performance. Taken together, we can now redefine the borrowed size concept as follows. Size borrowing occurs when a city exhibits urban functions and/or performance levels normally associated with larger cities as a product of interactions within networks of cities on multiple spatial scales that provides a substitute for the benefits of agglomeration. From Borrowed Size to City Network ExternalitiesAlthough the concept of borrowed size draws attention to the relational nature of external economies, the concept is at the same time focused on describing possible outcomes of interaction in city networks at the local level. The same holds true in the case of agglomeration shadows. However, urban functions and performance must also be measured at the system and city network levels. What is the aggregate of local outcomes at the network level in terms of functions and performance? The term city network externalities' (Capello, 2000; Boix and Trullen, 2007) appears to capture the essence of such network outcomes, as the term may refer to both positive (borrowed size dominating agglomeration shadows) and negative processes (dominating agglomeration shadows). It would appear that such positive city network externalities, in terms of functions and performance, are a more apt policy objective than just borrowed size, especially in policies addressing the regional scale. The Missing LinkFurther research must explore the issue of performance borrowing, as our empirical treatment of borrowed size focuses solely on function borrowing. Relationships between these two different but related size borrowing processes and their relationships with city network externalities must be determined. In addition, size-borrowing trends must be explored. As well, different agglomeration externalities that are borrowed or shared within networks at different spatial scales and the driving forces behind such processes demand our attention (see Phelps, 2004). As regards the latter, our explorations suggest general issues such as integration and network embeddedness, but a better understanding of the driving forces would require in-depth analysis of the potential of sorts of agglomeration externalities to spread over larger areas, as well as analysis of factors that influence a city's capacity to exploit integration and connectivity. The theoretical relevance of the borrowed size concept must not be underestimated. Current dynamics of European urban patterns, such as a lack of further urbanisation and the fact that large cities do not grow faster than small cities, nor contribute increasingly more to GDP (Turok and Mykhnenko, 2007; Dijkstra et al., 2013; Meijers et al., forthcoming), are in marked contrast with the bourgeoning literature stressing the importance of agglomeration for growth. This requires an explanation beyond conventional agglomeration theory that suggests that agglomeration benefits of large cities are the primary economic drivers worldwide. The borrowed size concept and corresponding counterpart agglomeration shadows and city network externality concepts offer elements of a theoretical framework that can explain the current discrepancy between theory and urban dynamics. The borrowed size concept does not dismiss underlying driving forces behind growth (agglomeration benefits), but instead suggests that agglomeration externalities may not be confined to the borders of agglomerations and may instead be shared throughout city networks. Hence, the borrowed size concept fundamentally challenges the geographical foundations of agglomeration theory an overlooked issue that demands our full attention. ACKNOWLEDGEMENTSThe authors would like to thank the Netherlands Organisation for Scientific Research and Platform31 for their financial support of this research. REFERENCESAlonso W (1973) Urban zero population growth, Daedalus , 109:191-206. BBSR (2011) Metropolitan Regions in Europe . BBSR-Online-Publikation, Nr. 01/2011. Bonn: Federal Institute for Research on Building, Urban Affairs and Spatial Development (BBSR). Boix R and Trullen J (2007) Knowledge, networks of cities and growth in regional urban systems, Papers in Regional Science 86:551-574. Brezzi M and Veneri P (2015) Assessing Polycentric Urban Systems in the OECD: Country, Regional and Metropolitan Perspectives. European Planning Studies, 23(6): 1128-1145. Burger MJ and Meijers EJ (2012) Form follows function? linking morphological and functional polycentricity, Urban Studies, 49(5):1127-1149. Burger MJ, Meijers EJ, Hoogerbrugge MM and Masip Tresserra J (2015) Borrowed Size, Agglomeration Shadows and Cultural Amenities in Western Europe, European Planning Studies, 23 (6): 1090-1109. Burger MJ, Meijers EJ and Van Oort FG (2014) Regional Spatial Structure and Retail Amenities in the Netherlands, Regional Studies, 48(12):1972-1992. Camagni R, Capello R and Caragliu A (2013) One or infinite optimal city sizes? in search of an equilibrium size for cities, Annals of Regional Science, 51 (2):309-341. Capello R (2000) The City Network Paradigm: Measuring Urban Network Externalities, Urban Studies 37(11):1925-1945. Dijkstra L, Garcilazo E and McCann P (2013) The economic performance of European cities and city regions: myths and realities, European Planning Studies , 21(3):334-354. Dobkins LH and Ioannides YM (2001) Spatial interactions among U.S. cities: 1900-1990, Regional Science and Urban Economics, 31 (6):701-731. Eaton J and Eckstein Z (1997) Cities and growth: Theory and evidence from France and Japan, Regional Science and Urban Economics, 27 (4-5):443-474. Erickcek GA and McKinney H (2006) "Small cities blues:" looking for growth factors in small and medium-sized cities, Economic Development Quarterly, 20 (3):232-258. Glaeser EL (2011) Triumph of the City. New York: Penguin Press. Groot SPT, De Groot HLF and Smit MJ (2014) Regional wage differences in the Netherlands: Micro evidence on agglomeration externalities, Journal of Regional Science, 54 (3):503-523. Henderson V (1997) Medium size cities, Regional Science and Urban Economics, 27 (6):583-612. Henderson V (2000) The effects of urban concentration on economic growth . NBER Working Paper Series 7503. Cambridge: National Bureau of Economic Research. Hepworth M (1992) Telecommunications and the future of London, Policy Studies , 13 (2):31-45. Hesse M (2014) On borrowed size, flawed urbanisation and emerging enclave spaces: The exceptional urbanism of Luxembourg, Luxembourg, European Urban and Regional Studies , Epub ahead of print 20 May 2014. Doi: 10.1177/0969776414528723. Hoffman RD and Killefer C (1975) So You Want To Move To The Suburbs: Policy Formulation and The Constitutionality of Municipal Growth-Restricting Plans, Hastings Constitutional Law Quarterly , 3 , 803 IGEAT e t alia (2007) ESPON 1.4.3 Study on Urban Functions . Project report. Brussels/Luxembourg: ULB/ESPON. Kesteloot C and De Maesschalck F (2001) Anti-urbanism in Flanders: the political and social consequences of a spatial class struggle strategy, Belgeo , 1(2):4163. Kloosterman RC and Musterd S (2001) The polycentric urban region: Towards a research agenda. Urban Studies, 38(4):623-633. Krugman P (1993) On the number and location of cities, European Economic Review , 37 (2):293-298. Meijers EJ and MJ Burger (2010) Spatial Structure and Productivity in U.S. Metropolitan Areas, Environment and Planning A , 42(6):1383-1402. Meijers EJ (2008) Summing small cities does not make a Large City: Polycentric urban regions and the provision of cultural, leisure and sports amenities, Urban Studies , 45(11):2323-2342. Meijers EJ, Hoekstra J, Leijten M, Louw E and Spaans M (2012) Connecting the periphery: Distributive effects of new infrastructure, Journal of Transport Geography, 22:187-198. Meijers EJ, Burger MJ and Hoogerbrugge MM (forthcoming) Borrowing Size in Networks of Cities: City Size, Network Connectivity and Metropolitan Functions in Europe. Paper forthcoming in Papers in Regional Science. Meijers EJ, Hoogerbrugge MM and Burger MJ (2015) Metropoolvorming en netwerkkracht. In: Van Oort F, Meijers EJ, Thissen M, Hoogerbrugge M and Burger M (eds) De Concurrentiepositie van Nederlandse Steden, van agglomeratiekracht naar netwerkkracht. The Hague: Platform31, pp. 123-142. Ministerie van de Vlaamse Gemeenschap (2012) Vlaanderen in 2050: Mensenmaat in een metropool? Groenboek. Brussel: Ministerie van de Vlaamse Gemeenschap. Nordregio et alia (2004) ESPON 1.1.1 Potentials for Polycentric Development in Europe . Final Report, Stockholm/Luxembourg: Nordregio/ESPON. OECD (2014) OECD Territorial Reviews Netherlands 2014 . Paris: OECD Publishing. Parr JB (2002) Agglomeration economies: Ambiguities and confusions, Environment and Planning A, 34 (4):717-731. Parr JB (2004) The polycentric urban region: A closer inspection, Regional Studies , 38(3):231-240. Partridge MD, Rickman DS, Ali K and Olfert MR (2008) Lost in space: Population growth in the american hinterlands and small cities, Journal of Economic Geography, 8 (6):727-757. Partridge MD, Rickman DS, Ali K and Olfert MR (2009) Do new economic geography agglomeration shadows underlie current population dynamics across the urban hierarchy? Papers in Regional Science, 88 (2):445-466. Partridge MD, Rickman DS, Ali K and Olfert MR (2010) Recent spatial growth dynamics in wages and housing costs: Proximity to urban production externalities and consumer amenities, Regional Science and Urban Economics, 40 (6):440-452. Phelps NA (1998) On the edge of something big: Edge-city economic development in Croydon, South London, Town Planning Review, 69(4):441-465. Phelps NA (2004) Clusters, dispersion and the spaces in between: For an economic geography of the banal, Urban Studies, 41 (5-6):971-989. Phelps NA, Fallon RJ and Williams CL (2001) Small firms, borrowed size and the urban-rural shift. Regional Studies, 35 (7):613-624. Polèse M and Shearmur R (2006) Growth and location of economic activity: The spatial dynamics of industries in Canada 1971-2001, Growth and Change, 37(3):362-395. RLI - Raad voor de leefomgeving en infrastructuur (2014) De toekomst van de stad . Den Haag: RLI. Sohn J (2012) Does city location determine urban population growth? The case of small and medium cities in Korea, Tijdschrift Voor Economische en Sociale Geografie, 103 (3):276-292. Turok I, Mykhnenko V (2007) The trajectories of European cities, 1960-2005, Cities , 24:165-182. Zonneveld W (2007) A Sea of Houses: Preserving Open Space in an Urbanised Country, Journal of Environmental Planning and Management , 50(5):657-675.
NOTES* Evert J. Meijers, Faculty of Architecture and the Built Environment, Delft University of Technology, email: e.j.meijers@tudelft.nl ** Martijn J. Burger, Department of Applied Economics and Erasmus Happiness Economics Research Organization, Erasmus University Rotterdam and Tinbergen Institute, email: mburger@ese.eur.nl 1. In the Netherlands, this concept can be found in a literal sense. In Flanders, the concept is translated as gedeelde potentie' and gedeelde voorzieningen'. 2. Please note that we exclude functions that are not strongly related to urban size such as tourism, capital city status and transport (airports are often located in smaller cities outside a large city; seaports are obviously only found at the coast). 3. The full list of polycentric metropolitan areas, as well as additional information on their identification, is provided in Meijers et al. (2015). 4. More specifically, we included here: (1) tourism index based on the presence of world heritage sites and obtained from BBSR (2011), (2) transport index based on the presence of airports and seaports as well as international railway connections, and (3) GDP per capita measured at the NUTS-3 level. 5. Adjusted R 2 is 0,800. Since, it can be argued that the residual derived from a regression only including size and country dummies may capture other aspects than borrowed size, we re-estimated our residuals by also including the transport index, and GDP per capita (see footnote 4). However, this yielded very similar conclusions as presented here. 6. We performed similar analyses with additional control variables (tourism index, transport index, GDP per capita) which yielded similar results. 7. Where a city was so small that less than zero metropolitan functions were expected, and such functions were not present, we changed the positive residual into a zero.
Note: This Research Bulletin has been published in Urban Studies |
|||||||||||||||||||||||||||||||||||||||||||||||||||||||||||||||||||||||||||||||||||||||||||||||||||||||||||||||||||||||||||||||||||||||||||||||||||||||||||||||||||||||||||||||||||||||||||||||||||||||||||||||||||||||||||||||||||||||||||||||||||||||||||||||||||||||||||||||||||||||||||