GaWC Research Bulletin 412 |
|
|
Cities of finance and cities of artsLondon, New York and Tokyo are not just top-tier global financial centers, they are also important global cities in terms of arts (Hall, 1998; Currid, 2006, 2007). There is nothing new under the sun here, as in the past, cities such as Genoa, Florence, Antwerp, and, for instance, Amsterdam were important locations for internationally operating banks as well as centers of arts and culture (Arrighi, 1994; Braudel, 1979; Israel, 1995; O’Brien, 2001; Prak, 2005). “Entrepôts are places for cultural encounters, for the exchange of ideas as well as goods and services” according to the historian Patrick O’Brien (2001: 23) when discussing the “Golden Ages” of Antwerp, Amsterdam, and London in early modern Europe. Peter Hall (2001: 62-64) has also pointed at the “symbiotic relationship” between more mundane economic activities and arts: “These activities prove to be highly symbiotic: thus business travelers who may also use cultural facilities; urban tourism and culture are mutually supportive. The fact that London is the first international airport system in traffic reflects the fact that it is simultaneously a major business center, and a major business center, and a major cultural center, and a major tourist center, and all these are synergistic; likewise with competitor cities like Paris, Amsterdam, or Rome.” The relationship between being an international financial center and one for arts has been observed many times and, however, to a much lesser extent, actually empirically studied. Moreover, it has been mainly investigated for top-tier cities and, in addition, often on the basis of just single cases. Below, we will investigate this relationship by comparing rankings of global financial centers and global arts centers. Bringing such a comparative perspective to the research on financial and arts centers enables us to go beyond the usual suspects of the top-tier of global cities. We can, then, explore if this relationship is limited to just the top-tier global cities or if it also holds for cities further down in the global urban hierarchy. In addition, by widening the net and including a larger number of cities, we will also be able to assess if the rapidly increasing importance of Asian cities as financial centers is also linked to an ascendance as centers of arts. The relevance of financial services for contemporary cities in general and global cities more in particular has been amply theorized and documented (Derudder et al., 2012a; Derudder et al., 2012b; Engelen, 2007, 2012; Friedmann, 1986; Sassen, 1991/2001; Taylor, 2012a). Financial services are seen as a key element in the infrastructure of producer services which are, in their turn, vital to organize, control, monitor, enable, sustain, and extend cross-border economic activities and, thus, part and parcel of complex and pervasive processes of globalization. As these high-end financial are dependent on a large and deep pool of highly-skilled specialized workers, an advanced infrastructure of ICT and transport facilities (well-connected international airport), and the ability to engage frequently and promptly in face-to-face contacts with either clients or suppliers, they are not only strongly concentrated in cities, but more precisely in a relative small number of world or global cities which form the “highly concentrated command points in the organization of the world economy” (Sassen, 1991: 3). The role of financial services in a city on a global scale, then, can be seen as an indicator or proxy of the importance of that city in the global economy. Consequently, rankings of cities according to their global financial prominence have, in principle, a wider significance and reflect the global urban hierarchy in terms of economic power and importance (Hall, 2001: 60). The significance of arts for cities is, at first glance, less straightforward and in addition, more difficult to assess than that of financial services. Apart from having an intrinsic value, “… arts and culture can contribute to to urban life and to the economic development of towns and cities in a number of ways” (Throsby, 2010: 131). First, arts may create employment opportunities and contribute directly to economic development by attracting visitors from nearby and from afar. Second, a lively artistic milieu may contribute to the quality of place and help to attract knowledge workers, firms and inward investment to city (Evans, 2009; Florida, 2002; Kloosterman and Trip, 2011). Third, arts may help to brand a city and enhance its cultural identity (Mommaas, 2004). This branding may transcend the local or national level, as the images of New York and London as global capitals of arts attest. Arts, then, in a rather different and more elusive way are also be important for cities and may contribute to determine their standing and position within the global urban system. Below, we want to explore the relationship between contemporary Global Financial Centers or GFC and Global Arts Centers or GAC. Are financial entrepôts still places for cultural encounters? Do global cities indeed not just “… disproportionately attract[s] the organizations that command and control the new global economy, as well as the specialist service agencies that minister to them”, but do they continue “to attract the talented and the ambitious; and, just because of that,… remains unique crucible[s] of creativity” (Hall (1998: 7)? Does, then, the symbiotic relationship between international financial prowess and ditto prominence in arts in cities still hold in an era of intensified globalization? Is the line-up of arts centers the same as that of the usual suspects when it comes to financial centers with New York, London, and Tokyo on top (Sassen, 1999/2001)? Do we now also see the emergence of the up- and coming East Asian global financial centers as Singapore, Hong Kong, and Shanghai as global centers of arts? Or can we observe different patterns indicating other factors at play whereby cities can be prominent in arts but not necessarily in financial activities? Is there still room for specialized cultural centers with a global reach without being a command post of global capitalism? To explore these questions, we will compare a ranking of Global Financial Centers with a ranking of Global Arts Centers. For the ranking of GFC we make use of the Global Financial Center Index constructed by the Z/Yen Group, a London-based think tank and research house, which regularly lists the world’s top financial centers (Z/Yen Group, 2011). There are no existing rankings of Global Arts Centers so for this purpose we had to build a large database with “art events” to be able to construct a ranking of cities according to their prominence-global and local-in arts. “Arts events”, then, encompass international performing arts events, international visual arts events, local performing arts events, and local visual arts events. We, hence, focus on cultural services which have to be consumed on the spot (Scott, 2004) and not on cultural goods which can be exported and consumed elsewhere. Opting for a narrower set of activities than the more often used cultural industries, we are much better able to zoom in on “arts” and leave out activities for which the connection with arts is much more debatable such as advertising or fashion design. We then compare our ranking of Global Arts Centers with that of the Global Financial Centers to address the relationship between arts and finance on a global city level. We begin with a brief, more general analysis of the potential causal relationships between financial activities and cultural activities (section 2). This is followed by a methodological discussion of how the ranking of Global Arts Centers has been constructed (section 3). We then present the actual ranking of Global Arts Centers, which indeed shows a clear dominance by New York and London but, surprisingly, also Berlin as the three highest-ranking cities, but perhaps even more surprising we can observe the importance of (Central) European cites as global (and local) arts centers (section 4 and 5). After that, we compare our Global Arts Centers ranking with the Global Financial Centers ranking of the Z/Yen Group showing partly a clear overlap but also quite significant differences (section 6 and 7). We conclude by suggesting which in particular local and path-dependent factors may be important in explaining these patterns (section 8). The relationship between Global Financial Centers and Global Arts CentersAccording to Andy Pratt (2012: 266) “Culture and the city, especially the global city, are close companions.” Peter Hall (2001: 61), made the same point some years earlier when he distinguished four clusters of advanced services characterizing high-level global cities, namely command and control functions, financial and businesses services, tourism of both the leisure and business varieties and, explicitly, cultural and creative industries which “include live performing arts, museums and galleries, and the print and electronic media.” Notwithstanding, these and other observations on the close relationship between being a Global Financial Center and a Global Arts Center, there is much uncertainty about the nature of this. The causal linkages between financial activities and arts in a city can be complex and manifold and the direction of the causality is hard to determine in advance (Pratt, 2012: 266). Before these multifaceted causal relationships can be investigated in depth, we first need a broader picture based on empirical research to be able to select the more relevant hypotheses regarding the linkages between arts and economic prominence. High-ranking financial centers and prominent arts centers may both thrive because of the same underlying factors. The first set of factors are urbanization economies-agglomeration economies related to city size and pertaining, in principle, to all economic activities. A large city will have a ditto large critical mass of potential customers and this will contribute to a finely grained division of labor (Glaeser, 2011; Jacobs, 1969). It will also tend to have a well-developed infrastructural for transport and communication, and, typically, an openness to creativity and newcomers which will benefit both financial services and arts (Florida, 2002; Hall, 1998; O’Brien, 2001). Arts can also be seen as directly dependent on the set of economic activities that comes with being a global city. The income generated in the high-end services just listed generates demand for arts as highly skilled workers in these services have both the financial and cultural capital to enjoy arts. In addition, firms in the advanced services might also be liable to act as patrons of the arts and sponsor arts events. The causal relationship may also going the other way instead with arts as an independent variable contributing to the quality of place and attracting high-skilled workers (Evans, 2009; Florida, 2002; Glaeser, 2011). Whatever the exact causal relationship may be, in all these cases we would expect a positive relationship and, hence, a strong overlap between the ranking of GFC and that of GAC. Although there are strong analytical and empirical (albeit mostly based on single-case studies) reasons to assume a positive relationship between being a GFC and a GAC, this-given the complexity and the indeterminacy of the causal relationship-does not have to imply that this will hold in all cases. We might even find the threat of a negative relationship in some cases as arts can be crowded out as an expansion of financial services might drive up rents and drive out arts and cultural activities (e.g. New York, cf. Currid, 2007). It may also be the case that certain cities either specialize in arts or in financial activities and which are, then, to a high extent independent of each other. Arts may be more or less autonomous vis-à-vis financial services and other advanced services determining the relative economic position of a city in the global urban system. They may be rooted in local educational institutions (cf. art schools), dedicated infrastructures (venues, art fairs), localized consumer cultures anchored in local traditions which are reproduced over time along path-dependent lines (e.g. local festivals), or (national or local) public policies targeted at arts (Evans, 2009; Scott, 2000; Throsby, 2010). Especially in Europe, we find examples of this as many European nations “…are now aggressively playing the cultural economy card as a way of promoting local business and job growth. They are doing this by building new cultural facilities and promoting local cultural events, thereby increasing employment directly (via the creation of new jobs) and indirectly (by making the local area more attractive to investors from outside) (Scott, 2000: 210). Below, we will investigate the relationship between GFC and GAC on the basis of two rankings of cities. Is there a one-to-one relationship between economic power and prominence in terms of arts? Do we find strongly overlapping hierarchies of GFC and GAC? Are, then, upcoming Asian GFC also emerging as GAC? Or do we discern a much more complex global mosaic of cities with GFC which are not GAC and the other way around as well suggesting a much looser relationship and a more autonomous role for either advanced financial services or of arts? If global financial and economic prominence are not invariably linked to global artistic importance and smaller, less important cities in economic terms may thrive as centers of arts and culture as Allen Scott states (2000: 209), where are they located? And what would account for these patterns? Before we can address these questions, we first have to explain the construction of the ranking of GAC. MethodologyDefinitionIn this study, we define Global Arts Centers or GAC as cities characterized by thriving arts scenes. We follow the United Nations definition of arts (UNCTAD, 2008; UNCTAD, 2010), whereby arts are defined as a group of creative industries comprising:
Global Arts Centers are, then, those cities which frequently host gallery exhibitions, theatre and dance performances, live music concerts and other forms of arts included in the above scope. GAC, accordingly, can be seen as vibrant, inspiring and entertaining locations, where arts are widely presented and consumed. In addition to having thriving local arts scenes, these cities are also host to many large-scale international arts festivals making them influential centers of arts beyond their countries’ borders. They are seen as an inspiring urban environment with a high quality of place, conducive to creativity and innovation, which enriches lives of their residents and attracts foreign talent (Evans, 2009; Florida, 2002; Hall, 1998; Throsby, 2010; Zukin, 1995). They are, to put it succinctly “livable, investible and visitable” cities popular among residents, workers, firms and tourists (Kotler et al, 1993: 2). Global Arts Centers are thus valued for both socio-cultural and economic reasons. Selection of CitiesIn order to select the cities to be included in our ranking, we trace the locations of top international arts events. We look at major international performing arts festivals such as the Edinburgh Festival Fringe, the Sziget Festival, the Dance Umbrella Festival and major international visual art fairs, such as the Art Basel, the Art Forum Berlin, and, for instance, the Armory Show and subsequently check where they take place. For each event, a city gets one point. That leaves us with a list of some 200 cities all over the world hosting between 1 and 87 international arts events in the period analyzed. For our ranking, we select those cities that host a minimum of five events (i.e. have a significant international arts presence). This threshold narrows it down to in total 36 cities. Grading the CitiesIn order to assess which of the 36 cities have the most vibrant arts scene, we grade them across four indicators:
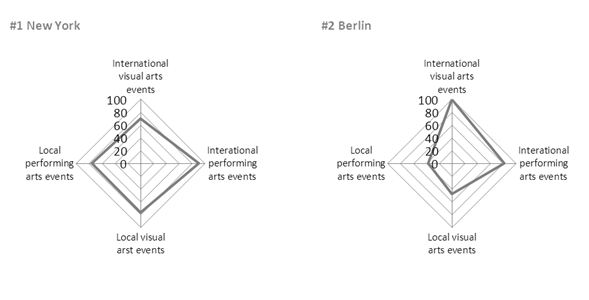
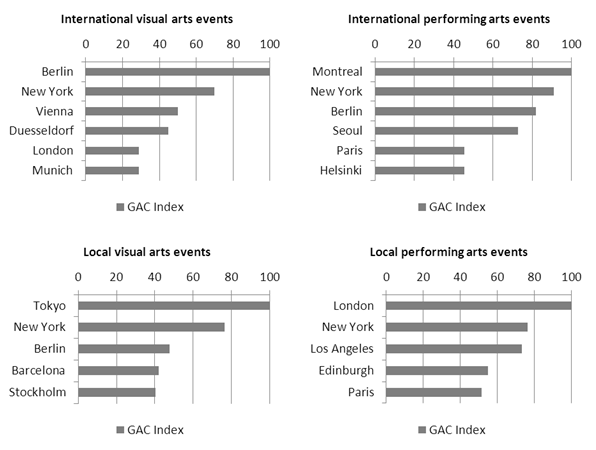
We define international arts events as those events that are attended largely by an international audience and international artists, as opposed to the local arts events, which attract mainly a local audience and artists. So, for example, the Edinburgh Festival Fringe, which takes place once a year in August in Scotland, is an international arts event, as it showcases the work of artists of over 60 nations and a significant proportion of its viewers come from abroad to see it. In contrast, a regular Tuesday night comedy show in a theatre in Amsterdam featuring Dutch stand-up comedians and gathering mainly local audience qualifies as a local arts event. x = (x – Min(x)) / (Max (x) – Min (x)), where Min(x) and Max(x) are, respectively, the lowest and the highest scores for each given indicator. The normalized value is then transformed into a positive number on a scale 0-100. That way, a city scoring highest for any given indicator receives a score of 100 and the city scoring lowest – 0. We then aggregate the values across all four indicators into a single Global Arts City Index (GAC Index). Ultimately, we obtain Global Arts Centers Ranking, including 36 cities, each scoring minimum 0 and maximum 400 on GAC Index. Data Gathering and SourcesWe gathered data in the period January 2011-December 2011. For two indicators: (1) international performing arts events and (2) international visual arts events, our data encompasses major events taking place in 2010 and 2011. For two further indicators (3) local performing arts events and (4) local visual arts events, we gather data during two selected weeks of 2011 – one week in May (‘summer week’) and one week in November (‘winter week’). We subsequently aggregate the scores and calculate an average number of events per week for, respectively, performing arts and visual arts. Missing Data, Data Limitations and InterpretationFor seven cities: Avignon, Barcelona, Bogota, Edinburgh, Hamburg, Santa Monica and Stockholm, data regarding the number of local arts events in the selected ‘summer week’ is missing2. For those cities, we use respective scores in the ‘winter week’ as an indicator of local visual arts events and local performing arts events (as opposed to the rest of the cities, in which case we calculate the average of the ‘summer week’ and ‘winter week’3). While data regarding arts events in major Western European and American cities is quite extensive and easily accessible from official city websites or websites dedicated to culture/arts, data for cities in other parts of the world is often more difficult to retrieve. Cities such as Havana, Nuremberg, or Avignon often lack websites listing culture/arts events on a weekly basis. In those cases, we refer to individual webpages of each theatre, gallery etc. in town and then aggregate the numbers4. Similarly, for many cities (e.g. Bogota, Beijing, or Damascus) English-language websites listing weekly arts events do not exist. Some cities, Seoul for instance, do have an English-language cultural agenda, but it contains events targeted rather exclusively at an expat audience than the entire local population. In those cases we consult Spanish, Chinese, Arabic, and Korean native-speakers and search for data in the respective local languages5. Additionally, data limitations exist in case of certain subgenres of arts. Websites of several locations in principle do not provide data on certain forms of arts. For instance, circus or mask dance are both, according to our definition, subgenres of arts and as such those events should be included in our dataset. However, while a Beijing culture website would report those events quite thoroughly (because both mask dance and circus are popular arts forms in China), a Munich website might not do so at all. Those events might actually take place in Munich in the period analyzed, but simply because they may not be considered arts in Germany, they may not be included in culture/arts calendars6. Lastly, there are certain limitations of the samples we are using. Namely, we conclude on yearly local arts events vibrancy (52 weeks) based on selected 2 weeks in a year, one week in summer and one week in winter. This is a limited sample and the selection of weeks is inevitably arbitrary7. We cover over 10,000 local visual arts events and more than 10,000 local performing arts events taking place in 36 selected cities. These are relatively high numbers and the differences between cities are huge (e.g. while some of the bottom cities, such as Düsseldorf host less than a 100 local arts events per week, some of the top ones, such as New York City are home to over 2,600. However, it is still clear that the cities might have scored differently, had other weeks been selected. We do not expect that the distribution of cities across the ranking would change drastically (i.e. it is highly unlikely that high-scoring cities such as London, would end up in the middle or at the bottom of the ranking), but more subtle changes (for instance between city #22 and city #24) are possible. Global Financial Centers DataWhile there exists a plethora of urban rankings, few of them grade cities based on their financial activity exclusively. Some focus on advance producer services and measure the combined performance in accountancy, advertising, banking and legal services (Beaverstock et al, 1999), other focus on overall economic performance and measure total GDP or per capita GDP (PricewaterhouseCoopers, 2009), yet others concentrate on even broader notions of competitiveness, global presence, or importance of cities (A. T. Kearney, 2010; The Economist, 2012; Florida, 2011; The Mori Memorial Foundation, 2009). Out of those that measure financial activity exclusively, only few are relatively recent. Pioneering work in this field has been done by Howard Reed (1981), followed by analysis by The Economist (1998) and Saskia Sassen (1999). In our comparison of Global Arts Centers and Global Financial Centers, we refer to the Global Financial Centers prepared by Z/Yen Group (2011). This London-based think tank looks at cities based specifically on their financial performance and grades the cities regularly, which allows us to use comparable to GAC data. We select top 36 cities from September 2011 Global Financial Centers Index and compare them with 36 Global Arts Centers. The GAC Ranking: who runs the arts world?New York City, in line with its image (“Start spreading the news, I’m leaving today, I want to be a part of it, New York, New York”, as Frank Sinatra used to sing) has been at or very close to the top of almost every city ranking. Unsurprisingly, “The city that never sleeps” takes the #1 spot in our Global Arts Centers (GAC) ranking as well (A.T. Kearney, 2010; Beaverstock et al, 1999;, The Economist, 2012; Sassen, 1991; Watson, 2012). Our sources show that New York hosts over 1,600 exhibitions and 1,000 theatre plays, live music, dance, opera etc. performances on an average week. That, supplemented with numerous performing arts festivals – such as BAM Next Wave Festival – and international art fairs – such as The Armory Show – gives it a clear leading position. Notably, no other city in our ranking is as consistent as New York – it ranks equally high on every indicator analyzed: international visual arts events, international performing arts events, local visual arts events and local performing arts events (Figure 1.). Much more surprising is the runner-up: Berlin. Famous for its cutting-edge underground arts scene and its unique raw character which attract young and restless talent, the Eastern-European capital shows a remarkably strong international presence in terms of arts. It hosted 87 international arts events in the period analyzed, including ABC Art Berlin Contemporary, Popkomm and JazzFest Berlin – that is more than any other city in our ranking and over 30 per cent more than the Big Apple. As far as its local vibrance is concerned, Berlin scores significantly lower than New York – it hosts around 1,000 local visual arts events and around 500 local performing arts events per week. However, if we corrected the data for the population size of both cities8, and calculated the number of local arts events per citizen in both metropolises, we would see that Berlin would be 30 per cent more vibrant than NY in terms of performing arts and 50 per cent more in terms of visual arts. David Bowie’s description of Berlin , who recorded his seminal albums Low and Heroes there, as "the greatest cultural extravaganza that one could imagine” thus seems to be corroborated (Expatica, 2006). New York and Berlin are followed by London and Tokyo. Both owe its position in our ranking to an exceptionally high score on one dimension, while performing a lot worse on three others. London is #1 in terms of local performing arts events. It hosts more theatre, dance, live music, opera, circus etc. performances on an average week than any other city in our ranking – over 1,300. Tokyo leaves other cities in the dust as far as local visual arts events are concerned. It is home to National Museum of Modern Art and the Mori Art Museum, as well as plethora of smaller Japanese galleries. “From venerable buildings that have survived earthquakes and bombings to the boutique art houses where every inch of wall is a potential display space, Tokyo is a haven for art lovers in search of something a little different” (Powell, 2010). Figure 1: Profiles of #1 and #2 Global Arts Centers.
Paris occupies #5 place. Home to legendary venues from the Louvre Museum to the Moulin Rouge, Paris is particularly strong in performing arts – it ranks 5# in local performing arts events and #5 in international performing arts events. Additionally, its visual arts scene, with such events as Art Paris (which brings together 120 international galleries under the majestic glass dome of the Grand Palais) suggests that the city’s reputation for an thriving, enchanting arts scene is perfectly deserved. Montreal follows at #6 place. While scoring relatively poor on other dimensions, the capital of French Canada excels in international performing arts – its score in this category exceeds those of all other cities. Vienna (#7), once home to a string of brilliant composers comprising Mozart, Beethoven, Schubert, Strauss, and Mahler scores, as expected, high in local theatre, opera, ballet, live music etc. performances , but our data reveal that it is even stronger in international visual arts events. Edinburgh, renowned for two major league international performing arts events – Edinburgh Fringe Festival and Edinburgh International Festival – takes the #8 spot. Los Angeles and San Francisco close the top-10. Los Angeles does particularly well in local performing arts, especially live music, while San Francisco enjoys a relatively stronger international presence. Together with New York they constitute the “Big Three” – three pre-eminent centers of artistic activity in the United States (Markussen and Schrock, 2006). Figure 2: Top 5 Global Arts Centers in each category.
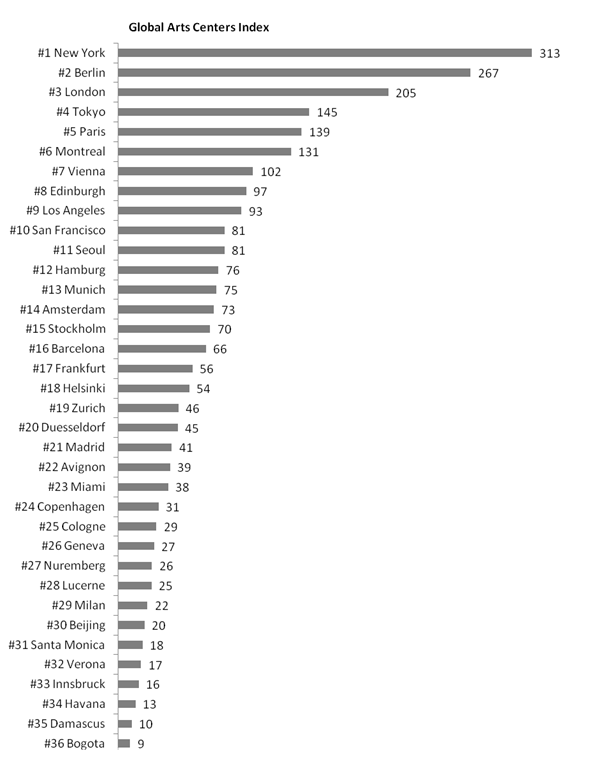
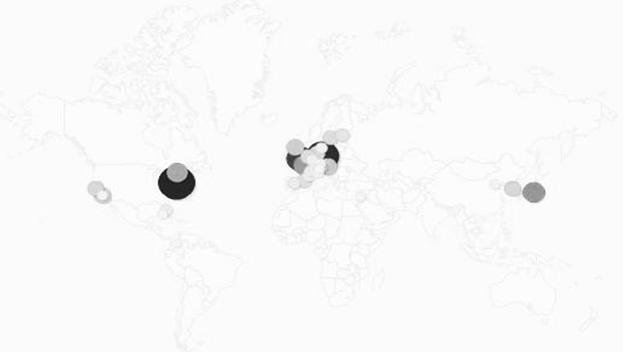
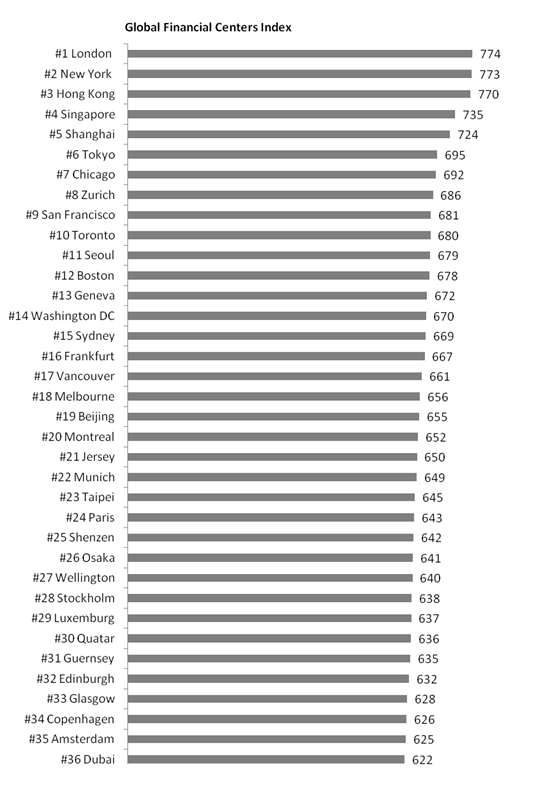
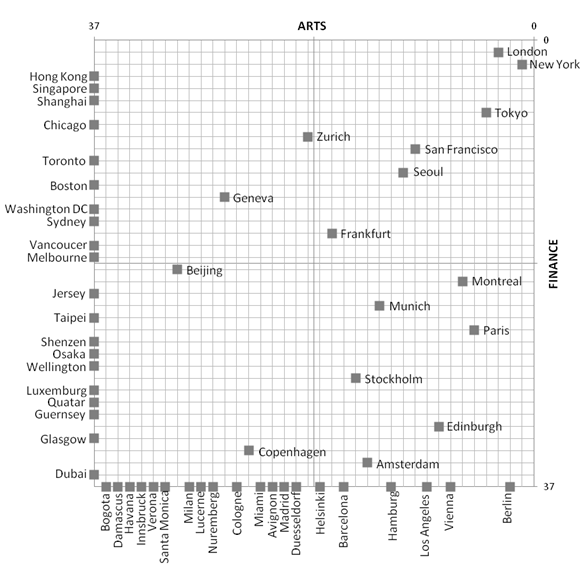
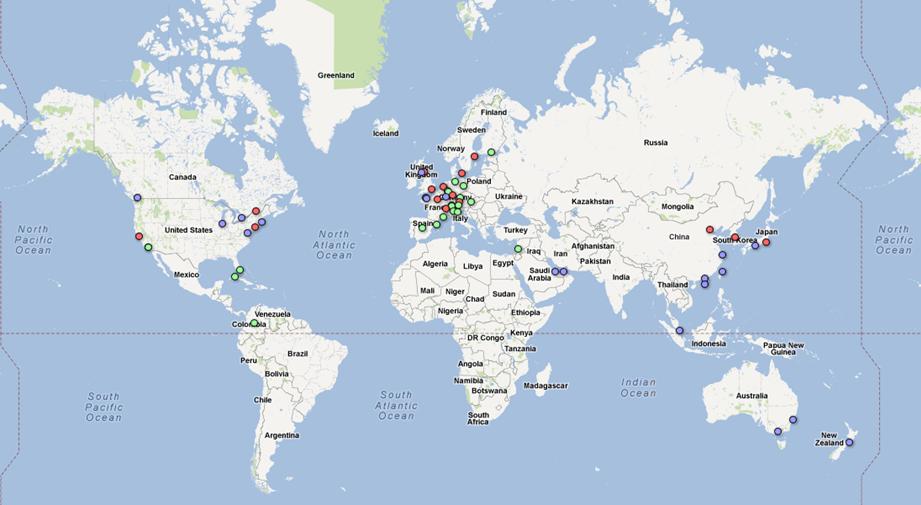
Importantly, there are huge gaps between the top cities and the rest of the ranking. Only three cities – New York, Berlin, and London – have such vibrant arts scenes that their scores are – respectively – six, five and four times higher than the median result in our ranking. Furthermore, only those three leaders score in the top registers of the Global Arts Centers Index (from 200 to 400 points), leaving the rest of the world far behind, as 90 per cent of cities end up within (0-200) range. The top three players outperform the rest of the world by a large margin, as the next city, Tokyo, lags 60 points behind – that is more than the overall score of half of cities in our ranking. But huge gaps are visible also between the leading players themselves. New York is a clear #1, as it beats #2 Berlin by as much as 42 points on Global Arts Centers Ranking. Berlin is an unthreatened runner-up, as London lags 62 points behind the reinstated German capital, the largest gap in our ranking. Stratification continues, as the next three cities – Tokyo, Paris and Montreal – while close to each other, are also far from the rest. Additionally, two cities in our ranking, Los Angeles and Santa Monica, are very closely situated (around 16 miles away). If treated as one, they would rank #7 in the world, just behind Montreal. This points to a dominance of just a few locations which “run the arts world”. Figure 3: Global Arts Centers Ranking, 2010-2011. Geography of Global Arts Centers: America, Europe or Asia?Our data show that cities with the most thriving arts scenes are located predominantly in (Western) Europe, North America and East Asia. Only 2 out of 36 cities are located elsewhere (Figure 4.). The distribution of cities between these three regions is relatively even in the top ranks of the hierarchy. Berlin (#2), London (#3), Paris (#5), Vienna (#7) and Edinburgh (#8) represent Europe; whereas New York (#1), Montreal (#6), Los Angeles (#9) and San Francisco (#10) do so for North America, and Tokyo (#4) and Seoul (#11) for East Asia. Yet a closer look at the rest of the ranking allows us to see a clear concentration of GAC in Europe. Ranks #12-#29 are all taken by European cities. Europe is, in addition, home to two thirds (69 per cent) of all cities in our ranking – a quite strong dominance, especially if compared to the share of 14 per cent of North America and merely 8 per cent of East Asia. This supremacy might be the result of a path-dependent development building on a foundation of an urban arts tradition in Europe (Sassoon, 2006). Whereas the map of Europe seems to be dotted with Global Arts Centers, other regions remain blank on the map. According to our data, in , the emerging giants of global economy known as the BRIC countries there are almost no Global Arts Centers according to our definition. Brazil does not have such a city, neither does Russia, nor India. Only China has one, scoring only one point with Beijing – 30#, as Shanghai did not host a sufficient number of international arts events to qualify for the top 36. The Middle East does not enjoy a strong presence either. Dubai, with its grand investment schemes, ambitious strategies and thousands of people flocking to it, does not appear on our ranking. The same can be said for Abu Dhabi, which invests somewhere around €100 in Saadiyat Island, a cultural center comprising Louvre and Guggenheim museums but still does not make it to the top 36. Instead, we see Damascus (#35) as one of Global Arts Centers. This ancient capital of Syria, once the capital of the Umayyad Caliphate from 661 to 750 but losing ground afterwards while maintaining a certain cultural prestige (Westmoreland, 2002), might not benefit from cash flows in any way comparable to those of the two above mentioned cities, but it did manage to create a world-class contemporary art scene that leaves visitors in awe and disbelief. As one of the foreign arts lovers put it when visiting a Damascene gallery: “This could be London or New York or Paris” (Sherwood, 2010). Figure 4: Map of Global Arts Centers. Global Arts Centers vs. Global Financial Centers: two sides of the same coin?The world of finance is a wide-reaching, global network of interconnected capital markets with only few cities on top as truly global financial centers (Sassen, 1991/2001; Taylor, 2005). while the rest are rather international, specialist (niche), national and regional financial hubs. London and New York, offering top-notch financial executives, some of the best business education in the world, flexible labor market, economic freedom, excellent legal, banking and financial institutions and favorable tax and regulatory environment, carry the highest volume and value of financial transactions in the world and have taken #1 and #2 spot (interchangeably) in Global Financial Centers ranking (Z/Yen Group, 2011) for several years in a row now. Hong Kong with its special administrative status, low taxes, historical affiliation with the western world as well as expertise and proximity to Asian markets follows at #3. Since it has recently closed the gap separating it from New York and London, it is now not only a clear #1 Asian financial hub, but also a truly global financial center. Somewhat lower in the ranking, we see other high-flying Asian locations, namely Singapore, Shanghai, and Tokyo, which take the places #4, #5 and #6, respectively. Chicago, famous for its Chicago Board of Trade –the world's oldest futures and options exchange – lands at the #7 place. Rich in banking traditions Zurich takes the #8 place, followed by the “Wall Street of the West”, San Francisco. Lastly, Toronto, home to the world’s seventh-largest stock exchange by market capitalization (WFE, 2011), closes the top 10 (Figure 5.). Figure 5: Global Financial Centers Index, 2011. Source: Z/Yen Group, 2011. Already comparing the top 10 of Global Arts Centers and Global Financial Centers, we can note significant differences between the world of finance and the world of arts. In fact, only less than half of the cities overlap – 16 of all Global Arts Centers are at the same time world’s major hubs of finance, while the remaining 20 are arts centers but not global financial centers. London, New York and Tokyo, predictably, fly high in both rankings – London ranks as #1 in finance and #3 in arts, New York - #2 in finance and #1 in arts and Tokyo scores 6# and #4, respectively. Lower down the ranking, we find more cities which are global centers of finance as well as of arts. Vibrant artistic metropolises as San Francisco, Montreal, Paris and Edinburgh appear on both rankings. Affluent Swiss and German cities, such as Zurich, Geneva, Frankfurt, and Munich, which can boast thriving arts scenes, in particular in terms of painting, sculpture and other visual arts, are capitals of capital as well. However, the majority of cities on the two rankings do not show this overlap. Most notably, the #2 Global Arts Center – Berlin – is not a major financial center at all. Neither is artistically flourishing Vienna (#7 in arts). Lively Los Angeles, which is in the top 10 in arts terms, and would even climb to a high #7 position if supplemented by Santa Monica, is not on the list of Global Financial Centers. Neither are such European capitals of arts as Hamburg, Barcelona or Helsinki – all in the top half of the arts ranking, but not to be found among all 36 Global Financial Centers. A 44 per cent overlap between the Global Arts Centers and Global Financial Centers indicates at the same time, that there are certain cities that are financial centers, but not arts centers. Already at the very top of the financial ranking we see three cities that are world-class financial hubs, but do not appear anywhere in the arts ranking, namely Honk Kong – #3, Singapore – #4, and Shanghai – #5. The latter confirming that, as far as mainland-China metropolises are concerned, Beijing is the traditionally artistic one, and Shanghai the business one. Further, such North American economic and financial urban centers as Chicago, Toronto, Boston and Washington DC might be very vibrant locally, but did not meet the “significant international arts presence” criterion and therefore did not classify as Global Arts Centers. Certain cities like Guernsey and Jersey appear in Global Financial Centers ranking as offshore GFC – specialized small, low-tax havens which provide corporate and commercial services to mainly non-resident companies. They are certainly considerable financial hubs because of low taxes and light-touch regulation but apart from that rather small economies with relatively small population and an arts scene that does not compare to the one of Global Arts Centers. Mapping GAC and GFC: where worlds collideOur data show that Global Arts Centers do indeed overlap strongly with Global Financial Centers and thus are to be found mainly in (North-Western) Europe, North America and East Asia. This comes as no surpirise – the three regions are well established arenas of globalisation, so they will most likely appear on a map showing any major city ranking. There are, however, also marked differences between the geography of Global Arts Centers and that of Global Financial Centers. First, Global Financial centers are spread out further South than Global Arts Centers, covering South-East Asia (Singapore) and Oceania (Sydney, Melbourne and Wellington). A closer look at the distribution of cities between the regions reveals further differences between the world map of arts and the world map of finance. While GAC are clearly concentrated in Europe (69 per cent of all), GFC are distributed more evenly across the world. Still most of them are on the old continent (39 per cent), but the gap is definitely smaller, as North America is home to 22 per cent of all GFC and East Asia – 22 per cent. If we take into account the entire Pacific Asia (roughly: East Asia + South-East Asia + Oceania), the shares would amount to 39 per cent for Europe, 33 per cent for Pacific Asia, and 22 per cent forNorth America. This, again, emphasises the large differences between geographies of finance and geographies of arts. Interestingly, in Pacific Asia there is not a single city that appears on the GAC ranking but not on the GFC one – all of them are major financial centers. The rapid rise of Pacific Asia as an economic powerhouse is evidently mirrored in the presence of strong GFC, but its global cultural profile still seems relatively modest. The Americas show an equal mix of GAC and GFC, with nothern cities are visibly more prominent in financial activities, while southern citiesare more outspoken arts centers with Los Angeles, Santa Monica, Miami, Havana and Bogota, being arts centers but not financial centers. As far as the Middle East is concerned, both Dubai and Quatar appear in the financial ranking, while flourishing center of contemporary art – Damascus – is nowhere on the list of financial centers. A more general observation is that the overlap between Global Arts Centers and Global Financial Centers is higher in the top ranks of the hierarchy and lower in its bottom registers. Out of the GAC that are at the same time GFC, 75 per cent are in the top half of our ranking, i.e. are in ranks 1-18 in Global Arts Centers hierarchy. In other words, the higher the position of a city in GAC ranking, the greater its chances to be a GFC as well – only four cities of the bottom half of the arts ranking are at the same time GFC. Urbanization economies should, in principle, benefit both financial services and arts, so the overlap at the top of both rankings is not unexpected. The fact that further down the hierarchy this relationship seems to be breaking down is rather more surprising. Localization economies, agglomeration economies which benefit only a particular set of economic activities, seem to be relevant and creating opportunities for smaller cities. All in all, even though we recognize a certain overlap between the Global Arts Centers and Global Financial Centers, we see it as not sufficient to conclude that the world of finance shapes the world of arts. There is no straightforward relationship between being a Global Financial Center and a Global Arts Center. A 44 per cent overlap and a similar geographic pattern suggests that surely there are certain factors pivotal for development of Global Financial Centers that will be important for creating a thriving arts scene, Global Arts Centers, as well. We expect some factors such as urban population or the overall economic performance to be conducive to both a thriving financial sector and a flourishing arts scene. However, we see this as not sufficient to prove that a financial activity would actually drive cities’ arts activity, especially considering that some cities with an excellent performance as a financial center– i.e. Hong Kong, Singapore, and Shanghai – are still not appearing on our radar of Global Arts Centers. And vice versa, some of the most artistically exciting cities – Berlin, Vienna and Los Angeles are apparently driven by factors not directly related to financial services. They are exploiting other sources to thrive as Global Arts Centers. Below, we will suggest some of these sources. Figure 6: Overlap between Global Arts Centers and Global Financial Centers by rank.
Figure 7: Geographic overlap between Global Arts Centers and Global Financial Centers.
ConclusionsOur aim was to explore the relationship between a city’s position in the global urban hierarchy of financial centers and that of global arts centers. For the ranking of Global Financial Centers or GFC, we could rely on an existing ranking created by the Z/Yen Group. For the Global Arts Centers or GAC, a totally new ranking had to be constructed by trawling the web and looking for data on arts activities catering to an international audience encompassing (1) visual arts: paintings, sculptures, photography and antiques exhibitions; and (2) performing arts: live music, theatre, dance, opera, circus, and puppetry. We expected that there would be an overlap between contemporary GFC and GAC, both on the basis of historical evidence and of the impact of urbanization economies. History shows that cities which functioned as global financial entrepôts tended to be centers of arts as well. Pre-industrial Florence, Genoa, Antwerp, Amsterdam, and 19th century London are cases in point (Arrighi, 1994). Given in large cities, urbanization economies will benefit all kinds of activities (Glaeser, 2011) including arts, it would also be highly likely that large, rich cities would be both centers of finance and centers of art. However, we did not expect that the relationship would be iron-clad. Allen Scott in The Cultural Economy of Cities while acknowledging the powerful role of the urbanization economies which enable large cities to assume important roles as centers of arts and cultural production, already hypothesized that other, smaller centers as “… Toronto, Montreal, Barcelona, Amsterdam, Seoul, Hong Kong, Rio de Janeiro, and so on, are also foci of important cultural production activities, and are now at a point in their development where they may well rapidly come to compete effectively with the top-ranked cities” (Scott, 2000: 209). Furthermore, in particular against the backdrop of the rapid rise of East-Asian cities to global financial prominence, there may be time lags between the emergence as a GFC and the development of a thriving international arts scene. Comparing the two rankings, we find that there actually is an overlap but this is anything but straightforward. The top dogs New York, London, Paris, and Tokyo are indeed high on both rankings, but there quite a few cities which are financial centers but not centers of art and the other way around as well. We also found that European, North-American and East-Asian cities are strongly presented among the GAC, whereas South-American cities are almost absent and there are no African cities listed at all. Zooming in on Asia, we can observe their presence as GFC, but also their absence as GAC apart from Tokyo, Seoul and, although quite low in the ranking, Beijing. On the other hand, we do find quite a few, mainly European cities which are global centers of art but not of finance as not only large cities as Berlin and Vienna, but also quite small cities as Edinburgh and, for example, Düsseldorf vividly illustrate. Urbanization economies alone, consequently, cannot account for the patterns that we found. Other factors have to be taken into account. The observed pattern of European overrepresentation might be partly the result of a western or European bias in defining arts. The UNCTAD definition might be more sensitive to “western arts” than art forms from elsewhere and, hence, make it more likely that European and North-American cities will appear on the list while art forms from cities elsewhere may not be recognized as such. It might also be the case that arts events are not listed on the web or not listed in a recognizable way. It may also be the case that international arts events in East Asia are targeted at an international though non-Western audience and not promoted in such a way that it is included in our data base. This, however, cannot be the whole story. Being a global arts center requires a clear and accessible presence on the web in a way that can be recognized by an international audience. We have also used our data in a careful way that aims at robustness. One might argue about the exact ranking, but in our view the GAC ranking does reflect the general pattern of global arts importance. With respect to Asian cities, we can point at the very short time span in which these cities (apart from Tokyo and, to a lesser extent, Beijing) have transformed from poor, culturally isolated and often politically repressive economic backwaters to global economic powerhouses more open to the outside world (Jacques, 2012). It would seem, then, that these cities have not been able yet to develop into open-minded artistic centers, places with a (consumer and producer) culture characterized by a willingness to experience and appreciate arts. It might even be the case that cultures based on Confucianism are not that conducive to such more open and volatile western concepts of arts and artistic behavior taking more time to transform into a Global Arts Center if at all (Jacques, 2012). The prominence of European cities on the GAC ranking also needs clarification. Peter Hall (2001: 62) noted that the political fragmentation of Europe had fostered a cultural blooming evnn small cities “quite disproportionate to their size” and “…because no other continent has so many small nation-states with long cultural histories, no other presents quite this degree of nonhierarchical richness” according to Hall (2001: 64). The cultural richness had been long underpinned by discerning aristocratic and bourgeois elites interested in arts. In many cities, a thick institutional fabric with educational institutions, fairs, venues and theatres could develop and thereby generating more narrow forms of agglomeration economies directly benefiting arts. In post-war Europe, with the rise of the welfare state, there was a political will among the already educated élites to spread cultural capital (Sassoon, 2006: 72). Nowhere was this stronger, arguably, than among German-speaking cultures where the aim to civilize people by making them acquainted with high culture, the Bildungsideal, was already well under way in the 19th century. In a path-dependent way, the conditions for excellence in arts were reproduced (cf. Deinema, 2012). These are conjectures which have to be investigated in further research. This first explorative research has, however, made clear that the relationship between Global Financial Centers and Global Art Centers is much more complex that can be expected on the basis of urbanization economies. Place-specific factors as time lags, localization economies, and local cultures seem to be very much part of the equation as well. REFERENCESAmt für Statistik Berlin Brandenburg, 2010, “Statistisches Jahrbuch 2009”, http://www.statistik-berlin-brandenburg.de/PRODUKTE/jahrbuch/jb2009/BE_Jahrbuch_2009.pdf Arrighi G, 1994 The Long Twentieth Century: Money, Power and the Origins of Our Times (Verso, London and New York) artnet, 2011, “artnet Calendar”, http://www.artnet.com/ag/events.asp?G=8&order=m&m=1&d=1&y=2011&View=GAL A. T. Kearney, 2010, “The Urban Elite. The A.T. Kearney Global Cities Index 2010”, Chicago, http://www.atkearney.com/documents/10192/efd4176a-09dd-4ed4-b030-9d94ecc17e8b Beaverstock J V, Smith R G, Taylor P J, 1999, “A roster of world cities” Cities: The International Quarterly on Urban Policy 16(6) 445-458 Braudel F, 1979, Les Structures du quotidien: Le possible et l'impossible (Armand Colin, Paris) Chang T C, 2000, “Renaissance revisited: Singapore as a ‘Global City for the Arts’” International Journal of Urban and Regional Research 24(4) 818-831 Clark D E, Kahn J, 1988, “The social benefits of urban cultural amenities” Journal of Regional Science 28(3) 363-377 Clark P, 2009 European Cities and Towns 400-2000 (Oxford University Press, Oxford) Currid E, 2006, “New York as a global creative hub: a competitive analysis of four theories on world cities” Economic Development Quarterly 20(4) 330-350 Currid E, 2007 The Warhol Economy: How Fashion, Art and Music Drive New York City (Princeton University Press, Princeton) Currid E, Connolly J, 2008, “Patterns of knowledge: The geography of advanced services and the case of art and culture” Annals of the Association of American Geographers 98(2) 414-434 Deinema M N, 2012 The Culture Business Caught in Place: Spatial Trajectories of Dutch Cultural Industries, 1899-2005 PhD thesis, Faculty of Social and Behavioral Science, University of Amsterdam Derudder B, De Vos A, Witlox F, 2012a, “Global city/world city”, in International Handbook of Globalization and World Cities Eds B Derudder, M Hoyler, P J Taylor, F Witlox (Edward Elgar, Cheltenham) 73-81 Derudder B, Hoyler M, Taylor P J, Witlox F, 2012b, “Introduction: a relational urban studies”, in International Handbook of Globalization and World Cities Eds B Derudder, M Hoyler, P J Taylor, F Witlox (Edward Elgar, Cheltenham) 1-4 Engelen E, 2007, “‘Amsterdamned‘? The uncertain future of a financial centre”, Environment and Planning A 39(6) 1306-1324 Engelen E, 2012, “Grasping the spatial paradoxes of finance: theoretical lessons from the case of Amsterdam” in International Handbook of Globalization and World Cities Eds B Derudder, M Hoyler, P J Taylor, F Witlox (Edward Elgar, Cheltenham) 251-264 Evans G, 2009, “Creative cities, creative spaces and urban policy” Urban Studies 46(5-6) 1003-1040 Expatica 2006, “David Bowie's golden years in Berlin”, 11 July, http://www.expatica.com/de/leisure/arts_culture/david-bowies-golden-years-in-berlin-31468.html Florida R, 2002 The Rise Of The Creative Class: And How It's Transforming Work, Leisure, Community And Everyday Life (Basic Books, New York) Friedmann J, 1986, “The world-city hypothesis” Development and Change 17(1) 69-83 Ginsburgh V A, Throsby C D, 2006 Handbook of The Economics of Art and Culture (Elsevier North-Holland, Amsterdam) Glaeser E L, 2011 Triumph of the City: How Our Greatest Invention Makes Us Richer, Smarter, Greener, Healthier, and Happier (Penguin Press, New York) Gospodini A, 2002, “European cities in competition and the new 'uses' of urban design” Journal of Urban Design 7(1) 59-73 Hall P, 1966 The World Cities (Weidenfeld and Nicolson, London) Hall P, 1998 Cities in Civilisation: Culture, Innovation, And Urban Order (Weidenfeld & Nicolson, London) Hall P, 2001, “Global city regions in the twenty-first century” in Global City-Regions; Trends, Theory, Policy Eds A J Scott (Oxford University Press, Oxford) 59-77 Harvey D, 1989 The Urban Experience (Basil Blackwell, Oxford) Heilbrun J, Gray C M, 1993 The Economics of Art and Culture: An American Perspective (Cambridge University Press, Cambridge) Hutter M, Throsby C D, 2008 Beyond Price: Value in Culture, Economics, and the Arts (Cambridge University Press, Cambridge) IMF, International Monetary Fund, 2008, “World Economic Outlook. Financial Stress, Downturns, and Recoveries”, http://www.imf.org/external/pubs/ft/weo/2008/02/pdf/text.pdf Israel J, 1995 The Dutch Republic: Its Rise, Greatness, and Fall 1477–1806 (Oxford University Press, Oxford) Jacques M, 2012 When China Rules the World (Penguin Books, London) Kotler P, Haider D, Rein I, 1993 Marketing Places: Attracting Investment, Industry, and Tourism to Cities, States, and Nations (The Free Press, New York) Krätke S, 2003, “Global media cities in a world-wide urban network” European Planning Studies 11(6) 605-628 Landry C, 2000 The Creative City: A Toolkit for Urban Innovators (Comedia/Earthscan, Stroud) Le Galés P, 2002 European Cities: Social Conflicts and Governance (Oxford University Press, Oxford) Markusen A, Schrock G, 2006, “The artistic dividend: Urban artistic specialisation and economic development implications” Urban Studies 43(10) 1661-1686 Mazower M, 1998, Dark Continent: Europe’s Twentieth Century (Vintage Books, New York) McKinsey & Company, 2011, “Urban world: Mapping the economic power of cities”, McKinsey Global Institute, http://www.mckinsey.com/insights/mgi/research/urbanization/urban_world Mommaas H, 2004, “Cultural clusters and the post-industrial city: towards the remapping of urban cultural policy” Urban Studies 41(3) 507-532 O’Brien P, 2001, “Reflections and mediations on Anwerp, Amsterdam and London in their Golden Ages” in Urban Achievement in Early Modern Europe; Golden Ages in Antwerp, Amsterdam and London Eds P O’Brien, D Keene, M ’t Hart, H van der Wee (Cambridge University Press, Cambridge) 3-35 Performing Arts Network Japan, 2011, The Japan Foundation, http://performingarts.jp/# Powell R, 2010, “Galleries galore: A tour of Tokyo's teeming art scene” The Guardian, 5 February, http://www.guardian.co.uk/artanddesign/2010/feb/05/galleries-tokyo-art-scene Prak M, 2005 The Dutch Republic in the Seventeenth Century: The Golden Age (Cambridge University Press, Cambridge) Pratt A C, 2012, “The cultural economy and the global city” in International Handbook of Globalization and World Cities Eds B Derudder, M Hoyler, P J Taylor, F Witlox (Edward Elgar, Cheltenham) 265-274 PricewaterhouseCoopers, 2009, “Global city GDP rankings 2008-2025”, http://www.ukmediacentre.pwc.com/Media-Library/Global-city-GDP-rankings-2008-2025-61a.aspx Sassen S, 1991/2001 The Global City: New York, London, Tokyo (Princeton University Press, Princeton) Sassen S, 1999, “Global financial centers” Foreign Affairs 78(1) 75-87 Sassoon D, 2006 The Culture of the Europeans: From 1800 to the Present (HarperPress, London) Scott A J, 2000 The Cultural Economy of Cities: Essays on the Geography of Image-Producing Industries (Sage, London) Scott A J, 2004, “Cultural-products industries and urban economic development: Prospects for growth and market contestation in global context” Urban Affairs Review 39(4) 461-490 Scott A J, 2011, “Emerging cities of the third wave” City 15(3-4) 289-321 Sherwood S, 2010,“Damascus evolves into a hub of Mideast art” 26 November, http://www.nytimes.com/2010/11/27/arts/27iht-scdamascus.html Sotheby's, 2009,“2008 Annual Report”, http://files.shareholder.com/downloads/BID/2082945746x0x282450/7FF3222A-6F3A-4544-A8CE-45483C202528/AR_2008_FINAL.pdf Taylor P J, 2005, “Leading world cities: Empirical evaluations of urban nodes in multiple networks” Urban Studies 42(9) 1593-1608 Taylor P J, 2012a, “Historical world city networks” in International Handbook of Globalization and World Cities Eds B Derudder, M Hoyler, P J Taylor, F Witlox (Edward Elgar, Cheltenham) 9-21 Taylor P J, 2012b, “The interlocking network model” in International Handbook of Globalization and World Cities Eds B Derudder, M Hoyler, P J Taylor, F Witlox (Edward Elgar, Cheltenham) 51-63 The Economist, 2012, “Hot spots: Benchmarking global city competitiveness”, Economist Intelligence Unit, http://www.citigroup.com/citi/citiforcities/pdfs/hotspots.pdf The Mori Memorial Foundation, 2009, “Global Power City Index 2009”, Institute for Urban Strategies, Tokyo, http://www.mori-m-foundation.or.jp/english/research/project/6/pdf/GPCI2009_English.pdf Throsby C D, 2001 Economics and Culture (Cambridge University Press, Cambridge) Throsby C D, 2010 The Economics of Cultural Policy (Cambridge University Press, Cambridge) Throsby C D, Withers G A, 1979 The Economics of the Performing Arts (Edward Arnold, London) UNCTAD, United Nations Conference on Trade and Development, 2008, “Creative economy report 2008”, http://unctad.org/en/Docs/ditc20082cer_en.pdf UNCTAD, United Nations Conference on Trade and Development, 2010, “Creative economy report 2010”, http://unctad.org/en/docs/ditctab20103_en.pdf UN DESA, United Nations Department of Economic and Social Affairs, 2009, “World urbanization prospects 2009”, http://esa.un.org/unpd/wup/index.htm United States Census Bureau, 2010, “Data”, http://www.census.gov/ Watson A, 2012, “How global are the global media?” in International Handbook of Globalization and World Cities Eds B Derudder, M Hoyler, P J Taylor, F Witlox (Edward Elgar, Cheltenham) 284-294 Westmoreland M R, 2002, “Damascus” in Encyclopedia of Urban Cultures; Cities and Cultures Around the World (Volume 2) Eds M Ember, C Ember (Grolier, Danbury) 107-115 WFE, World Federation of Exchanges, 2011, “Member exchanges”, http://www.world-exchanges.org/member-exchanges Zukin S, 1995 The Cultures of Cities (Blackwell, Cambridge) Z/Yen Group, 2011, “The Global Financial Centers Index 10”, http://www.longfinance.net/Publications/GFCI%2010.pdf
NOTES* Monika J. Skórska, University of Amsterdam, The Netherlands, email: M.J.Skorska@uva.nl 1. For instance, Savolinna, Finland is internationally well known for opera; it hosts an annual Savolinna Opera Festival, which is a major international arts event. However, on a regular day this town of 27,000-people is nowhere as vibrant as metropolises of hundred thousands or millions of people. 2. At the time when data for the ‘summer week’ was gathered, i.e. In May 2011, data for (1) international performing arts events and (2) international visual arts events were available only for 2010 and not yet for the entire 2011. At that time, we created the gross list of Global Arts Centers based on the 2010 international arts events data – this did not include Avignon, Barcelona, Bogota, Edinburgh, Hamburg, Santa Monica and Stockholm. As the ‘summer week’ data on local arts events were gathered for all cities on the gross GAC list, it consequently did not include the above seven cities. 3. See above: Data gathering and sources. 4. This data, however, is fragmented, might not be exhaustive and is less comparable across cities. For example, Tokyo has a very extensive listing of local visual arts events on the website www.tokyoartbeat.com. Based on the data from this source we see that Tokyo hosts over 2,000 visual arts events a week, more than any other city on our list. However, it is hard to say whether other cities indeed score a lot lower or do they maybe just not have a comparable website about art exhibitions (their culture agenda website might for instance list only major gallery exhibitions and omit smaller scale events…). 4. However, due to using several languages, some data might have been lost in translation, or simply we might have not accessed the relevant sources. 5. Similarly, while Italian cities may include culinary events in their culture/arts listings, food may not be considered arts in the cities in other parts of the world and such events may therefore not be covered on culture websites. ( food also does not fall under the United Nations definition of arts that we are using.) 6. We chose May and November on the basis of the fact that visual arts market is peaking at that times of the year (Sotheby’s, 2008) and we expected a higher than usual number of arts events in these periods. However, the choice is still inevitably subjective – we could have easily chosen other weeks. 7. Berlin – 3,5mln people (Amt für Statistik Berlin Brandenburg, 2010), New York – 8,1mln people (United States Census Bureau, 2010). 8. If corrected for population size, the score would be comparable to New York.
|
||