GaWC Research Bulletin 401 |
|
|
|
This Research Bulletin has been published in Environment and Planning B, 41 (3), (2014), 392-412.
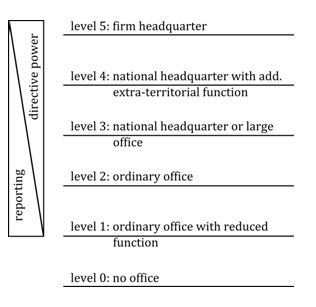
IntroductionPeter Taylor’s (2001) formal specification of the ‘world city network’ (WCN) as an ‘interlocking network’ has been a milestone in quantitative research on the geographies of globalized urbanization. In this ‘interlocking network’, cities are deemed to be connected through the flows of information, knowledge, capital, etc. generated within the office networks of advanced producer services (APS) firms. The popularity of Taylor’s ‘interlocking world city network model’ (IWCNM) can be traced back to the combination of (i) its firm theoretical grounding (i.e. he uses Sassen’s (1991) well-known work on ‘the global city’ as a starting point, and draws on a specification that is well established in social network analysis), and (ii) the fact that the empirical world/global city literature before the turn of the century was flawed by a combination of eclecticism and fuzziness. Drawing on this IWCNM specification and a series of concomitant data gatherings to ‘feed’ the model, Taylor and his colleagues from the Globalization and World Cities (GaWC) research network have provided detailed descriptions of the connectivity of cities in the WCN (e.g. Taylor et al, 2002; 2010). Parallel to the WCN analyses of the GaWC group, other approaches and data strategies have been developed (for an early review of ‘data wishlists’, see Smith and Timberlake, 1995). This includes studies of the urban dimensions of global infrastructure systems such as airline passenger networks (e.g. Smith and Timberlake, 2001) and Internet backbone networks (e.g. Rutherford et al., 2004), but also strategies that are more akin to the GaWC approach in that the analytical focus is on the geographies of corporate networks (for an overview, see Liu and Derudder, 2013). The most common approach in this regard has been the research that focuses on the headquarter-subsidiary relations within the corporate structures of multinational corporations (MNCs), e.g. the work of Alderson and Beckfield (2004), Alderson et al. (2010), Wall and vander Knaap (2011) and Rozenblat and Pumain (2006). In this research, inter-city relations are derived by interpreting a subsidiary owned by a multinational firm as “a directed interaction between the city where the headquarters are located and the city where the subsidiary is owned” (Rozenblat and Pumain, 2006, p. 313). As a consequence, the network centrality of cities is essentially examined by gauging their overall position in such ownership networks. Collectively, these sustained empirical analyses have certainly enhanced our understanding of the network centrality of cities in the WCN. However, in recent years, this strand of WCN research has come under scrutiny. We are hereby not referring to postmodern critiques that take issue with the various models because these purportedly represent totalizing metanarratives (see Robinson, 2002; Smith, 2012), but rather to research that has positively engaged with the empirical WCN literature to extend its remit (e.g. Neal 2008; 2012a,b; Liu et al 2013). This new direction in the WCN literature almost invariably starts from the observation that empirical research has not entirely lived up to its potential because of the restricted usefulness of the ways in which centrality measures are adopted in the various analyses. The general purpose of this paper is to contribute to this literature by proposing a method that allows obtaining insight into the significance of relations and positions of cities in WCNs created by MNCs. That is, rather than merely taking results of ‘traditional’ centrality measures such as betweenness centrality or closeness centrality at face value, we introduce a framework in which these measures are interpreted against a randomized baseline model that retains the network’s original degree distribution, which is undoubtedly an essential and defining element of any network. The advantage of this framework is that this allows distinguishing between ‘meaningful’ connectivities and linkages on the one hand, and those that can be attributed to random chance on the other hand. Although the rationale of using a baseline model in empirical WCN research is a general one, we confine ourselves - for reasons of simplicity - to (1) the WCN approach advanced in GaWC research and (2) the case of the betweenness centrality indicator. The latter choice derives from the fact that betweenness centrality is one of the most commonly adopted measures in empirical WCN research (e.g. Alderson and Beckfield, 2004; Guimerà et al., 2005; Neal, 2008; Wall and vander Knaap, 2011), while the former choice stems from a second, more specific purpose of this paper. That is, we argue that the widely adopted GaWC approach would benefit from a respecification that makes the data more fit for actual network analysis, and here we explore an example of such a respecification. The resulting, respecified WCN is then analysed by comparing empirical betweenness centrality measures with those given in the baseline model, which in turn allows us to reflect on the substantial, interpretative advantages of our approach. The remainder of this paper is organized as follows. We first review the GaWC approach to the measurement and subsequent analysis of the WCN, as well as the ways in which researchers have used its shortcomings to call for extending/altering the model beyond its initial specification in Taylor (2001). We use this overview to detail the construction of a different projection function for obtaining inter-city networks based on information on the office networks of APS firms, after which we introduce our analytical framework, which consists of a randomized baseline model for gauging betweenness centrality in networks. In the following section, we discuss our results, and explain how these demonstrate how our approach may enrich quantitative WCN research. The paper is concluded with an overview of our main findings and some potential avenues for further research. Beyond the IWCN modelThe IWCN ModelBefore Taylor’s (2001) specification of the IWCNM, empirical research on the shape of transnational urban networks simply relied on a variety of commonsensical indicators, such as cities’ roles as the headquarter location for multinational enterprises and international institutions (e.g., Godfrey and Zhou, 1999), their insertion in global transport networks (e.g., Keeling, 1995), etc. Although most of the resulting ‘world city rankings’ were inherently plausible, as a genuine empirical framework they all shared an obvious deficit, i.e. the lack of a precise specification of what constitutes the key dynamics behind WCN-formation. However, as Taylor (2001, p. 181) put it, such a precise specification is imperative when studying the WCN, because “(w)ithout it there can be no detailed study of its operation - its nodes, their connections and how they constitute an integrated whole.” Drawing on Sassen’s (1991) work on the rise of globalized advanced producer services (APS) economies in New York, London and Tokyo, Taylor (2001) thus specified the WCN as an inter-locking network with three levels: a network level (the global economy), a nodal level (world cities), and a critical sub-nodal level (firms providing the APS). According to Taylor’s specification, it is at the latter level that WCN formation takes place: through their attempts to provide a seamless service to their clients across the world, financial and business service firms have created global networks of offices in cities around the world. Each office network represents a firm’s urban strategy for servicing global capital, and the WCN can therefore be formally quantified by analysing the aggregated geographical patterns emerging from the flows within the office networks of such firms. Taylor’s (2001) formal specification of the WCN as an interlocking network starts with a universe of m advanced producer service firms in n world cities. The importance of the office of a firm j in city i is measured through its ‘service value’ vij, which can be arrayed as a service value matrix V. The basic relational matrix R between each pair of cities is derived from the initial matrix V as follows: where V’ is the transpose of V. In principle, a wide range of network analytics can be applied to R. Perhaps the most commonly used measure in GaWC research is a city’s ‘global network connectivity’ GNC, which is defined as the sum of a city's connections to all other cities in the network. Figure 1: Hierarchisation in the GaWC service value matrix.
Problems with the IWCNMAlthough the IWCNM has been widely used for assessing cities’ positions in the WCN, the model has not been without its critics. Here we describe two critical interventions that are crucial to appreciate our approach towards extending its empirical remit (for other critical observations that are not directly addressed here, see Neal, 2012a; 2013). A first critique of the IWCNM has been that Taylor’s specification summarized in equation (1) is tautological. Nordlund (2004), for instance, reproaches Taylor for “turning apples into oranges.” The reason for this standpoint is elaborated in Neal (2012a), who shows that a city's so-called GNC can be computed without any information on its connections with other cities. Indeed, a city’s GNC can also be calculated as follows:
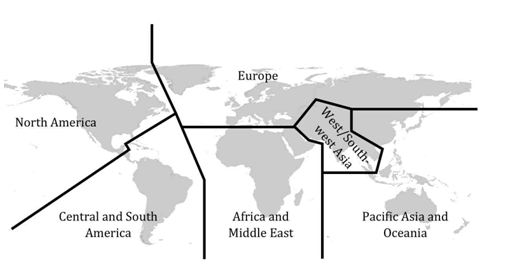
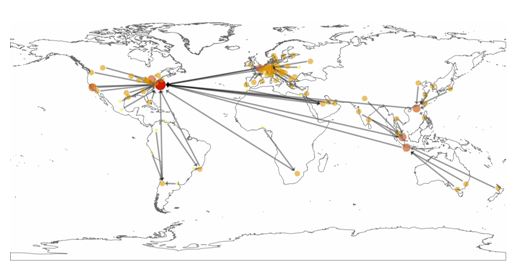
where Pf is the total global presence of firm f, and Pfc is its presence in city c (see Neal, 2012a), thus showing that in the initial specification ‘connectivity’ is above all a weighted method of counting the number of firms in a city. Second, it has recently been argued that the IWCNM is essentially a ‘dumbed down’ version of the much richer service value matrix. Taylor’s (2001) specification of the WCN essentially starts off as a so-called ‘two-mode network’. A two-mode network consists of two disjoint sets of nodes, whereby the primary data connects nodes of both sets. The WCN Taylor-style is indeed a two-mode network, as it consists of two disjoint sets of nodes (cities and firms) whereby the primary data consists of links connecting nodes of the different sets (the presence of firms in cities). In principle, two one-mode networks can be projected from a two-mode dataset (see Neal, 2008), and the IWCNM is essentially but one of different possible ways of deriving a one-mode city-to-city network from the two-mode city-to-firm dataset (Liu and Derudder, 2012; 2013). In the network literature, it is agreed that two of the major problems associated with IWCNM-like projections of two-mode networks into one-mode networks include (1) information loss due to compression of the two-mode network, and (2) an inflation of linkages due to the inclusion of every possible pairwise link (Latapy et al, 2008). For our purposes, the first issue is not that relevant, as it basically draws attention to the fact that Taylor’s focus on cities does not do full justice to the ‘duality of cities and firms’ (and which can be tackled by using two-mode network analytics, see Liu et al, 2013; Neal, 2008). Rather it is the second issue that is of concern here: the fact that equation (1) implies that the largest firm in the service value matrix enforces a wide-ranging density and therefore clustering on the IWCNM-derived network (Neal, 2012a,b), making it very difficult to distinguish between methodological artefact and ‘actual’ results. For instance, a major consequence of the IWCNM is that it produces nearly fully connected networks, so that GaWC researches have not really moved to the point of more refined network-analytical assessments as in the work of Alderson and Beckfield (2004) and Neal (2008). Indeed, in (nearly) fully connected networks, standard measures such as betweenness centrality can be calculated, but the results are not meaningful. In this paper, we propose to tackle these issues as follows by developing an alternative one-mode projection of the two-mode data in the service value matrix V, all the while retaining as much of the original relational information as possible. Compared to the initial specification, this involves focusing on city network-formation and wiping out as much ‘noise’ in the data as possible to arrive at less a dense network. Moreover, this reduction is based on conceptual considerations rather than mere technical ‘weeding’, thus, addressing Nordlund’s (2004) and Neal’s (2012a) major concerns. The resulting empirical WCN can then be analysed with conventional network-analytical tools. The overall rationale behind the method presented here is similar to the ONEMODE approach developed by Neal (2012b), who equally tries to sidestep the effect of what he calls ‘brute force’ processes shaping the empirical outcome of the INM. A key common feature of our and Neal’s approach, therefore, is that we seek to reveal significant structures within the WCN, i.e. structures that are the result of non-random processes. However, while Neal (2012b) focuses on the connections between cities, we deal with the network positions held by cities. In addition, the two approaches also differ in a number of other aspects. First, our method takes the full information of the GaWC data into account, and reduces this dense information based on what we believe are credible assumptions regarding the organization of globalized business services firms. Second, our algorithm and the subsequent randomization ‘solve’ the calculation problem within a single framework. Given these differences, all three approaches – the original INM, the approach followed by Neal (2012b), and the approach presented here – result in different takes on our understanding of world city networks. The next section details the main tenets of our alternative projection. Towards an alternative one-mode projection of the WCNIn this section, we discuss our specification of an alternative one-mode city-to-city relation matrix R based on the two-mode service value matrix V. The aim is to arrive at a reliable graph representation that retains most of the initial information in the service value matrix, while avoiding the typical high density of the IWCNM network projection1. Our alternative has three major features: (1) the number of linkages will be significantly reduced, thereby (2) imposing directionality in the connections (rab ≠ rba), and (3) assuming spatiality in the organization of APS firms’ office networks. In the IWCNM epitomized by equation (1), information on the relative importance of offices is used to guesstimate the strength of city-to-city connections for that firm. A major consequence is that each city-pair that shares offices of a certain firm is deemed connected, whereby there is furthermore no distance decay effect (Euclidean, functional, or otherwise) in the importance of the edges. For instance, if a firm has a ‘national headquarter’ in Amsterdam (service value 3) and ‘typical offices’ in Rotterdam and Karachi (service value 2), then these three cities are not only deemed to be inter-connected, but it will also be assumed that the Amsterdam-Karachi and Amsterdam-Rotterdam edges are of the same strength. Our starting point to an alternative one-mode specification is that this is unlikely because most ‘global’ companies organize their business geographically through a territorial framework of sorts, such as countries and/or ‘world regions’ (see Figure 2 for the McKinsey example). Meyer et al. (2011, 235f.) argue that there is increasing evidence that local context is an important factor for business strategies, and hypothesise that such differences in culture and context needs to be reflected in the internal hierarchies to be successful in globalized markets. Traditional ways of knowledge dissemination within the firms’ internal network were organized as top-down flow from the parent directed to the subsidiaries, whereas modern creative forms of firm network organization are shaped by local competence creation that is used to push information to the parent (Meyer et al. 2011, 242; cf. also Hennemann 2011). This strategic shift towards a pronounced regional organization of the multinational firm is necessary to become a transnational corporation that can utilise local knowledge integration into the firm context (Li et al. 2010, 6). Therefore, in our specification we introduce the notion of upward, regional reporting. The actual regionality in the organization of office networks is of course idiosyncratic for each firm, but here we assume a nested organization that consists of (a) countries, which are then further grouped in (b) a number of world regions that commonly return in transnational organizational schemes: North America, Central and South America, Europe, Africa/Middle East, West/Southwest Asia, and Pacific Asia/Oceania (see Figure 3). We combine this geographical classification with information on the hierarchization of office networks contained in Figure 1 to build a general algorithm assessing the (likely) primary linkage of cities within each office network. Our alternative specification essentially entails a regionalized operationalization of the metaphor of ‘reporting cascades’ between offices in different cities. In the process, we are only considering reporting that goes ‘upstream’ from lower levels (i.e. lower service values) to higher levels (i.e. higher service values). As a consequence, connections between cities are only possible between offices offering different levels of servicing, and in a way that they are directed from the lower level towards the higher level. Referring back to our example, then, we assume that there are no information flows between Karachi and Rotterdam, while the direction of the ‘reporting’ will be from Rotterdam and Karachi to Amsterdam. To this that we add our geographical component in that we assume that there is only one reporting city, defined by countries/world regions. For each city that houses an office of a firm, the algorithm connects this city to the city with the highest-level office within the same country. In case there is more than one office of this particular level in the same country, the connection is made with the geographically nearest city (e.g. connecting San Francisco to Los Angeles rather than to New York in the case of Los Angeles and New York being at the highest service level within the United States). If there is no higher-level office in the same country, the connection is made to the highest-level office within the own world region (see, however, Rossi et al., 2007). And if there is no such higher-level within a city’s own world region, the connection is made with the global headquarters (service value 5). Referring back to our example, then, it can be seen that the Karachi-Amsterdam link is deleted (or to be more precise: not created), while the Rotterdam-Amsterdam link is retained (unless there would have been a more important office in the Netherlands than the one in Amsterdam). Figure 4 shows an example of the actual linking process for the company network of McKinsey&Company. The regionally bound sub-systems can be traced back to the small office categories 1 and 2, which mainly report to their regional headquarters, except in the case of US offices, which are directly connected to the New York headquarter. The regional hubs are connecting the lower level hierarchies to the higher order hierarchies, which resembles the global location as reported on McKinsey’s corporate website. In our research, each of the 175 APS firms’ office networks is thus reduced to a theoretically probable reporting graph, after which the final step basically involves aggregating the resulting networks across all firms so that edges become valued. For instance, if Amsterdam often houses the most important office of APS firms in the Netherlands, and Rotterdam also has a lot of offices of these firms, then there will be a sizable Rotterdam-Amsterdam link in the respecified version of R. Meanwhile, Karachi-Amsterdam and Karachi-Rotterdam edges in R remain empirically possible, but are now less likely than Rotterdam-Amsterdam linkages. Figure 2: ‘World regions’ in McKinsey’s office network.
Figure 3: Assumed ‘world regions’ in typical APS firms’ business organization.
Figure 4: Outcome of the primary linkage procedure for McKinsey’s firm network for illustrative purposes
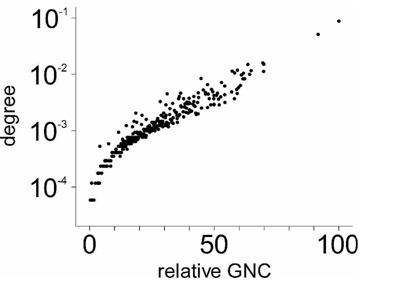
The key point is that this linkage procedure produces a version of R that does not suffer from the excessive density of the IWCNM-produced version of R, as the end-result is a much sparser network that nonetheless retains the WCN’s significant empirical structures. The latter appraisal is substantiated by an empirical comparison between a city’s logarithm of the degree2 based on our primary linkage algorithm and a city’s GNC in the IWCNM: Figure 5 plots the relationship of both nodal connectivity representations. The correlation coefficient of 0.95 indicates that both two models are similar with respect to what they (re)produce empirically in terms of the very basic structure, i.e. the individual node degree/connectivity3. Or, put differently: we have produced a WCN that shows significant similarities in the overall connections to that produced by Taylor’s IWCNM, but got rid of the excessive density that hampers its assessment based on standard network-analytical tools such as those given in Newman et al (2006) or in Wasserman and Faust (1994). This respecified version of R is now ready for an actual network analysis, which is described in the next section. Figure 5: Relationship between the relative GNC and the logarithm of the degree of cities in the primary linkage graph4.
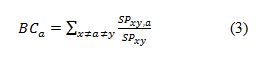
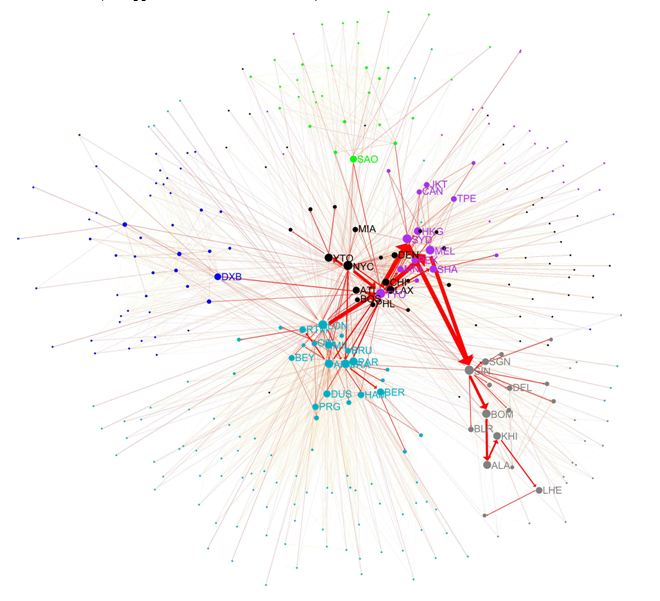
A randomization procedure for benchmarking betweenness centralitySimple and largely descriptive approaches for evaluating complex systems such as WCNs are seldom offering insight into the significance of urban relations and positions: although measures such as GNC in GaWC research or betweenness centrality in Alderson and Beckfield (2004) have their merits from a descriptive point of view, they lack an actual appraisal of a city’s overall position in the network set against a randomized reference network. To this end, we compute cities’ betweenness centrality in R and compare these to predefined expectations of the network structure by computing cities’ (mean) baseline values. Betweenness centrality is a network measure that has typically been lacking from GaWC analyses because of the excessive density resulting from the IWCNM. Overall, betweenness centrality gives a more refined appraisal of a node’s centrality in a network as it assesses the number of shortest paths from all nodes to all other nodes passing through that node (if possible given the network structure). The betweenness centrality BCa of a city a is given by the expression: whereby SPxy is the number of shortest paths from node x to node y, and SPxy,a is the number of these shortest paths running through a. However, as we are dealing with a weighted network, in practice links are considered in proportion to their capacity, which adds an extra dimension beyond the topological effects. Defining a baseline assessment for betweenness centrality is complicated (just as for any other network centrality measure), because stochastically independent generalized baseline models simply do not exist. For instance, the popular preferential attachment model of Barabási and Albert (1999), or similar models such as the small world model of Watts and Strogatz (1998), are both models that are often used as baseline models, because they capture some of the desired properties of a network and are defined only by very few parameters (e.g. the number of nodes and the average degree in the case of the BA-model). However, these models are considered to be too general in order to capture more subtle structures in real world networks that exhibit non-Gaussian broad distributions for most of their structural properties (cf. Andriani and McKelvey, 2009; van Wijk et al, 2010). For our purposes, the main aim in devising a baseline model is to preserve the basic structural property of the parameter distributions of the network, but to destroy (i.e. randomize) other properties. One of the most important single distributions for a network is the degree distribution, i.e. the frequency of the number of direct neighbours of nodes. A very efficient way to preserve this feature is to shuffle the edges by randomly picking two edges that connect four different nodes and swap their connections (Maslov and Sneppen, 2002). If this is repeated a sufficient number of times, the distribution of neighbours per node is still the same, but the original empirical relation between the nodes is effectively destroyed, and therefore independent from the empirical data. If this shuffling approach is combined with a bootstrapping, i.e. a repeated sampling of randomized networks, confidence intervals for the estimated parameter can be calculated (see Hennemann et al, 2012). In our analysis, we implement an ‘upper-level directed’ randomization procedure, which preserves the empirical in-degree and out-degree distributions. Central to the swapping and at odds with the method proposed by Hennemann et al (2012) is that it is not completely destroying all relational dependency that is present in the empirical network. Instead, the edge direction is preserved, whereas the hierarchies and the geographical dependency are effectively lost after the randomization. A concrete example may help the reader to appreciate the procedure and to evaluate the conceptual and empirical consequences of this approach. Consider two directed connections a-b and c-d, with connection a-b linking two low-level offices of an APS firm in South America (e.g. Bogota with vij = 1 and Sao Paulo with vij = 2) and connection c-d linking high-level cities in Europe (e.g. Paris with vij = 4 and London with vij = 5). The swapping will produce two new connections, substituting the original ones in the random model, connecting a-d and c-b. In this example, the swap will connect Bogota with London, and Paris with Sao Paulo. The net consequences are that the geographical as well as the hierarchical dependencies are being ‘destroyed’, all the while retaining the overall out-degree/in-degree distribution. This swapping procedure is repeated ten times the total number of edges in the empirical network (approximately 32,000 swaps are conducted), which acts as starting point for the randomization and is successively shuffled with each iterative step of swapping. However, this randomized network represents only one possible random equivalent of the empirical network. In order to yield greater confidence on the difference between the empirical and the randomized network, we repeated this randomization for 500 configurations and estimate network measures from these random samples. This simulation or bootstrapping is discussed in Hennemann (2012) in detail. Comparing network centrality values derived from the empirical network with the median betweenness centrality values in the randomized networks allows revealing significant patterns in the network positions of cities. We have repeated this randomization process of 500 configurations ten times in order to yield greater validity of the median as well as the upper and lower bounds of the 95%-confidence intervals around the median value of the randomized betweenness score. This technique is simple, but effectively captures the asymmetry of the distribution (Efron and Tibshirani 1986, 68). Comparing empirical betweenness centrality measures derived by applying (3) to the respecified version R with the measures derived from the baseline model allows singling out some cities with higher or lower measures than could be expected. The next section discusses some of these examples, which allows showing how this approach may enhance our insight in the position of cities in the WCN. Results and discussionTo explore some examples, Tables 1 and 2 compare cities’ empirical betweenness with the GNC measures produced by the IWCNM. The ratio of the empirical betweenness connectivity and the mean of the randomized betweenness represents a normalized estimate for the betweenness, while significant deviations between observed and expected values were assessed on the basis of the confidence intervals (i.e. empirical betweenness scores are marked as significant when these are outside the 95%-confidence interval of the betweenness scores in the randomized/simulated networks). Table 1 provides the results for the cities that feature in the top 20 of either empirical betweenness in our network specification or the GNC according to the IWCNM, while Table 2 ranks the midfield of cities with average connectivity. In addition, Figure 6 plots the WCN at large, while Figure 7 plot the ego networks of a number of notable cases (i.e. cities with a much higher/lower empirical betweenness than GNC, such as Tokyo, Melbourne, Karachi, Almaty, Madrid and Moscow). In the figures, colour codes are used to identify our operationalization of ‘world regions’, node size varies with cities’ betweenness centrality, the edge width represents the weight of a connection whereby the ‘direction’ of the edge is based on the net balance of directed connections between the city nodes. To keep the figures readable, city name abbreviations are only displayed if they have an empirical betweenness of 0.005 or higher. We used the international abbreviations of the international air transport association (IATA) metropolitan codes (appendix 1, see. Hennemann (2013) for an alternative circular visualisation of the results that keeps most of the information in a readable form). Figure 6: The WCN based on an application of the primary linkage method to the 2010 GaWC data (see appendix 1 for the code table)
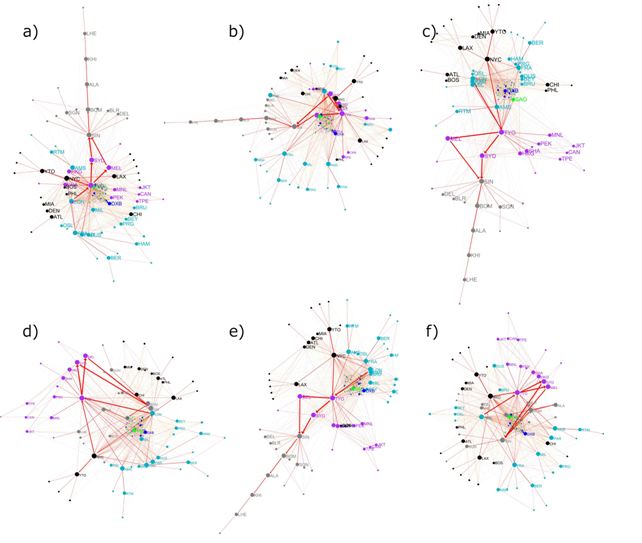
Figure 7: Ego network layout for a) Tokyo, b) Melbourne, c) Moscow, d) Almaty, e) Madrid, f) Karachi (see appendix 1 for the code table)
Table 1: Results of the network calculations (all cities featuring in the top 20 of either betweenness centrality based on the alternative WCN specification or GNC in the original specification are included in the table).
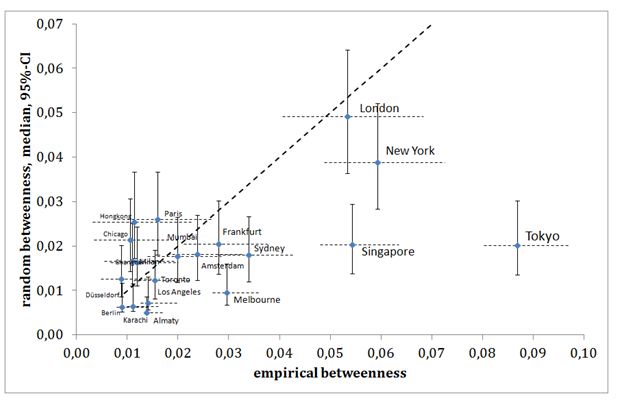
Note: The confidence intervals were calculated using the standard percentile method (cf. Hall 1988), with 500 configurations and 10 repetitions. The results in Table 1 show that empirical betweenness on the one hand, and expected betweenness based on the null model and GNC on the other hand are indeed closely related (15 out of the top 20 cities are the same), but most certainly not the same: there are some major shifts in the ranking. Tokyo, for instance, emerges as the most central city in our respecified WCN, although it is only ranked 6th in Taylor’s IWCN model (see Figure 6a for Tokyo’s ego network). This is paired with the fact that Tokyo’s empirical betweenness is also much higher than expected based on the null model, and can be attributed to the combined fact that (1) Tokyo has consistently strong connections with most other major cities such as New York, London, and Singapore, as well as (2) connecting a large group of (mainly Asian) cities to the network at large. Put differently, although the predominant reading of Tokyo’s position in GaWC’s WCN analyses has been that the city is trailing Hong Kong in Pacific Asia (and that given the continued economic problems in Japan it is unlikely this will be reversed in the short run), our approach suggests that Tokyo does have a key strategic role in the WCN: many of the connections passing through Tokyo are non-redundant or quasi-non-redundant for attaching other cities to the overall WCN, giving it a much larger betweenness value than could be expected in a random network with the same degree distribution. Although this interpretation ultimately hinges on some of the choices we have made in our model specification, the key point here is that insights regarding Tokyo’s crucial position in the overall network cannot be drawn based on an analysis of GaWC’s nearly fully connected version of R. Many of Tokyo’s non-redundant or quasi-non-redundant connections pass via Singapore and Melbourne/Sydney, so that the high rankings of the latter cities can be explained along similar lines. Although Melbourne (29th) is deemed less connected than Sydney (7th) in the WCN Taylor-style, our network-wide analysis suggests that the difference between both cities is perhaps less important, as they are both playing a similar, crucial role in the WCN as a whole. That is, a large proportion of their connections is with some of the world’s premier cities (especially Asia’s leading cities), while both cities are literally central for keeping some other Australian/Oceanian cities connected to the WCN. Similar to Tokyo and Singapore, then, Australia’s two leading cities emerge as key nodes in the WCN in our specification. Perhaps the most dramatic examples of this boosted betweenness in our re-specified WCN are the major connectivities for Almaty and Karachi. Although not major cities according to their GNC, both cities are important for sustaining the WCN when respecifying the network through regionalized primary linkages: both cities have far fewer connections than Dubai, Madrid and Beijing, but these connections are ‘strategically’ important as these tend to be non-redundant for a number of cities such as Baku, Tashkent, Tbilisi, Tehran or Yerevan linking to the WCN through Almaty/Karachi and leading towards cities of high importance. Correspondingly, some cities have less extensive levels of betweenness centrality than expected based on the baseline model and GaWC’s GNC. Hong Kong, for instance, can easily be bypassed via other major cities: the city can relatively easily be circumvented via the likes of Singapore and Tokyo, making the city slightly less important than one would expect based on its cluster of globalized APS per se. Interestingly, China’s two other premier cities, Beijing and Shanghai, are also statistically significant less central to the system than suggested by their GNC and the null model. An explanation here may be provided by recent qualitative research by Lai (2012), who has argued that many globalized APS firms have a three-tiered approach to China’s giant space-economy. Many of these firms open offices (with slightly different functions) in each of the three cities rather than making a choice between them. Although this makes China’s three premier cities well connected in the office networks of APS firms, these connections are, in relative terms, redundant in the sense that one could possibly call up an office in one of the other two cities. Put differently: each of the three Chinese cities can on average be more easily bypassed than, say, Singapore, and the latter city thus boasts a more crucial position in the overall network structure. Similarly, the redundancy of some of the connections of Moscow and Madrid is hindering both cities from being more prominently ranked: the fact that there are many other connections leading to the same target city node implies that both cities can be bypassed relatively easily via other European cities. In the IWCNM, the extensive clusters of APS in Madrid and Moscow lead to a major GNC as everything-is-connected-to-everything, but here we suggest that this IWCNM approach possibly overvalues these cities’ importance, as most of their connections are unneeded for reproducing the spatial structure of the WCN; indeed, both cities are offering only weak regional hub functions for less connected cities in their region. A different perspective on the top 20 global cities is shown in figure 8. It is summing up the information in table 1 and maps the empirical betweenness against the randomized mean betweenness. The error bars are showing the 95%-confidence intervals of the betweenness approximations in the baseline model. All cities that are below the dashed 45-degree line are showing higher empirical betweenness values than expected by chance. For those cities above the line, the values are lower than expected. However, if the vertical error bars cross the line, the differences are not sufficiently large enough, i.e. significant (such as in the case of London). Figure 8: Empirical betweenness vs. random estimates for the Top 20 cities
The dashed horizontal error bars show the 95%-confidence intervals mapped to the empirical values to indicate for significant ranking position, i.e. if the lines of any two cities are overlapping one another, the cities’ ranking position is not significantly different, such as in the cases of London, New York and Singapore. However, Singapore is the most surprising one in this group of three, because of the large deviation between empirical and randomized betweenness values. Moreover, it tells that the ranking position of Tokyo is pretty solid, given the large margin to the followers. Likewise, Sydney is significantly better positioned than Amsterdam, whereas Amsterdam’s rank and Melbourne’s rank are not significantly different from one another. In general, gaining cities have the tendency of having high numbers of incoming connections relative to their outgoing connections. This implies that these cities assemble relatively high office functions in firm networks that are quite important for the overall network functioning. Although they do not necessarily possess the highest-level functions in the office networks, these cities are mediating flows between hierarchical levels and therefore for cities that are otherwise less accessible in the WCN. Moreover, these gaining cities are more often than not hosting the most important offices of APS firms in their country. Table 2: Building blocks of differences in ranking of medium-connected European cities.
Note: The confidence intervals were calculated using the standard percentile method (cf. Hall 1988), with 500 configurations and 10 repetitions. Concluding remarksIn this paper, we have addressed some of the limitations of Taylor’s (2001) IWCNM specification with the purpose of devising an actual network analysis of the WCN. We have specified an alternative one-mode projection function, which results in sparser matrix that nonetheless retains the basic contours of the IWCNM-produced urban network. The resulting inter-city matrix can – in contrast to the WCN produced by the unaltered IWCNM – be examined with network analysis techniques. Here we have analysed cities’ positions in the network at large by comparing their empirical betweenness centrality with a randomized null-model. We discussed the empirical advantages of our approach through a number of notable examples, i.e. cities that rank much higher/lower on betweenness centrality than on IWCNM-produced centrality measures. The added insight includes, for instance, the identification of cities that play a major role in APS firms’ office networks because their links to major cities are non-redundant (e.g., Almaty), while other cities are less important because their position in APS firms’ office networks are redundant from the perspective of the network at large (e.g. Hong Kong, which can be by-passed through Singapore or Tokyo). Nonetheless, we emphasize that our alternative approach of measuring connectivity in the WCN, just as the approach developed in Neal (2012b), should above all be seen as an alternative that opens up new analytical options rather than as a replacing measure per se. The original approach does have its unique advantages: Taylor’s (2001, 2004) GNC measure is based upon a useful and common network analysis approach of searching out all potential links. The measure proposed here is closer to actual flows, using a particular assumption producing some simplification. It is therefore quite possible to see both approaches as complementary measures: GNC is about global potential; our new measure is a proximity cascading measure that adds an element of geographical hierarchical processes. Some of the discussions in this paper can be said to be somewhat idiosyncratic as they deal with the specifics of one the approaches that abounds in empirical WCN research (i.e. the GaWC approach). However, we emphasize that this exercise had a wider applicability as our framework can be used (1) for other WCN specifications that may or may not be derived from other data sources and (2) for other centrality measures (with the exception of degree-based measurements). It therefore offers a wide range of applications that include amongst others a regionalization benchmarking for the assessment of the network importance of whole regions based on the performance of individual actors as described in Hennemann (2012). Beyond network centrality assessments, other structural features may be evaluated such as network clustering, hierarchical dependence, or rich-club phenomena to name a few. In addition, network/regional resilience of a given network may be evaluated against a structurally similar random network. It is important to stress that we are aware that some of the empirical results presented here may be more reflective of the operational choices made in our (re)specification of the GaWC model than ‘actual, real-world’ patterns. The potential impact of (1) our operationalization of ‘regionalization’ and (2) the standpoint that cities can only have one ‘reporting city’ are the most obvious examples here. For instance, it is possible that (1) adding Pacific Asia and Oceania in a single ‘Asia-Pacific’ world region may remove Melbourne’s and Sydney’s high betweenness centrality, just as (2) a choice for multiple reporting cities in the United States would impact our assessment of the role of US cities. An obvious avenue for further research is therefore assessing the impact of the one-mode projection adopted in this paper through sensitivity analyses, e.g. by gauging the impact of different regionalizations and/or exploring the effect of more refined linking algorithms. This would include evaluating whether changes in the regionalization will affect the network degree structure in comparison with the original INM structure. In addition, from a methodological point of view, our approach and data should also be evaluated against other systems such as global transportation networks or global science networks. From a theoretical/conceptual perspective, our results suggest that geographers should continue exploring the idea of strategic places in the world city network (Sassen, 2006), i.e. cities that are obviously important for the systemic structure without being overwhelmingly well connected. This avenue of research would link to the discussion in Liefner and Hennemann (2011), who combine the network perspective and the future developmental perspective of agglomerations and attribute territorial lock-ins and economic decline to missing structural holes capacities of an agglomerations’ network position. The panel-like structure of the GaWC research network data on advanced producer service firms would allow for the empirical testing of this notion. For the 2010 data used here, we found Madrid and Moscow in such potentially disadvantageous positions. Both cities seem rich in ‘connectivity’, but only offer only weak regional hub functions for less connected cities in their ‘region’. This conception would introduce an inherent dynamic component into the idea of WCNs, pushing it towards current theoretical discussions in human geography such as evolutionary economic geography from a global perspective. APPENDIXAppendix 1: List of IATA-City/Metropolitan codes that have been used in figures 7 and 8 REFERENCESAlderson A S, Beckfield J, 2004, “Power and position in the world city system” American Journal of Sociology 109 811-851 Alderson, A S, Beckfield J, Sprague-Jones J, 2010, “Inter-City Relations and Globalization: The Evolution of the Global Urban Hierarchy, 1981-2007“ Urban Studies 47 (9)1899-1923 Andriani P, McKelvey B, 2009, “From Gaussian to Paretian thinking: causes and implications of power laws in organizations” Organization Science 20 (6) 1053-1071 Barabási A-L, Albert R, 1999, “Emergence of scaling in random networks” Science 286 (5439) 509-512 Derudder B, Taylor P, Ni P, De Vos A, Hoyler M, Hanssens H, Bassens D, Huang J, Witlox F, Shen W, Yang X, 2010, “Pathways of Change: Shifting Connectivities in the World City Network, 2000-2008” Urban Studies 47 (9),1861-1877 Efron B, Tibshirani R, 1986, “Bootstrap Methods for Standard Errors, Confidence Intervals, and Other Measures of Statistical Accuracy” Statistical Science 1 (1), 54-77 Godfrey B J, Zhou Y, 1999, “Ranking world cities: multinational corporations and the global urban hierarchy” Urban Studies 20 (3) 268-281 Guimerà R, Mossa S, Turtschi A, Amaral, L, 2005, “The worldwide air transportation network: Anomalous centrality, community structure, and cities’ global roles” PNAS 102 (22) 7794–7799, Hall P, 1988, “Theoretical comparison of bootstrap confidence intervals” The Annals of Statistics 16 (3) 927-963 Hennemann S, 2011, “The Role of Transnational Corporations in the Chinese Science and Technology Network” Erdkunde 65 (1) 69-81 Hennemann S, Rybski D, Liefner I, 2012, “The myth of global science collaboration - Collaboration patterns in epistemic communities” Journal of Informetrics 6 (2) 217-225 Hennemann S, 2012, “Evaluating the performance of geographical locations within scientific networks using an aggregation – randomization – re-sampling approach (ARR)” Journal of the American Society for Information Science and Technology 63 (12), 2393-2404 Hennemann S, 2013, “Information-rich visualisation of dense geographical networks” Journal of Maps, in press, doi: 10.1080/17445647.2012.753850 Keeling D J, 1995, “Transportation and the world city paradigm”, in World Cities in a World-System Eds P L Knox, P J Taylor (Cambridge University Press, Cambridge) pp 115-131 Lai K, 2012, “Differentiated markets: Shanghai, Beijing and Hong Kong in China’s financial centre network” Urban Studies 49 (6) 1275-1296 Latapy M, Magnien C, Del Veccio N, 2008, “Basic notions for the analysis of large affiliation networks / bipartite graphs” Social Networks 30 (1) 31-49 Li G H, Yu C-M, Seetoo D-H, 2010, “Toward a Theory of Regional Organization. The Emerging Role of Sub-regional Headquarters and the Impact on Subsidiaries” Management International Review 50 (1) 5-33 Liefner I, Hennemann S, 2011, “Structural holes and new dimensions of distance: The spatial configuration of the scientific knowledge network of China’s optical technology sector” Environment and Planning A 43 (4) 810-829 Liu X, Derudder B, 2012, “Two-mode networks and the interlocking world city network model: a reply to Neal” Geographical Analysis 44 (2) 171-173 Liu X, Derudder B, 2013, “Analyzing Urban Networks Through the Lens of Corporate Networks: A Critical Review” Cities, in press, doi: 10.1016/j.cities.2012.07.009 Liu X, Derudder B, Liu Y, Witlox F Shen, W, 2013, “A stochastic actor-based modelling of the evolution of an intercity corporate network” Environment and Planning A, accepted for publication. Maslov S, Sneppen K, 2002, “Specificity and stability in topology of protein networks” Science 296 (5569) 910-913 Meyer K E, Mudambi R, Narula R, 2011, “Multinational Enterprises and Local Contexts: The Opportunities and Challenges of Multiple Embeddedness” Journal of Management Studies 48 (2) 235-252 Neal Z, 2008, “The duality of world cities and firms: networks, hierarchies, and inequalities in the global economy” Global Networks 8 (1) 94-115 Neal Z, 2012a, “Structural determinism in the interlocking world city network” Geographical Analysis 44 (2) 162-170 Neal Z, 2012b, “Brute Force and Sorting Processes: Two Perspectives on World City Network Formation” Urban Studies, in press, doi:10.1177/0042098012460733 Newman M, Barabási A-L, Watts D (eds.), 2006, The Structure and Dynamics of Networks (Princeton University Press, Princeton, NJ) Nordlund C, 2004, “A critical comment on the Taylor approach for measuring world city interlocking linkages” Geographical Analysis 36 (3) 290-296 Robinson J, 2002, “Global and world cities: a view from off the map” International Journal of Urban and Regional Research 26 (3) 531-554 Rossi EC, Beaverstock, JV, Taylor PJ, 2007, “Transaction Links through Cities: 'Decision Cities' and 'Service Cities' in Outsourcing by Leading Brazilian Firms” Geoforum 38 (4) 628-642 Rozenblat C, Pumain D, 2006, “Firm linkages, innovation and the evolution of urban systems”, in Cities in globalization: practices, policies and theories Eds P J Taylor, B Derudder, P Saey, F Witlox (Routledge, London) pp 130-156 Rutherford J, Gillespie A, Richardson R, 2004, “The territoriality of pan-European telecommunications backbone networks” Journal of Urban Technology 11 (3) 1-34 Sassen S, 1991 The Global City: New York, London, Tokyo (Princeton University Press, Princeton) Sassen S, 2006, Cities in a world economy (3rd edition) (Pine Forge Press, Thousand Oaks, CA). Smith D A, Timberlake M, 1995 Conceptualising and mapping the structure of the world system’s city system Urban Studies 32 287-302 Smith D A and Timberlake M 2001 World city networks and hierarchies, 1977-1997: an empirical analysis of global air travel links American Behavioral Scientist 44 (10) 1656-1678 Smith R G, 2012, “Beyond the global city concept”, Globalization and World City research network Research Bulletin 390, http://www.lboro.ac.uk/gawc/rb/rb390.html Taylor P J, 2001, “Specification of the world city network” Geographical Analysis 33 (2) 181-194 Taylor P J, Catalano G, Walker D R F, 2002, “Measurement of the world city network” Urban Studies 39 (13) 2367-2376 Taylor P J, Ni P, Derudder B, Hoyler M, Huang J, Witlox F, 2010 Global Urban Analysis: A Survey of Cities in Globalization (Routledge, London) Taylor P J, Derudder B, Hoyler M, Ni P, 2013, “New regional geographies of the world as practised by leading advanced producer service firms in 2010” Transactions of the Institute of British Geographers, in press, doi: 10.1111/j.1475-5661.2012.00545.x van Wijk B C M, Stam C J, Daffertshofer A, 2010, “Comparing brain networks of different size and connectivity density using graph theory” Public Library of Science ONE 5 (10) e13701 Wall RS, van der Knaap G A, 2011, “Sectoral Differentiation and Network Structure Within Contemporary Worldwide Corporate Networks“ Economic Geography 87 (3) 267-308. Wasserman S, Faust K, 1994, Social Network Analysis – Methods and Applications (Cambridge University Press, Cambridge, MA) Watts D J, Strogatz S H, 1998, “Collective dynamics of 'small-world' networks” Nature 393 (6684) 440-442
NOTES* Ben Derudder, Geography Department, Ghent University, Belgium. E-mail: ben.derudder@ugent.be ** Stefan Hennemann, Justus-Liebig-Universität Gießen, Institut für Geographie, Bereich Wirtschaftsgeographie, E-mail: stefan.hennemann@geogr.uni-giessen.de 1. All data preparation and network-related calculation have been carried out using python/networkX for python (http://networkx.lanl.gov/). 2. The degree centrality DC of a node ν is defined as number of direct neighbors that connect to ν. We also consider in-degree, which is the fraction of nodes that connect incoming edges to node ν. Similarly, the out-degree is the fraction of nodes that connect outgoing edges to node ν. The DC(ν) and its directional variants are normalized by the total number of nodes N-1 in the network. 3. To further support this claim, we also calculated the point biserial correlation - a special case of a Pearson correlation coefficient using a dichotomous and a metric-scaled variable - for the edges. We found a correlation of 0.37 (p = 0.000), which indicates a more moderate relation between the INM values of the city-to-city linkages and the likelihood of being present in the empirical network produced from the primary linkage algorithm. This is lower than the centrality of cities, but this can be explained through the way in which the PLA drastically reduces the number of implausible connections such as Auckland-Lisbon, because these cities are in different world regions and both host lower level functions. The INM is paying those connections attention with relatively high connectivity values of 13.6 %. In contrast, the PLA tends to include connections with lower INM values only if one of the city hosts some high level functions. 4. Note: the degree in the directed and weighted network is the normalised aggregate of the in- and out-degree of the cities. The normalization accounts for the number of cities and firms in order to yield a value of 1.0 when all cities connect in and out to the given city for each of the individual firms.
Note: This Research Bulletin has been published in Environment and Planning B, 41 (3), (2014), 392-412 |
|||||||||||||||||||||||||||||||||||||||||||||||||||||||||||||||||||||||||||||||||||||||||||||||||||||||||||||||||||||||||||||||||||||||||||||||||||||||||||||||||||||||||||||||||||||||||||||||||||||||||||||||||||||||||||||||||||||||||||||||||||||||||||||||||||||||||||||||||||||||||||||||||||||||||||||||||||||||||||||||||||||||||||||||||||||||||||||||||||||||||||||||||||||||||||||||||||||||||||||||||||||||||||||||||||||||||||||||||||||||||||||||||||||||||||||||||||||||||||||||||||||||||||||||||||||||||||||||||||||||||||||||||||||||||||||||||||||||||||||||||||||||||||||||||||||||||||||||||||||||||||||||||||||||||||||||||||||||||||||||||||||||||||