GaWC Research Bulletin 335 |
|
|
|
A shorter version of this Research Bulletin has been published in Environment and Planning A, 42 (6), (2010), 1271-1272. doi:10.1068/a4352 Please refer to the published version when quoting the paper.
American exceptionalism has come in many forms varying from its distinctive party politics and its unusual religiosity to its particular professional sports (Lipset, 1996). With this graph we add global urban geography to the list.
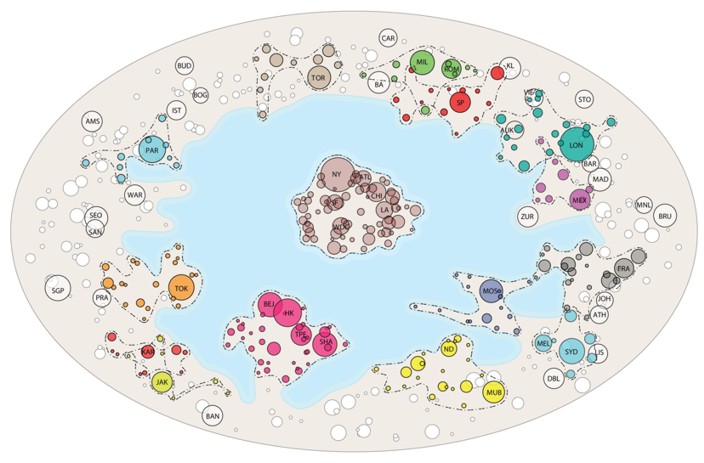
City codes: AMS Amsterdam, ATH Athens, ATL Atlanta, AUK Auckland, BA Buenos Aires, BAN Bangkok, BAR Barcelona, BEJ Beijing, BOG Bogota, BUD Budapest, BRU Brussels, CAR Caracas, CHI Chicago, DBL Dublin, FRA Frankfurt, HK Hong Kong, IST Istanbul, JAK Jakarta, JOH Johannesburg, KAR Karachi, KL Kuala Lumpur, LA Los Angeles, LIS Lisbon, LON London, MAD Madrid, MEL Melbourne, MEX Mexico City, MIL Milan, MNL Manila, MOS Moscow, MUB Mumbai, ND New Delhi, NY New York, PAR Paris, PRA Prague, ROM Rome, SGP Singapore, SAN Santiago, SEO Seoul, SF San Francisco, SHA Shanghai, SP São Paulo, STO Stockholm, SYD Sydney, TOK Tokyo, TOR Toronto, TPE Taipei, VIE Vienna, WAR Warsaw, WDC Washington DC, ZUR Zurich
The graph derives from a visualization exercise to aid in presenting our world city network research. The data used is from the latest monitoring of the world city network in which the office networks of advanced producer service firms are studied in cities across the world. The methodology was first devised for a data collection in 2000 and consists of creating a service values matrix' arraying cities against firms. The matrix cells contain service values indicating the importance of a city office to a firm's office network. These are coded from 0 (the firm has no presence in the city) through to 5 (for the city housing its headquarters) (Taylor et al, 2002). Using the interlocking network model (Taylor, 2001), this service values matrix can be converted into a city x city matrix in which the cells contain estimated work flows between cities. It is just such an inter-city matrix that is analyzed here. The latest data collection exercise was undertaken in the first half of 2008 and featured 175 firms and 526 cities. The firms were selected from world rankings by sector (the top 75 financial services firms, plus the top 25 firms in accountancy, advertising, law and management consultancy). Cities were selected based upon past researches plus further inclusions using three criteria: (i) all capital cities of countries with over a million population, (ii) all cities housing headquarters of firms in the Forbes 2000, and (iii) all cities with a population over 1.5 million (Derudder et al, 2010). The resulting interlocking network analysis found 20 isolates (no firm presences) so that the inter-city matrix for analysis is 506 x 506. In addition we record the country location of each city for inclusion in the analysis. This is a break from our previous world city analyses that have been explicitly transnational in execution. However, interpretations of the latter have brought states into the discussion and here we go one step further through incorporation of states into the analysis. The resulting cities-and-states analysis is anchored in the interlocking network model but with state boundaries added to the mix. The inter-city matrix can be represented as a network, where cities are identified as nodes and the estimated work flows as weighted links between nodes. This allows us to apply social network analysis methods to represent and analyze the data; here we have worked with the visualization software NetDraw (Borgatti, 2002). We have created our graph using the spring embedding algorithm on the 506 x 506 inter-city matrix. This algorithm is designed to bring some visual order to large and dense networks such as the world city network. It assigns forces to every link, which can be represented by springs hence the name spring embedding'. When the algorithm is run there are two contrary effects: a repelling force is applied when nodes (cities) are too close together and an attractive force operates when nodes (cities) are too far apart. The strength of these forces is derived from the network link values; in this case the estimated work flows between cities. In this way the positions of nodes (cities) change continuously within the graph, throughout iterations, until an approximate equilibrium is reached (Di Battista et al, 1994). In our application of the spring embedding algorithm we add three specific features to the graph. First, the sizes of the nodes are drawn proportional to city connectivities; basically the bigger the node the more integrated the city into the world city network (Taylor, 2004). The top 50 cities in terms of connectivity are identified on the graph (plus Karachi, outside the top 50 but the main city of Pakistan, one of the states featured, see below). Second, we constrained the iterative process by the country location of cities thereby producing the grouping of cities (nodes) belonging to the same state. In this way country grouping' adds up the connectivity of each single city, so that the most connected countries are located in the centre of the graph. To ease legibility, not all state boundaries are added to the graph; these are shown for just the 15 states with seven or more cities in our data. States can be identified by their colour-coded cities. Third, the graph produced an unexpected large empty area. Because this is important to our interpretation we identify this region using a distinctive colour. On this graph the US cities could hardly be more exceptional. They cluster as an island' at the centre of the world with no other cities nearby. All the remaining cities form an outer ring away from the USA. Generally speaking Asian cities are to be found in the southern' parts of the ring, and European cities share the northern' part of the ring with Latin American cities. The American island appears to be weighted towards the north' by the presence of Chicago, Atlanta and, above all, New York. In the European cities in the north', none of the major nodes are as coastal' as New York. In fact, this region tends to be fairly transnational with overlapping state boundaries. In contrast, for the Asian cities in the south', such overlapping is much rarer, and more leading cities are coastal' (i.e. facing the centre). This is very much the case with China as its four leading cities seem to be pulling the country into the centre of the graph. China appears to be drawing away from its rivals in reaching for the centre: it is cutting off a faltering Japan, faces a weak challenge from Russia, while India, especially Mumbai, has yet to begin its push. China 's challenge to American centrality, and maybe its exceptionalism, could hardly be more clearly displayed. In the medieval world, the famous Mappa Mundi had Jerusalem at its centre; our contemporary Mappa Mundi has the USA so positioned. But for how much longer? AcknowledgementsThe ESRC funded the research of which this graph is a part (RES-000-22-3575). We thank Professor Pengfei Ni and his team at the Chinese Academy of Social Sciences (Beijing) and Professors Ben Derudder and Frank Witlox and their team at Ghent University for collaborating with us to create the data. Mark Szegner's help was invaluable in producing the final graph. ReferencesDi Battista G, Eades P, Tamassia R, Tollis I G, 1994, Algorithms for drawing graphs: an annotated bibliography Computational Geometry: Theory and Applications 4 235-282 Borgatti S P, 2002 NetDraw: Graph Visualization Software (Analytic Technologies, Harvard) Derudder B, Taylor P J, Ni P, De Vos A, Hoyler M, Hanssens H, Bassens D, Huang J, Witlox F, Yang X, 2010, Pathways of growth and decline: connectivity changes in the world city network, 2000-2008 Urban Studies (in press) Lipset S M, 1996 American Exceptionalism: A Double-edged Sword (W.W. Norton, New York) Taylor P J, 2001, Specification of the world city network Geographical Analysis 33 181-194 Taylor P J, 2004 World City Network: A Global Urban Analysis (Routledge, London) Taylor P J, Catalano G, Walker D R F, 2002, Measurement of the world city network Urban Studies 39 2367-2376
NOTE* Sandra Vinciguerra, Peter J. Taylor, Michael Hoyler, Department of Geography, Loughborough University, email: S.Vinciguerra@lboro.ac.uk, P.J.Taylor@lboro.ac.uk, M.Hoyler@lboro.ac.uk ** Kathy Pain, School of Real Estate & Planning, University of Reading, email: k.pain@reading.ac.uk
Note: This Research Bulletin has been published in Environment and Planning A, 42 (6), (2010), 1271-1272 |
||