GaWC Research Bulletin 294 |
|
|
|
This Research Bulletin has been published in Tijdschrift voor Economische en Sociale Geografie, 100 (2), (2009), 250-259. doi:10.1111/j.1467-9663.2009.00533.x Please refer to the published version when quoting the paper.
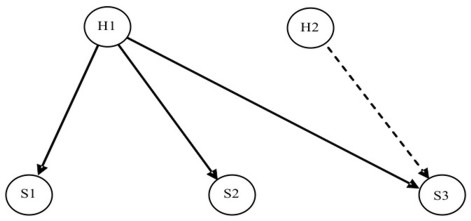
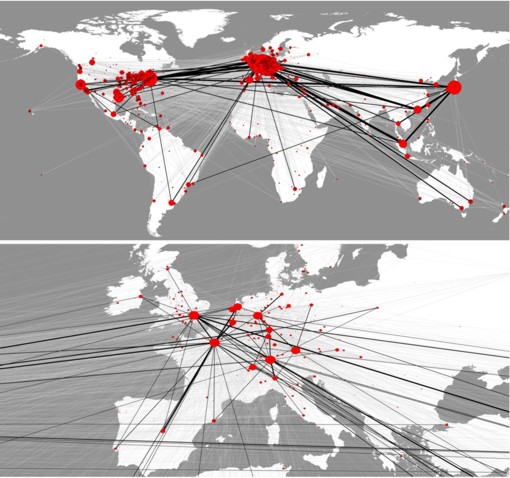
INTRODUCTIONThe Dutch Randstad region is a poly-centric metropolitan region in the Netherlands comprised mainly of Amsterdam, Rotterdam, The Hague and Utrecht and forms one of the largest agglomerations in Europe (OECD 2007). The Randstad generates approximately 50 percent of Dutch business interactions, though it has been found that the economic activity within the urban regions of these cities is much larger than that between them (Van der Knaap 2002). There is no true regional integration between the cities and each city claims its strong share of connections within its own boundaries (Van Oort et al. 2006). Furthermore, economically speaking these cities operate more internationally than nationally (Wall & Van der Knaap 2008). Nonetheless, most national planning policies (e.g., Randstad 2040) still consider the proximity of cities as decisive to their economic performance, neglecting their transnational networks (Van Oort et al. 2006; Taylor et al. 2008). This is odd, considering the many studies (e.g., Camagni and Salone 1993; Batten 1995; Davies 1998; Carroll 2007) that stress the need for an intellectual transition in the conceptualization of urban external relations (Meijers 2007). In place of such an approach, planning and policy could begin to understand cities as places of multiple relational assets and resources (Massey 1993; Graham & Marvin 1999). By understanding a city's position and its linkages to other cities worldwide, policymakers can engage with competitor and collaborator cities that are specifically important to them. But what type of networks should be taken into account? Most worldwide city network research focuses on corporate relations between cities as a vital determinant of urban performance (Friedmann 1987; Taylor 2004; Alderson & Beckfield 2004). Similarly, this study focuses on worldwide intercity networks of multinational corporations (MNCs) and their subsidiaries, as these are central to the development of cities (Rugman 2005). This idea has been empirically demonstrated in a study by Wall et al. (2007), which found that the total corporate connectivity of cities correlates highly with economic indicators such as GDP, global competitivity, technology, innovation, and business sophistication. Evidence of this correlation was found in the global, European and Dutch corporate networks. The importance of MNCs to city development has led to an increase in the spatial reach of a city: a variety of spatial scales are utilized, and firms operate on local and regional networks as well as global ones (Van der Knaap 2007). This leads to a move from hierarchical central place structures to non-hierarchical network structures (Meijers 2007; Taylor et al. 2008), in which a dual system of understanding is required (Hohenberg & Lees 1985, pp 58-59). Furthermore, cities link many types of network together at the local, supra-regional and global scales, and, in terms of rankings, cities may occupy different positions on each of these network scales (Van der Knaap 2007, pp. 13). Although all MNCs have global reach, they differ by economic size and geographic location, which subsequently determine the total number of corporate connections cities have and the strengths of the ties between cities. Accordingly, the research question is what the scalar differences of intercity corporate networks will be, which are derived from three size categories of MNC headquarter and geographic locality. The first concerns the global top 100 multinational headquarters and their subsidiary networks across the globe. The second concerns the top 100 multinational headquarters located in Europe and their worldwide subsidiary relations; and the third network concerns the top 100 multinationals situated in The Netherlands and their worldwide subsidiaries. We are specifically interested in how the positions of the four Randstad cities (Amsterdam, Rotterdam, The Hague and Utrecht) vary within these networks. CITY RANKING AND CORPORATE NETWORKSMNCs are central agents in the development of the world city system, where it has been shown that MNCs are wealthier than most countries (United Nations, 2002) and that the top 500 MNCs (2004) account for 90% of world FDI and 50% of global trade (Rugman 2005). However, research on worldwide networks is scarce (Smith and Timberlake, 1993), and most research has been based on attribute data, in which comparative results are shown but not relational ones (Taylor 2004). Nonetheless, a few studies on worldwide city networks do exist, such as analyses on global advanced producer service networks (Beaverstock et al. 2000), the corporate ties of the world's 500 largest MNCs (Alderson & Beckfield 2004) and worldwide inter-corporate directorships (Carroll 2007). This type of analysis is unique because cities obtain relative importance because of their relationships to other cities (Harvey 2006). The results of these studies, however, cannot be easily compared to each other, and they do not show nuances in networks generated by different corporate typologies. This paper is aimed at showing the differences in networks generated by three independent but highly comparable levels of corporate network in which variations in the relative importance of the main Randstad cities will be assessed. Since the 2nd World War, the Dutch national government has demonstrated a constant concern with the spatial development of the country. Out of this concern, a national planning policy has been designed aimed at strengthening the social, economic and spatial structure of the Randstad. It is only recently, however, that the concept of city networks have been incorporated, e.g., in the preliminary 5 th report (VROM 2001) and the Economic Strategy Randstad (Regio Randstad 2006), whose goal is to turn the Randstad into an internationally competitive network metropolis. In these studies, it is argued that this will be achieved by strengthening the spatial integration of the region. According to research by the Netherlands Institute for Spatial Research (RPB), however, the degree to which the Randstad forms a coherent system of complimentary cities is questionable (Van Oort et al. 2006). Instead, these cities interact more with their direct proximate environments and in international networks (Wall & Van der Knaap 2008). It is therefore uncertain whether current policy is targeting the correct scale of interventions, and it appears that their instruments are essentially spatially oriented with little knowledge of functional network relationships (Van Oort et al. 2006). The persistence of thinking in terms of geographic proximities is odd considering the amount of literature today that indicates how advances in transport and communication technology and the growth of multinational networks have had a significant impact on the spatial economic structure of cities and regions (Camagni and Salone 1993; Batten 1995). Hence, planning and urban policy practice may need to start representing cities as multiple layers of relational assets and resources (Massey 1993; Graham and Marvin 1999). Although past studies have focused mainly on attribute data (economic performance, creativity innovativeness, and access and quality of services) to measure the relative importance of cities, today the economic development of cities is essentially determined by patterns of interaction between cities (Taylor 2004) and is less dependent on what remains fixed within them (Amin and Graham 1999; Castells 2001). Hence, we focus on the network positions of cities in worldwide corporate networks to determine their relative importance. The importance of intercity relations was already stressed by Jacobs (1969), who argued that a city's economic development does not result by servicing its hinterland, but by economic networks between cities. In this sense, central place theory (Christaller 1933) is complimented by a central flow theory' in the form of an interlocking network model (Taylor et al. 2008). Yet, the relative importance of cities may differ across hierarchic scales (Van der Knaap 2007); accordingly, this study examines the relative importance of the Randstad cities in worldwide corporate networks at different corporate scales. THREE SCALES OF CORPORATE NETWORKSThe network data used in the analyses concern corporate shares or investments from MNC headquarters to their many subsidiaries. Three independent datasets have been compiled using Fortune, Lexis-Nexus and Reach sources. Each dataset originates with the top 100 headquarters at a given scale (global, European and Dutch). Next, data on all subsidiaries and their locations were collected for each network scale. Aggregating the data on interactions between MNC headquarters and their subsidiaries to the city-level, I obtained worldwide corporate networks between cities. To make the three scales comparable, the data was restricted to include only those cities that are found in all three scales of corporate networks. Of the thousands of cities, only 199 fitted this criterion. Nonetheless, these 199 international cities proved to be the most important, because they held approximately 90% of the total connectivity found in each of the three datasets. It is important to note that, although the headquarter locations of each scale are restricted to three geographic zones (global, European, The Netherlands), their subsidiary networks are worldwide. Two network measures have been used in this study, namely outdegree and indegree. These are measures signifying the directionality of corporate investments between firms and can be best explained by means of the provided network diagram (Figure 1). In this we see that an MNC headquarter (H1) is situated in a particular city, with three subsidiaries (S1, S2, and S3) in other cities. The arrow direction indicates that (H1) owns shares in these three subsidiaries, which in network terminology is called the outdegree (Wasserman and Faust 1994). In this case, headquarter city (H1), has an outdegree of three. It is a measure of how much economic power or command a city exerts over others. Conversely, the three subsidiary cities each have an incoming sharehold from (H1), called the indegree (Wasserman and Faust 1994). This is a measure of the dependency of other cities upon a particular city. Furthermore, looking at subsidiary city (S3), it is clear that it also has an inward sharehold from (H2), meaning that it has a total indegree of two, hereby showing that indegree is also dependent on the number of headquarter cities that connect with a particular subsidiary city. The three corporate datasets have been organized into adjacency matrices of headquarters cities by subsidiary cities. UCINET network analysis software (Borgatti et al. 2003) was used to analyze the data. CITY RANKING AND LINKAGE STRENGTHS WITHIN THREE NETWORKSBy mapping the global top 100 network, the spatial configuration of the corporate networks is revealed (Figure 2). In this map, the distribution of corporate shareholds between nations is clearly polarized into three core regions (North America, Europe and Pacific Asia). These regions claim 98% of all outwardly directed relations (outdegree) over other nations, displaying a disproportionate amount of power over the world. Furthermore, these areas claim 82% of all incoming relations (indegree), showing how dependent the world is on these cores. It is evident that a clear North-South divide still exists; Africa, for instance, holds only approximately 1% of MNC relations. It is also evident that although there is a clear degree of East-West connectivity, the highest intensity prevails in the transatlantic zone between Europe and North America. The Randstad cities clearly fall within the primary economic zone of the world (see the rank position of the Randstad cities in Table 1). Zooming in onto Europe in the same map, the detailed ties within the European region are seen (bottom map). Amsterdam and The Hague are evidently important, but they are subordinate to larger cities like Paris and London, while Rotterdam and Utrecht play a moderate role at this scale. Table 1 contains centrality scores of the top 100 headquarter networks at the three corporate scales. Each subsequent scale represents the outdegree and indegree and related city ranking. In the global sample we see that, globally, New York is 1 st in terms of both headquarter and subsidiary relations, and that its dominance is in command functions. Düsseldorf is 2nd, Munich 3rd and Zurich 4th, proving to be the top global headquarter cities, where London at 6th position, Paris 7th and Tokyo 22nd are weaker than expected. Tokyo, although an Asian regional powerhouse, is evidently not entirely the global contender it is often claimed to be. However, in subsidiary relations, London is 2 nd, showing that many individual cities are highly dependent on it. Concerning the Randstad (G4) cities, we see that, in terms of outdegree, Amsterdam claims 9 th position and The Hague 11 th position in the global economy. The Hague's position is strongly related to Shell's presence in this city. Furthermore, we see that Rotterdam and Utrecht do not have headquartered functions within the global dataset. However, considering subsidiary relationships, Rotterdam ranks 21st and Utrecht 31st. In terms of subsidiaries, The Hague drops down to 32nd place, meaning that it is not so important to other cities at this scale. Furthermore, even if we sum up the connections of the four Dutch cities, the relative strength of the combined Randstad only reaches 5th position. Hence, the Randstad's global position is highly dependent on the corporate activities of Amsterdam. Regarding linkage strengths (Table 2), Amsterdam has strong outdegree or command over subsidiaries in Paris, Brussels and Hong Kong, while, alternatively, Amsterdam has indegree relations with headquarters situated in Brussels, Paris, Dusseldorf and London. This evidence reveals the two-way flow or cooperation between cities, which specifically characterizes central flow theory 'in contrast to central place theory' (Taylor et al. 2008). The second dataset provides similar results but concerns worldwide networks generated by the top European 100 MNC headquarters (Table 1). It is evident that Paris and London have risen, relative to the ranking in the global network, to 1st and 2nd position, in both headquarter and subsidiary functions, followed Zurich. The most important non-European subsidiary cities are Singapore 6th, Hong Kong 8th and Buenos Aires 10th. Looking at the positions of Randstad cities, we see a higher ranking than in our comparisons at the global scale. We also see that Amsterdam now ranks 4th as a headquarter city, meaning that it is arguably more important to the European network than to the global one. Furthermore, we see that Utrecht ranks 30th and Rotterdam 38th such that they have achieved moderate headquarter status within this network, while The Hague's headquarter status has become relatively less important, arguably because its petroleum operations (Shell) are more important to the world than to Europe. In this dataset, Amsterdam, for instance, has strongest outdegree relations with London, Zurich and Tokyo (Table 2) and is alternatively highly controlled by headquarters in Paris, Vevey, Munich, Brussels and London. At the next scale, we explore networks generated by The Netherlands top 100 corporate network, where it is evident that in terms of outdegree, Amsterdam ranks 1st, Utrecht 2nd, Rotterdam 3rd and The Hague 4th (Table 1). In terms of indegree, Dutch subsidiaries at this network level are far more important to international cities like London 2nd, and Paris 3rd, than to other Dutch cities (Table 1). This shows that the main corporate relations of the Randstad are strongly related to cities outside The Netherlands. Looking at which cities are most connected to the Randstad top four (Table 3), we can see that Amsterdam's strongest outdegree linkages are to subsidiaries within Amsterdam, and its second strongest connection is to Paris. Rotterdam is primarily connected to London, secondly to Walton on Thames and thirdly to The Hague, before being connected within itself. Utrecht is mostly oriented towards Amsterdam, but also strongly connects to other tertiary type cities like Luxembourg and Brussels. It is also highly connected to Willemstad (Dutch Antilles), possibly due to offshore banking. The Hague is firstly linked to Wilmington, due to Wilmington's importance in petroleum insurance. Looking at the internal relations between Dutch cities, we see that Amsterdam and Utrecht are powerfully connected, while Rotterdam and The Hague have moderate ties to each other (Wall & Van der Knaap, 2008). Nonetheless the former two cities are poorly connected to the latter two cities, verifying that Randstad cities are only weakly connected to each other (Van Oort et al., 2006). CONCLUSIONIt has been shown in this study that different sizes and localities of MNC headquarters will reveal different types of networks at different corporate scales. From the structures of the different network scales, it can be shown that the relative importances of Randstad cities differ across the global, supra-regional and local scales. Amsterdam turns out to be relatively important at all three corporate scales, The Hague ranks high at the global and local scale, while Utrecht and Rotterdam only show importance on more local corporate scales. Furthermore it has been shown that other Dutch cities have little relative importance in global, European and Dutch networks, and that the four Randstad cities prove to operate more with international cities than with other Dutch ones. This study clearly shows the importance of studying different scales of corporate networks, since, as can be easily seen from the results, no individual network can give complete insight into the nature of cities. The fact that the three datasets reveal different knowledge about the roles of Randstad cities in corporate networks can be interesting to different levels of governmental policy. For local policy, for example, the strengthening of ties between Randstad cities can be of interest, as well as the reinforcement of existing ties to other international cities e.g., London and Paris. At the global scale, the powerful role of Amsterdam and The Hague in the world economy can be of interest to Dutch international policy. The Hague's strength, however, appears to be highly attributable to the presence of Shell and related subsidiaries. Lastly, because Randstad cities prove to be far more dependent on international cities than on local ones, it is interesting to reconsider, in this light, policy concerning the future of the Randstad: the usual view that local cohesiveness is essential to strengthening the Randstad's economic performance might need to be revised. REFERENCESALDERSON, A.S. & J. BECKFIELD (2004), Power and Position in the World City System. American Journal of Sociology 109, pp. 811-851. AMIN, A. & S. GRAHAM (1999), Cities of Connection and Disconnection. In: J. ALLEN, D. MASSEY & M. PRYKE, eds., Unsettling Cities, pp. 7-38. London: Routledge. BATTEN, D.F. (1995), Network Cities: Creative Urban Agglomerations for the 21st Century. Urban Studies 32, pp. 313-327. BEAVERSTOCK, J.V., R.G. SMITH & P.J. TAYLOR (2000), Globalization and World Cities: Some Measurement Methodologies. Applied Geography 20, pp. 4363. BORGATTI, S.P., M.G. EVERETT & L.C. FREEMAN (2002), Ucinet for Windows: Software for Social Network Analysis. Harvard: Analytic Technologies. CAMAGNI, R. & C. SALONE (1993), Network Urban Structures in Northern Italy: Elements for a Theoretical Framework. Urban Studies 30, pp. 1053-1064. CARROLL, W.K. (2007), Global Cities in the Global Corporate Network, Environment and Planning A 39, pp. 2297-2323. CASTELLS, M., (2001), The Rise of the Network Society. Oxford: Blackwell. CHRISTALLER, W. (1933), Die Zentralen Orte in Süddeutschland. Jena: Gustav Fischer Verlag. DAVIES, W. K. D. (1998), Urban Systems Research: Unfulfilled Promises? Canadian Journal of Regional Science 11, pp. 349-356. FRIEDMANN, J. (1986), The World City Hypothesis. Development and Change 17, pp. 69 147. GRAHAM, S. & S. MARVIN (2001), Splintering Urbanism: Networked Infrastructures, Technological Mobilities and the Urban Condition. London: Routledge. HARVEY, D. (2006), Spaces of Global Capitalism: Towards a Theory of Uneven Geographical Development. London: Verso. HOHENBERG, P.M. & L.H. LEES (1985), The Making of Urban Europe, 1000-1950. Cambridge MA: Harvard University Press. JACOBS, J. (1969), The Economy of Cities. New York: Vintage. MASSEY, D, (1993), Mapping the Futures: Local Cultures, Global Change. New York: Routledge. MEIJERS, E. (2007), From Central Place to Network Model: Theory and Evidence of a Paradigm Change. Tijdschrift voor Economische en Sociale Geografie 98, pp. 245-259. OECD, (2007), Territorial Review: Randstad, Netherlands. Paris: OECD Publications. REGIO RANDSTAD, (2006), Randstadmonitor - Economic Strategy Randstad (ESR), Brussels: Huis van de Nederlandse Provincies. RUGMAN, A. (2005), The Regional Multinationals. Cambridge: Cambridge University Press. SMITH, D. A. & M. TIMBERLAKE (1993), World Cities: A Political Economy - Global Network Approach. Research in Urban Sociology 3, pp. 181 207 TAYLOR, P. J., (2004), World City Network. London: Routledge. TAYLOR, P.J., M. HOYLER & R.VERBRUGGEN (2008), External Urban Relational Process: Introducing Central Flow Theory to Complement Central Place Theory. GaWC Research Bulletin 261, http://www.lboro.ac.uk/gawc/rb/rb261.html. UNITED NATIONS, (2002), World Investment Report 2002. Geneva: United Nations Publication. VAN DER KNAAP, G.A, (2002), Stedelijke Bewegingsruimte: Over Veranderingen in Stad en Land. The Hague: SDU Publishers. VAN DER KNAAP, G.A, (2007), Urban Network Development under Conditions of Uncertainty. In: P.J TAYLOR, B. DERUDDER, P. SAEY & F. WITLOX. eds., Cities in Globalization, pp. 89-107. London: Routledge. VAN OORT, F.G., VAN BRUSSEL, J., RASPE, O., BURGER, M., VAN DINTEREN J. & VAN DER KNAAP, G.A., (2006), Economische Netwerken in de Regio. Rotterdam: Nai Uitgevers. VROM (2001), Startnota van 5de Rapport Ruimtelijke Ordening. Ministerie van VROM, The Hague. WALL, R. S., & G.A. VAN DER KNAAP (2008), Glocal Footprint: Network Sustainability within Global, European and Dutch Corporate Systems. Bilthoven: Netherlands Environmental Assessment Agency (MNP). WALL, R.S., G.A. VAN DER KNAAP & W. SLEEGERS (2007), Sustainability within a World City Network. Bilthoven: The Netherlands Environmental Assessment Agency (MNP). WASSERMAN, S. & K. FAUST (1994), Social Network Analysis: Methods and Applications. Cambridge: Cambridge University Press. NOTE* Ronald Wall, Department of Applied Economics, Erasmus University Rotterdam. Email: wall@few.eur.nl
Table 1: Outdegree and Indegree of Global, European and Dutch Corporate Networks (data 2005/2006)
Table 2: Amsterdam's Linkage Strengths with other Cities at Global, European and Dutch Network Scales
Table 3: Outdegree Strengths of Randstad cities, within the Top 100 Dutch Corporate Network (data 2005/2006)
Figure 1: Diagram to Explain Headquarter and Subsidiary Relations
Figure 2: GIS Maps of Global Top 100 Multinational Networks.
Note: This Research Bulletin has been published in Tijdschrift voor Economische en Sociale Geografie, 100 (2), (2009), 250-259 |
|||||||||||||||||||||||||||||||||||||||||||||||||||||||||||||||||||||||||||||||||||||||||||||||||||||||||||||||||||||||||||||||||||||||||||||||||||||||||||||||||||||||||||||||||||||||||||||||||||||||||||||||||||||||||||||||||||||||||||||||||||||||||||||||||||||||||||||||||||||||||||||||||||||||||||||||||||||||||||||||||||||||||||||||||||||||||||||||||||||||||||||||||||||||||||||||||||||||||||||||||||||||||||||||||||||||||||||||||||||||||||||||||||||||||||||||||||||||||||||||||||||||||||||||||||||||||||||||||||||||||||||||||||||||||||||||||||||||||||||||||||||||||||||||||||||||||||||||||||||||||||||||||||||||||||||||||||||||||||||||||||||||||||||||||||||||||||||||||||||||||||||||||||||||||||||||||||||||||||||||||||||||||||||||||||||||||||||||||||||||||||||||||||||||||||||||||||||||||||||||||||||||||||||||||||||||||||||||||||||||||||||||||||||||||||||||||||||||||