GaWC Research Bulletin 289 |
|
|
|
This Research Bulletin has been published in Environment and Planning A, 41 (1), (2009), 7-12. doi:10.1068/a41318 Please refer to the published version when quoting the paper.
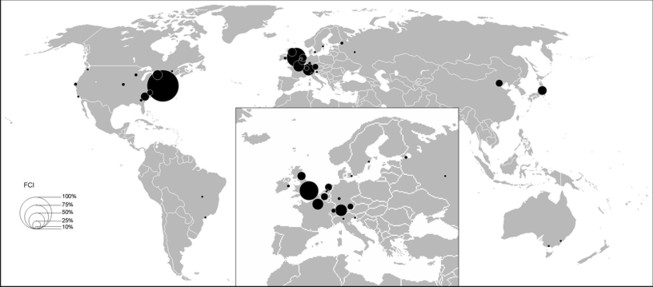
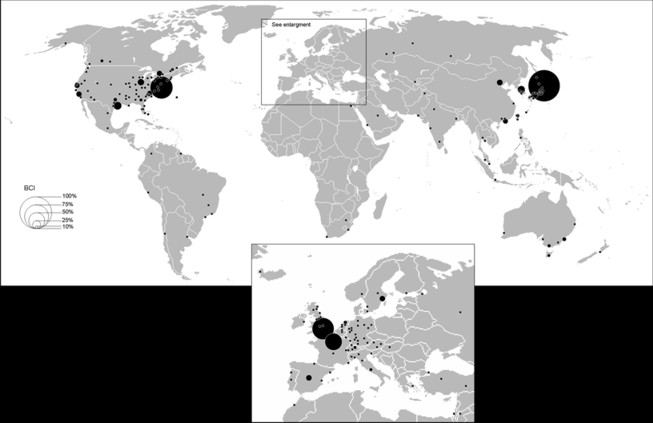
INTRODUCTIONThis is a short note to take stock of where we were before the financial crisis began to seriously undermine the global economy in late 2008. For once the phrase to turn the world upside down' could hardly be more merited: the most right wing US President in living memory is accused by members of Congress in his own party of being a Bolshevik' pursuing financial socialism' while in the UK the New Labour' government is being praised for nationalising more of the British economy than the most socialist, post-1945 Labour government ever did. Instead of the diminution of the state, the era of neo-liberal globalization appears to have culminated in a reassertion of state economic power: place-based public finance has come to the rescue of flow-based private finance. At GaWC1 we have been researching contemporary economic globalization through cities and their networks for the last decade. Building upon the pioneering work of Reed (1981) on international financial centres, Friedmann (1986) on the world city hierarchy and Sassen (1991) on the global city, we have explored the role of leading cities in globalization through developing new models (the interlocking network model (Taylor 2001)) and collecting new customised data on the firms that are interlocking' the cities (Taylor et al 2002) to provide a theoretically-informed and empirically-based view of the global space economy (Taylor 2004; Taylor et al 2006). Continuing a decade-long concern for mapping the global economy through the networking practices of firms in cities, we joined forces with the Global Urban Competitiveness Project (GUCP) at the Chinese Academy of Social Sciences (Beijing) in late 2007 to carry out a new large-scale data collection exercise for 2008. As well as garnering information on 200 office networks of firms across 526 cities, we also collected place-based information on the cities, notably the headquarter locations of the Forbes global 2000 list of firms.2 All this data collection was carried out in the first half of 2008. Thus we have data sets that capture the geography of the global space economy just before the financial crisis came to a head. Thus this paper is written to provide a glimpse of the way we were' just a few months ago. In this paper we focus on the command and control functions of cities emphasized originally by Friedmann (1986), also included as part of Sassen's (1991) global city, and more recently analysed by Godfrey and Zhou (1999) and Anderson and Beckfield (2004). We have carried out preliminary analyses of headquarter locations for both the leading 75 financial services firms (banks and insurance) and for the largest 2000 firms (from all sectors) as defined by the Forbes global 2000. The tables and maps that follow can be used as the backcloth for easy reference as the financial crisis unfolds and morphs into an economic depression or deep recession. So far the financial crisis has heralded surprise after surprise; following the losers and winners in this process over the coming months will likely continue this apparent serendipity. THE VERY RECENT GEOGRAPHY OF THE 'MASTERS OF THE UNIVERSE'Finance is at the heart of the geo-economic transition we are experiencing with its practitioners being demoted from seemingly all-powerful masters of the universe' to despised greed merchants who conned us into spending too much. We focus upon the geography of the headquarters of financial services firms when still masters of the universe: it shows where the score of the crisis was orchestrated. There are 75 financial service firms in our data. To measure a city's importance as a command and control centre we use the rankings of their banks and insurance firms in terms of corporate size as given by the Forbes composite index, a measure that combines rankings for sales, profits, assets and market value.3 A Financial Command Index (FCI) is computed for each city as follows: each city with a top five firm headquarters scores 10; cities with headquarters of firms ranked 6 to 10 score 8; 11 to 20 score 6; 21 to 30 score 5; 31 to 40 score 4; 41 to 55 score 3; and 56 to 75 score 2. These scores are summed for each city and the index is then expressed as percentages of the city with the highest sum. The results of this exercise are shown in Figure 1. Clearly this command function is highly concentrated with only 35 cities featured and all but six in North America and Europe. New York stands out as the dominant city but Western Europe is the most dominant world region in financial command and control centres. In Table 1 the top twenty cities are listed in terms of FCI. Here we see the degree of New York's dominance with only London having more than half of New York's FCI. The relative decline of Tokyo's banks since 1990 is shown by the city's 6th ranking. Even at this early stage in the transition we can note some losers and winners: Charlotte and Edinburgh are, perhaps, surprise top ten entries but they are unlikely to retain this pre-eminence: Wachovia's demise will hit Charlotte and Edinburgh's HBOS and Royal Bank of Scotland are the UK's two biggest losers. Outside the top ten, the high global ranking of Brussels (11th) and Washington, DC (13th) neither political world city is renowned for its banks internationally - will be adjusted downwards as Fortis in Belgium disappears and Freddie Mac and Fanny Mae get down-sized after their nationalization. But this is certainly not the end of the story. THE VERY RECENT GEOGRAPHY OF ALL MAJOR CONTROL AND COMMAND CENTRESAt the time of writing, one major worry among political decision-makers is whether the chaos in the financial sector will diffuse to the rest of the world economy. It is clearly wishful thinking to believe that such a process can be avoided given the depth of the financial crisis. We have computed a Business Command Index (BCI) based upon the top 2000 firms in the world, once again using Forbes' composite index. BCI is computed for each city as follows: each city with a top fifty firm headquarters scores 12; cities with headquarters of firms ranked 51 to 100 score 11; 101 to 200 score 10; 201 to 300 score 9; 301 to 400 score 8; 401 to 500 score 7; 502 to 600 score 6; 601-700 score 5; 701-800 score 4; 801-1200 score 3; 1201-1600 score 2; and 1601 to 2000 score 1. These scores are summed for each city and the index is then expressed as percentages of the city with the highest sum. The results of this exercise are shown in Figure 2. Obviously with many more firms analysed the distribution is more widespread across the world. However, the North American and European world regions remain very important and this time they are joined by North East Asia (Japan in particular). But the overwhelming feature of this figure is the dominance of just four cities. Table 2 shows these four cities with Tokyo now the leading command and control centre followed by New York, London and Paris; the latter has more than double the BCI of the next ranked city. Houston is in fifth place as the world's oil and gas control and command centre. The USA, Japan and China have multiple entries in this table; the remainder are leading cities of medium-sized national economies. What will happen to cities in Figure 1 and Table 2 is difficult to guess: there have been no major collapses outside the financial sector yet. The degree of change will depend on the depth of economic downturn but some sectors at the forefront of fashionable consumer economy are likely vulnerable. CONCLUSIONIt is a strange experience carrying out analyses on our latest data in order to produce instant history', as it were. But this is not at all disheartening. Careful analysis of the global spatial economy as it existed in early 2008 will provide specific results to compare with whatever the geo-economic transition leads to in the near future. Will the demise of neo-liberal globalization bring in its wake a lessening of economic globalization overall? Or will a new economic globalization be created in which the discarding of neo-liberalism leads to less geographical concentration of command and control? We cannot know now but we will know soon. Unintentionally, our latest GaWC research has placed us in an ideal position to do contemporaneous before and after analyses' of one of the great geo-economic transitions. REFERENCESAlderson, A S and Beckfield, J, 2004, Power and position in the world city system American Journal of Sociology 109 811-851 Friedmann, J, 1986, The world city hypothesis Development and Change 17 69-83 Godfrey, B J and Zhou, Y, 1999, Ranking world cities: multinational corporations and the global urban hierarchy Urban Geography 20 268-281 Reed, H C, 1981 The Preeminence of International Financial Centers (Praeger, New York) Sassen, S, 1991 The Global City (Princeton University Press, Princeton, NJ) Taylor, P J, 2001, Specification of the world city network Geographical Analysis 33 181-194 Taylor, P J, 2004 World City Network: A Global Urban Analysis (Routledge, London) Taylor, P J, Catalano, G and Walker, D R F, 2002, Measurement of the world city network Urban Studies 39 2367-76 Taylor, P J, Derudder, B, Saey, P and Witlox, F, 2006 Cities in Globalization (Routledge, London)
NOTES* Peter J. Taylor, Michael Hoyler, Kathy Pain, Wei Shen, Department of Geography, Loughborough University, UK. Email: P.J.Taylor@lboro.ac.uk ** Pengfei Ni, Fengyong Lu, Chinese Academy of Social Sciences, PRC. *** Ben Derudder, Frank Witlox, David Bassens, Department of Geography, Ghent University, Belgium. **** Jin Huang, Xiaolan Yang, Beijing University of Post and Telecommunication, PRC. 1. GaWC is the Globalization and World Cities Research Network based at Loughborough University and which operates electronically through its website: www.lboro.ac.uk/gawc. It has become a leading academic think tank on cities in globalization through harnessing researchers from across the world: in the research reported here GaWC researchers from Loughborough and Ghent Universities have collaborated with the Global Urban Competitiveness Project (GUCP) at the Chinese Academy of Social Sciences (CASS) in Beijing. 2. Published annually at Forbes.com. 3. According to Forbes.com, the reason why this composite score is computed is that any one component alone may give a misleading impression of corporate size.
Table 1: Financial Command Index: the top 20 cities in early 2008
Table 2: Business Command Index: the top 20 cities in early 2008
Note: This Research Bulletin has been published in Environment and Planning A, 41 (1), (2009), 7-12 |
|||||||||||||||||||||||||||||||||||||||||||||||||||||||||||||||||||||||||||||||||||||||||||||||||||||||||||||||||||||||||||||||