GaWC Research Bulletin 244 |
|
|
|
This Research Bulletin has been published in Urban Studies, 45 (11), (2008), 2323-2342. Please refer to the published version when quoting the paper.
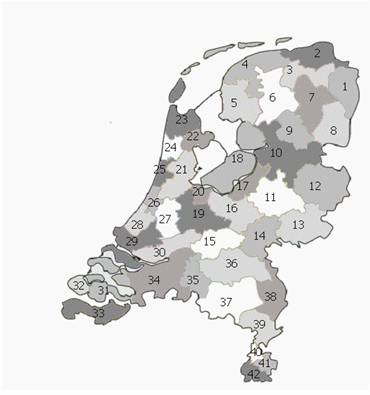
IntroductionIn many European countries and regions, sets of distinct but proximally-located and well-connected cities have become the object of regional development policies and strategic spatial planning policies. Policy practice often refers to such sets of cities as city networks' or urban networks' (Meijers, 2005), though in the literature, such regions are often referred to as polycentric or polynuclear urban regions (PURs). Examples include large metropolitan regions as the Dutch Randstad region or the German Rhine-Ruhr region, but increasingly often, PURs of a more modest size are identified, for instance the Städtenetze' in Germany, the réseaux de villes' in France or the urban networks in the Netherlands. Policy-makers assume that taking a set of small or medium-sized cities together opens up possibilities for regional economic growth. Taken individually, these cities fear being overlooked, but taken together they would be able to play in the major leagues' (Priemus, 1994) of national or international competition. The latter ambition can be considered the prime reason for the policy interest in such clusters of cities, though occasionally this may be rooted in the objective to control urbanisation (Lambregts and Zonneveld, 2004). In addition, another reason is increasing functional integration, possibly making such regional networks of cities the next stage in the expansion of urban living space. However, the functional rationality or economic reality of these policy concepts is often not uncontested (see for instance Lambooy, 1998a). Although in the literature precursors of the concept of PURs were discussed as early as the 1960s (Gottmann, 1961; Burton, 1963) or even earlier, such as Stein's Regional City (see Larsen, 2005), it is in the past decade that it has gained substantial interest. Its inclusion in the European Spatial Development Perspective (CEC, 1999), albeit in different terms, can be considered one of the accelerators of its spread over Europe (Davoudi, 2003). Many of the recent contributions have been primarily focused on establishing the concept of PURs in the academic and policy debate, on its defining characteristics and on research agenda-setting (see for instance Batten 1995; Dieleman and Faludi, 1998; Kloosterman and Musterd, 2001; Parr, 2004), on its relevance for, or its potential application to specific PURs (Priemus, 1994; Albrechts, 1998; Bailey and Turok, 2001; Turok and Bailey, 2004), while also considerable attention has been paid to capacity building and governance in such regions (Albrechts, 2001; Mueller, 2001; Meijers and Romein, 2003; Lambregts and Zonneveld, 2004). As some of these authors argue, the focus in the discussion on PURs should now turn to empirically substantiating and validating the many claims that have been made for the PUR (Kloosterman and Musterd, 2001; Parr, 2004; Turok and Bailey, 2004). Many assumptions circulate addressing the economic significance of PURs, often in connection to their spatial-functional layout. The broad idea is that, taken together, PURs are able to develop new sources of competitive advantage and better market their city-regions. Due to their specific spatial structure, PURs would even have the potential to enjoy economies of scale, scope and complexity similar to their monocentric counterparts, without, however, incurring the same costs or agglomeration diseconomies that the latter entail. The latter includes congestion, lack of space and high land prices, criminality and environmental pollution. Some validity may be hidden in the latter argument as many of the benefits of urban concentration can also be accessed from locations well outside the agglomeration. At the same time, agglomeration diseconomies remain largely confined to the agglomeration (Parr, 2002). This contribution aims to bring the discussion on PURs further by addressing the basic question of whether agglomeration advantages develop at the scale of PURs. More specifically, are PURs, despite their polycentric spatial layout, able to reap the advantages of urban size in a similar way to more monocentric urban regions? We elaborate this question for the provision of cultural, leisure and sports amenities, contrasting relatively monocentric regions with comparatively polycentric ones. Put simply, the question is whether in three close-by cities of, say, 100,000 inhabitants, a similar extent of support for such urban amenities can be organised as in a city of 300,000 inhabitants. As in the economic debate, attention is shifting from the production of physical goods to the production and diffusion of information, knowledge and innovation (Lambooy, 1998b; Van Oort, 2004) the attractiveness of cities for knowledge workers' is increasingly important. They consider the presence of cultural, leisure and sports amenities of great significance, and consequently, their presence is an important asset for cities (Castells, 1972; Gottlieb, 1995; Zukin, 1998; Brueckner et al., 1999; Glaeser et al., 2001; Florida, 2002). The presence of these urban amenities is closely linked to the size of the population in a region, permanent or temporary (tourists, business travellers), which makes them a very useful object of analysis for our purpose. Does a polycentric spatial lay-out influence the support base in regions for cultural, leisure and sports amenities? In order to test for this, we calculated the extent of mono- or polycentricity - we consider both extremes of the same scale - for 42 Dutch regions. We also collected data on the presence of cultural, leisure and sports facilities in these regions, see section 3. An index was developed stating the extent to which these amenities are present. The scores on this index will be linked to the extent of mono/polycentricity as well as some other independent variables in the multiple regression model presented in section 4. Does the extent of mono/polycentricity explain the presence of cultural, leisure and sports amenities in regions? We will discuss this question in the final section 5. First, we will theoretically elaborate on the research question in the next section. Regional Externalities in PURsMany advanced or rare high-level urban amenities need a considerable minimum market size as regards both demand for the amenities offered and the supply for the necessary human capital. Therefore, a certain critical mass is deemed necessary for urban amenities to be able to diversify and function smoothly. As Capello (2000: 1926) argues, the limit that the medium-sized cities come up against, and which often makes them succumb vis-à-vis the great metropolis, is the limit of critical mass and centrality'. Not surprisingly, the highest valued economic activities and the widest variety in economic and cultural functions are found within the largest agglomerations. It is a strategic issue whether such activities can also be realized in polynuclear urban structures, which lack the critical mass of large cities with agglomeration economies' (Lambooy, 1998a, p. 459). If this was possible, it would imply that external economies are equally present in PURs as in monocentric city regions, though in that case, given the physical spacing of cities, they could perhaps be better referred to as regional externalities' (Parr, 2002), or the more broad urban network externalities' (Capello, 2000) which may also apply to networks of cities not necessarily within the same region. It corresponds with the concept of borrowed size' as introduced by Alonso (1973). This refers to the situation in which close-by and well-connected cities host urban functions normally found only in larger cities, such as top-level urban amenities, because the support base is larger given the proximity of more cities. This view is for instance supported by Burton (1963, p. 287): the functions of the missing regional center have in part been taken over by the next lower group of centers', and Stein (1964, p. 205): the total population of a regional group of towns and farms will be adequate to utilize and support central facilities equivalent to those provided by a great metropolis'. Also, it corresponds with the widely acknowledged perception that accessibility is becoming more important than proximity. Not surprisingly, the idea of integrating formerly separate cities to form a larger entity able to reap the advantages of urban size is appealing to administrators and planners. However, the idea that the integration of separate cities results in agglomeration advantages comparable to similar-sized monocentric cities is rather simplistic' (Bailey and Turok, 2001). Parr (2004) points in this respect at the need for longer travel flows, longer commodity flows and less convenient flows of information in polycentric urban regions. Moreover, it should be reckoned that some of the advantages of urban size stem from the nature of the metropolitan environment, and are related to such factors as density, proximity, face-to-face contact, informal structures, unplanned interaction, etc.' (Parr, 2004, p. 236), and consequently hold less for PURs. Consequently, many doubts can be raised concerning the support base of polycentric urban regions in comparison to similar-sized monocentric urban regions. Still, other research findings suggest that too much concentration is not good either. For instance, Henderson (2000), reports a strong relationship between the level of urban concentration and economic growth for countries. He finds that a very monocentric urban system is not favourable for economic growth, nor is too much dispersal. Perhaps this also holds for the regional scale, as on that scale too agglomeration economies are traded off with agglomeration diseconomies. When too much concentration as well as too much deconcentration is not favourable, then perhaps PURs, with their concentrated deconcentration'-shape provide the optimum compromise? Taking into account the shape of the urban system such as in Henderson (2000) is rather exceptional. Most of the time, the shape of the urban system is taken for granted (Scott, 2000; Kloosterman and Musterd, 2001). In this contribution we try to overcome this omission. In the next sections we will empirically explore whether a polycentric spatial lay-out does influence the provision of cultural, leisure and sports amenities in regions. Research DesignWe analyse the relationship between the shape of the urban system in regions and how this influences the support base for cultural, leisure and sports amenities by developing a multiple regression model. In this model, the dependent variable is an index representing the extent to which selected cultural, leisure and sports amenities are present in regions (see section 3.2). One of the explaining variables is an indicator that expresses the extent of mono- or polycentricity of a regional urban system (section 3.3). Case Study RegionsIdeally, the case study regions would be delimited on the basis of functional relationships relating to the use of cultural, leisure and sports amenities. However, in the Netherlands, such detailed travel data is not sufficiently reliable. There exists a relatively objective demarcation of city-regions (stadsgewesten'), but these depart from a nodal' perspective and an overwhelming majority is consequently monocentric by definition. Moreover, their scale is rather small supralocal - in the light of most of the amenities studied here that function on a regional level. Therefore, we chose a regional delimitation that is relatively recent, that is not by definition confined to old provincial administrative borders such as the Corop-delimitation and that provides for a proxy of a functionally coherent region: the WGR-samenwerkingsgebieden. These regions have been delimited within the framework of the Intermunicipal Statutory Regulations Act ( Wet Gemeenschappelijke Regelingen; WGR). This act enables municipalities to jointly work on issues that need to be addressed on a higher spatial scale than the municipal scale by means of issue-based common arrangements. The Act does not specify which issues should be jointly addressed, but in practice these often concern regional aspects of economic development, tourism, recreation, housing, employment, traffic and transport, spatial development, nature and environmental affairs, welfare and social affairs. Until recently, the act required that such common arrangements had to be clustered within the same regions in order to avoid a too territorially uncoordinated patchwork of common arrangements. As the delimitation of WGR-regions is based on municipal and provincial administrators' and councillors' perceptions of the scale on which issues in need of a regionally coordinated approach rise, these regions provide for an indirect proxy of functionally coherent regions. Despite the professional' definition of this region, the outcome appears generally well defendable and consequently has not led to strong debate on its rationality. This regional delimitation seems to coincide fairly well with culturally homogeneous regions and what are believed to be travel to work areas. Although most are located within one Dutch province, some cover the area of multiple provinces. Their average population size (2005) is 387,034 inhabitants, the minimum being 107,620 (Zeeuwsch-Vlaanderen) and the maximum 1,352,680 (Agglomeration Amsterdam). In general, the relatively small size of the WGR-regions makes it possible to go from one place to another in the same region within half an hour. Here we will refer to them as WGR-regions. We collected data for all 42 WGR-regions, which together cover the entire Netherlands (Figure 1).
Figure 1 WGR-regions
Source: CBS. Cultural, Leisure and Sports AmenitiesWe made an inventory of the presence of certain cultural, leisure and sports amenities in the 42 WGR-regions. The data refers both to quantity and quality. We selected the types of amenities that have a potentially supralocal significance, thus needing the support or critical mass of a region rather than an average-sized city. This excludes both the amenities functioning at the level of small cities, as well as most of those operating on a larger, for instance national scale. Data for 20 variables were collected from a wide variety of sources. These variables can be grouped into six categories: cinema, theater, museum, concert, sports and a rest category comprising leisure activities not yet belonging to the other categories. Table 1 presents details on the variables.
Table 1 List of variables cultural, leisure and sports amenities
In general, the list includes indicators related to the size of such amenities (e.g. largest cinema, large theaters, capacity largest pop/concert venue, capacity stadium), as a larger amenity generally will be able to attract larger, more renowned productions, more well-known bands or sports events. Next, the list also includes variables on amenities that do not need a big audience, but that, given their specialized nature, require a larger support base (e.g. art house cinemas, concert halls, climbing walls, Michelin-star restaurants). Similarly, the number of museums belonging to the 50 most visited ones in the Netherlands may be considered an indicator of quality. Indexes We developed indexes summarizing the scores on the six categories and a total index' summarizing the scores on all six categories together. The scores of the 42 WGR-regions on these 20 variables were normalized and we used these z-scores to develop our index. Each variable within a category (cinema, theater etc.) was given the same weight, and each of the six categories was also given the same weight in the total index. Therefore, the total index is the average score on the six constituting categories. A z-score of 0 was given a score of 100, and 1 standard deviation 20. So, when a region scores a z-score of 1 on a certain variable, it got a score of 100+20=120 etc. Table 2 presents the scores of all 42 WGR-regions on the six categories as well as the total index.
Table 2 Presence of cultural, sports and leisure amenities in WGR-regions
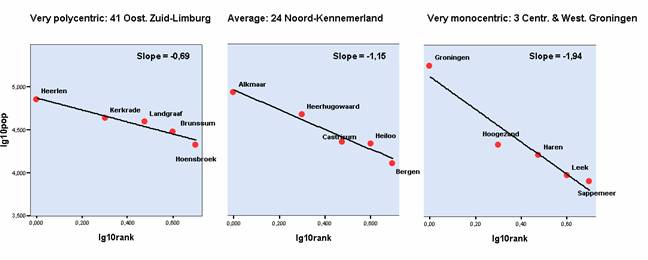
Measuring the Extent of Mono- and PolycentricityBasically, polycentricity refers to the plurality of centres in a given area. As this given area' is undefined, it may refer to any spatial scale. The term polycentricity as such, is therefore essentially scale-less. As a consequence, the term has been applied to a wide variety of spatial scales ranging from Europe, to many of its countries, to regions and to cities. However, there are important differences in interpretation between these scales. Davoudi (2003) argues that at lower spatial scales the concept is mainly analytical, while at the national or European scale it is predominantly a normative concept. However, nowadays, the increased policy attention for polycentricity has added many normative elements at the local and regional scale (polycentricity being something to strive after), while recently, on the national and European scale attempts have been made to measure polycentricity analytically (Nordregio et al., 2004; IGEAT et al., 2007; Meijers and Sandberg, 2006). However, also in analytical terms there are differences. While on the national spatial scale a country's urban system is considered more polycentric when the main cities are evenly distributed across the territory, it is exactly the opposite a clustering of cities that leads to polycentricity on the regional scale. Here, we adopt Meijers' theoretical distinction between polycentric urban regions and urban networks (Meijers, 2007a). While the first term refers to particular morphological characteristics such as a clustering of relatively similar-sized cities in close proximity, in fact the image on the map', the latter term denotes a PUR in which relational aspects accord with a network logic (see Batten, 1995; Van der Knaap, 2002; Meijers, 2007b). A regional urban network is therefore a polycentric urban region characterized by functional integration, by a relative disconnection between size and function of its cities as well as by specialisation and interaction, leading to complementarity. To some extent, this distinction appears parallel to the distinction morphological polycentricity' and relational or functional polycentricity' (Nordregio et al., 2004), but the latter set of terms, particularly relational/functional' polycentricity is less clear on its defining characteristics than urban network', at least on this regional scale. Moreover, to avoid confusion, it appears recommendable to reserve the term polycentricity for morphological issues (see also IGEAT et al., 2007). Consequently, we should consider the morphological characteristics of regions to determine to what extent they are polycentric. Parr (2004) points to the spatial and size distribution of cities in the region. In terms of spatial distribution, there should be a maximum and a minimum limit to centre separation. The spatial distribution of cities within WGR-regions does not seem to be a very distinguishing factor for measuring polycentricity as it is generally possible to get from one place to another within the same WGR-region within half an hour. In addition, strict Dutch planning policies have avoided the coalescence of separate cities into larger conurbations. Therefore, the size distribution of cities should be considered the most important indicator for establishing whether or not any region is polycentric or the opposite, monocentric at the regional scale. A dichotomous approach to the question, however, must be avoided. Rather than considering a given area polycentric or monocentric, it is more appropriate to score an area on a scale ranging from (very) polycentric to (very) monocentric. The size distribution is even more appropriate for this research as size is strongly related to the support base of regions. Here we will present a measure of mono/polycentricity for the urban system of the WGR-regions based on the rank-size order of cities. In doing so we partly draw on the work carried out within the framework of the ESPON 1.1.1 project on polycentricity (Nordregio et al., 2004). Rank-size distribution as indicator for mono-polycentricity Characteristic for a polycentric urban system is that no city dominates over other cities in economic, cultural and other respects. In other words, a polycentric urban system lacks strong hierarchy. The rank-size distribution of the regional urban system provides information on this hierarchy and is therefore an excellent indication of the extent of mono- or polycentricity. Figure 2 presents the rank-size distributions of three WGR-regions that are either among the most polycentric (Oostelijk Zuid-Limburg), not polycentric nor monocentric (Noord-Kennemerland) or among the most monocentric (Centraal & Westelijk Groningen). The population data presented in the figure is for the actual towns and villages, not the municipalities in which they are located. In the Netherlands, the average municipality contained just over five and the average WGR-region almost 60 such cities and villages in 2005.1 The population data was collected for the year 2005. Given the strong stability of urban systems over time (Batty, 2001), data for one year presents a robust picture.
Figure 2 Monocentric and polycentric rank-size distributions based on five towns per region
Figure 2 presents the five largest places in three regions and also the regression line that best fits the distribution of their sizes. The argument now is that in a polycentric region, with little hierarchy, this line will be more flat than in a monocentric region. Therefore, the slope of the regression line is a good indicator of the extent of mono- or polycentricity. Obviously, the number of towns included in the regression analysis influences the outcome of these calculations. In general, sample size can be either a fixed number of towns, a fixed size threshold, or a size above which the sample accounts for some given proportion of a region's population (see also Cheshire, 1999). The latter has disadvantages for this research, as it will turn out that the number of towns included in the analysis is large for polycentric regions and small for monocentric regions. Hence, the number of towns comprising a given proportion of the population is in itself an indicator of mono- or polycentricity and applying such a measure twice would distort the picture. A fixed size threshold is equally inappropriate as in large and more densely populated regions a town of say 20,000 inhabitants may be insignificant, while it could be of great importance in small or less populated regions. It could be argued that a town ranked for instance third in a region is of importance in that region, despite its possible small size. Therefore, when measuring polycentricity, the sample size could best be based on a fixed number of towns. The question then is what this number should be. The answer seems arbitrary. Our tentative impression of the extent of polycentricity of a region is often based on just a mere handful of places. In this study we measured the extent of polycentricity by calculating the slope of the regression line that was based on either the five or three largest cities. The outcomes correspond strongly. Figure 3 maps the results for the calculations based on five cities in each region.
Figure 3 WGR-regions and their extent of mono- or polycentricity, measured for samples of five towns
The scores presented on the extent of mono/polycentricity are normally distributed, with an average slope of the regression line of 1.15 and a Standard Deviation of 0.31 for the regression line based on five cities per WGR-region or an average slope of the regression line of 1.26 and an SD of 0.51 for three cities per WGR-region. It is important to emphasise that there is no relationship between the population size of regions and the score on this mono/polycentricity indicator. So, we have both populous and thinly populated polycentric regions and monocentric regions. In the analysis that follows we use the indicator for mono/polycentricity based on the regression line through the five main cities in WGR-region. We will refer to this indicator as the polycentricity' indicator, because the higher the score on this indicator, the more polycentric a region is. However, in practice, a low score implies that it is in fact a monocentric region. In order to test for robustness, we will also check results with the scores for the slope of the regression line based on just three cities per region. Other Independent VariablesWe will use the scores on the indicator polycentricity, e.g. the slopes of the regression line, as explaining variable for the index of the presence of cultural, leisure and sports amenities in these regions. There are some other explaining variables that will be included in the multiple regression analysis. These include the population size of a region, the absolute number of beds in hotels in that region weighted by the region-specific average percentage of their occupation (as a proxy for the size of the non-permanent population such as tourists and business travellers), as well as the average household income in that region. We clearly expect these three indicators to positively affect the presence of cultural, leisure and sports amenities in our 42 case study regions. After all, when there are more people present in a region (residential or visiting population), then the support base for such amenities is larger. Moreover, as enjoying these amenities nearly always requires the paying of an entrance fee or subscription rate, it can be hypothesized that a more affluent residential population will lead to a larger demand for such amenities. Data on the population of WGR-regions was provided by Statistics Netherlands (CBS), and refers to the situation on January 1, 2005. Regional data on the number of hotel beds as well as regional data on their average occupation rate was provided for the year 2004 by the Bedrijfsschap Horeca en Catering, a knowledge and innovation centre for the hotel, restaurant and cafe sectors. Finally, the data on household income per WGR-region is for 2002 and was also provided by Statistics Netherlands. Analysis: linking the shape of the regional urban system with the presence of urban amenitiesTable 3 summarises the results of our multiple regression analysis. The 42 WGR-regions serve as cases. The dependent variable is the total index of cultural, leisure and sports amenities (see Table 2, final column). Independent variables were entered simultaneously into the model and include:
Table 3 Multiple regression analysis of total index of cultural, leisure and sports amenities in WGR-regions
The regression analysis shows that all four independent variables significantly contribute to the presence of cultural, leisure and sports amenities.2 Given the perspective of the present paper, the most important finding obviously is that the shape of the urban system is of significance for explaining the presence of these amenities. This relation is negative, which means that the more polycentric a region is, the fewer such amenities are present. Or, the more monocentric, the more cultural, leisure and sports facilities it has. We will elaborate on this important finding in the final section. The multivariate analysis clearly shows that the size of the population in a region is by far the most important explaining variable. In fact, the adjusted R2 would amount to 0.874 solely based on the population variable. The number of non-resident population, for which we used the proxy of average number of occupied beds in hotels, has the second highest beta. The shape of the urban system then explains slightly more than the average household income. Opposite to what was expected, household income is negatively related to the presence of the amenities studied here. Apparently, some amenities are included that are more frequently visited by relatively lower-income households. The four variables together explain 94.8% of the variance in the scores on the total index of cultural, leisure and sports amenities. When we fill in the average values for population (387,034), the number of occupied hotel beds (1956.8) and household income (30,188), as well as the minimum value we found for polycentricity (thus, the most monocentric region: -1.94) in the regression equation, we are expected to find a total index value of 104.28. When we take again these averages but include the maximum, thus the most polycentric value for polycentricity, we expect a value of 97.12. A very polycentric WGR-region would remain more than 7 index points behind the most monocentric region because of the shape of its urban system. This equals nearly half the value of the standard deviation of the total index variable. When we include the values found for the polycentricity indicator based on just three cities in each WGR-region instead of the values based on five towns in each region, we find that the extent of polycentricity is also a significant variable (p = 0,04) in explaining the presence of cultural, leisure and sports amenities. In this case, the Beta value is slightly less compared to the Beta presented for the indicator based on five cities as presented in Table 3. Having established that the size of the residential population is by far the most explaining factor for the presence of cultural, leisure and sports amenities, we will now look at which variables correlate with the polycentricity indicator while correcting for the size of the population. We will do this by making all values of the variables expressing frequencies relative to the population number, resulting for instance in the number of seats in cinemas per 1000 inhabitants, see Table 4.
Table 4 Correlations between the shape of the urban system and cultural, leisure and sports amenities
** Correlation is significant at the 0.01 level (2-tailed).
For eight types of amenities we found significant correlations with the extent of polycentricity. All of these significant correlations are negative, which means that the more polycentric a region is, the less these amenities are present. This means that polycentric regions have less seats in cinemas and art house cinemas. This is linked to the fact that there is also less choice in movies as the number of screens in both cinemas and art house cinemas is less in polycentric regions. Apparently, entrepreneurs in this sector consider the support base of such regions weaker than of their monocentric counterparts. There are also less casinos, concert halls and pop/concert venues in polycentric regions. Indoor climbing halls are also less common, or smaller, in polycentric regions. However, the shape of the urban system does not matter for other sports amenities. Nor does it matter for the theatre sector, although it seems that small theatres are less present. Medium-sized theatres appear more present in polycentric regions. This is one of the three positive correlations, albeit not significant, next to indoor-ski halls and museums. It seems that particularly those amenities that need a large support base because they provide specialized services are less present in polycentric regions. ConclusionThe issue addressed in this paper is fundamental: is it possible that agglomeration advantages develop to a similar extent in a cluster of spatially separated cities as in a single city? We considered this question in terms of urban size. The research question was whether a PUR can reap the advantages of its combined urban size to a similar extent as a monocentric city region. In our research we focused on activities whose presence is closely linked to the size of the urban population: cultural, leisure and sports amenities. Their presence in regions was expressed in a total index of these amenities, which was then linked to an indicator of the extent of polycentricity of these regions. This indicator was based on the rank-size distribution of the major towns in each region. Next to this indicator, three other explaining variables were entered into a multiple regression model. 42 Dutch regions, so-called WGR-regions, were analysed. The regression analysis resulted in the observation that, when correcting for differences between regions in terms of population, the number of visitors and the average income, PURs have a disadvantage compared to more monocentric city regions: the more polycentric a region is, the less cultural, leisure and sports amenities are present. Conversely, the more monocentric a region, the more these amenities are present. The specific dispersed spatial layout of polycentric regions implies that they cannot reap the advantages of urban size in a similar way as more monocentric urban regions, at least, as far as our selection of cultural, leisure and sports amenities is concerned. These empirical findings support the view of Parr (2004) and Bailey and Turok (2004) who suggested that PURs are behind more monocentric regions in terms of agglomeration advantages, or, in the case of PURs, regional externalities. In addition to Parr's suggested explanations - in PURs there is a need for longer travel flows, commodity flows, less convenient flows of information and a lack of a metropolitan environment some other plausible explaining factors can be distinguished. In the first place, an explanation lies in the long history of rivalry and competition that seems common for the cities in a PUR. It has been suggested that interurban competition leads to duplication rather than complementarity: The most oft-noted drawback of inter-territorial competition is serial reproduction, the imitation and replication of the same ideas from place to place (Malecki, 2004: 1112). Cities tend to market the same kind of images (Holcomb, 1994) and copy each others successes as regards urban redevelopment projects, innovations and investments ( Harvey, 1989). Consequently, duplication between the cities in PURs is likely to be high, which limits the diversity of cultural, leisure and sports amenities. As a result, it appears that the offer of cultural, leisure and sports amenities in PURs is more in line with the size of the local cities than with the size, or mass, available in the region. For instance, having three medium-sized theatres in three medium-sized cities together constituting a PUR does not mean they can attract those top-end theatre productions that demand more physical space as well as larger receipts and thus more attendants. Such productions tend to be reserved for larger theatres, generally found in larger cities. In the second place, one needs to bear in mind that cultural, leisure and sports amenities tend to be strongly rooted in their urban context. Urban development pathways are important. For instance, many present-day cultural amenities have developed from cultural amenities that were in place already decades ago, and planned along the lines of central place theories. They build on existing local infrastructures and are embedded in patterns of local relationships between amenities and other regional and local services. A third, related, explanation is the way most of the cultural, leisure and sports amenities studied are financed. For most of the amenities studied here, it holds that they cannot be fully exploited through the market. Rather, to a greater or lesser extent, they are subsidised by municipalities and to some extent by the central Dutch government. This particularly concerns the cultural and sports amenities. Next to direct support, such as municipalities compensating for budget deficits and financing the building or renovation of theaters, museums, sports facilities etc., there is also indirect support as productions staged in theaters and certain movies screened in (art house) cinemas are subsidised. Interesting then is the financial base of municipalities. Compared to other countries, in the Netherlands only a small proportion of municipal revenues are raised by local taxes (OECD, 2007). Still, however, they are fairly autonomous as they receive considerable non-earmarked general grants from the central government, which are also used to support urban amenities. These general grants are divided among the municipalities by a large number of criteria. The most important criteria are the number of housing units in a municipality, its population and the built-up area. This dividing mechanism tends to favour larger cities, which receive disproportionally more than smaller cities. One city, or actually, municipality, of 300.000 inhabitants has a greater financial base than three cities of 100.000 inhabitants together. Consequently, the former has more financial room to stimulate the presence of cultural, leisure and sports amenities. While it is tempting to generalise the result found that polycentric regions have a smaller support base than monocentric regions, it needs to be mentioned that the analysis presented was necessarily limited in terms of scope and scale. The findings hold for WGR-regions and for the amenities studied, but obviously the issue of regional externalities in polycentric urban systems calls for further exploration. First of all, the scope could be expanded: while this research employed cultural, leisure and sports amenities as indicator of agglomeration advantages, which are internal to cities but external to firms, it is worthwhile to also consider advantages more directly accruing to firms and workers. Studying the latter type of advantages may reveal different patterns, in particular because of the different financial base. Of major importance is also that further exploration should focus on recognizing trends: are polycentric regions closing a gap with monocentric city regions, or is this gap widening? Arguments could be made for both. The gap could be closed through the slowly but steadily progressing functional integration in PURs. On the other hand, it may be that such integration is progressing too slowly to keep pace with the needs of both firms and consumers for increasingly specialized services. Additionally, next to exploring trends, it may be that polycentric regions perform better on other indicators than the presence of cultural, leisure and sports amenities presented here. Therefore, another research issue is whether PURs score better on other issues, typically those summarized under the label agglomeration diseconomies'. Also, empirical results from a larger variety of countries and regions could shed an interesting light on these matters. It would also be worthwhile to know whether polycentric regions that have progressed further on the path to being urban networks perform better than polycentric regions that have just started the development in that direction. In other words, do PURs with higher levels of interaction, complementarity, functional integration and internal accessibility perform better than PURs with fewer such characteristics? And what about the performance of PURs in which regional organising capacity and regional cooperation and coordination are better developed? Finally, more in-depth knowledge of the processes fostering or hampering the development of agglomeration advantages in PURs could be gathered through applying other research methods, for instance stakeholder interviews. It appears that the major challenge for developing cultural, leisure and sports amenities in PURs is to make better use of the population potential present in such regions through organising regional coordination to avoid inefficient competition and hence duplication. In particular the financing of cultural, leisure and sports amenities on a regional rather than local basis is needed. Of great importance is the development of methods to balance the gains and burdens over time for the participating cities. Self-evidently, increased functional integration and the furthering of a regional identity and regional scope or mindset to tighten the cities together appear of great importance as well. Finally, what this research revealed is that the question raised in Meijers (2005) of whether a regional cluster of cities is more than the sum of the parts is phrased rather optimistically. As far as the support for urban amenities is concerned, such collections of proximate cities are not even the sum of the parts. REFERENCESALBRECHTS, L. (1998) The Flemish Diamond: Precious Gem and Virgin Area, European Planning Studies, 6, pp. 411-424. ALBRECHTS, L. (2001) How to Proceed from Image and Discourse to Action: As Applied to the Flemish Diamond, Urban Studies, 38, pp. 733-745. ALONSO, W. (1973) Urban Zero Population Growth, Daedalus, 109, pp. 191-206 BAILEY, N. and TUROK, I. (2001) Central Scotland as a polycentric urban region: useful planning concept or chimera?, Urban Studies, 38, pp. 697-715. BATTEN, D.F. (1995) Network Cities: Creative Urban Agglomerations for the 21st Century, Urban Studies, 32, pp. 313-327. BATTY, M. (2001) Polynucleated Urban Landscapes, Urban Studies, 38, pp. 635-655. BRUECKNER, J.K., THISSE, J-F. and ZENOU, Y. (1999) Why is central Paris rich and downtown Detroit poor? An amenity-based theory, European Economic Review, 43, pp. 91-107. BURTON, I. (1963) A restatement of the dispersed city hypothesis, Annals of the Association of American Geographers, 63, pp. 285-289. CAPELLO, R. (2000) The City Network Paradigm: Measuring Urban Network Externalities, Urban Studies, 37, pp. 1925-1945. CASTELLS, M. (1972) La Question urbaine. Paris: F. Maspéro. CEC, Commission of the European Communities (1999) European Spatial Development Perspective: Towards Balanced and Sustainable Development of the Territory of the EU. Luxembourg: Office for Official Publications of the European Communities. CHESHIRE, P. (1999) Trends in Sizes and Structures of Urban Areas, in: P. CHESHIRE and E.S. MILLS (Eds) Handbook of Regional and Urban Economics, Volume 3, pp. 1339-1372. Amsterdam: Elsevier Science. DAVOUDI, S. (2003) Polycentricity in European Spatial Planning: From an Analytical Tool to a Normative Agenda. European Planning Studies, 11, pp. 979-999. DIELEMAN, F.M. and FALUDI, A. (1998) Polynucleated Metropolitan Regions in Northwest Europe: Theme of the Special Issue, European Planning Studies, 6, pp. 365-377. FLORIDA, R. (2002) The Rise of the Creative Class. New York: Basic Books. GLAESER, E., KOLKO, J. and SAIZ, A. (2001) Consumer city, Journal of Economic Geography, 1, pp. 27-50. GOTTLIEB, P.D. (1995) Residential Amenities, Firm Location and Economic Development, Urban Studies, 32, pp. 1413-1436. GOTTMANN, J. (1961) Megalopolis, The urbanized Northeastern Seaboard of the United States. New York: The Twentieth Century Fund. HARVEY, D. (1989) From managerialism to entrepreneurialism: the transformation of urban governance in late capitalism, Geografiska Annaler, 71B, pp. 317. HENDERSON, V. (2000) The effects of urban concentration on economic growth, working Paper 7503. Cambridge, MA: National Bureau of Economic Research. HOLCOMB, B. (1994) City make-overs: marketing the post-industrial city, in: J.R. GOLD and S.V. WARD (Eds) Place Promotion: The Use of Publicity and Marketing to Sell Towns and Regions, pp. 115-131. Chichester: Wiley. IGEAT, Institut de Gestion de l'Environnement et d'Aménagement du Territoire et al. (2007) ESPON 1.4.3 Study on Urban Functions, Final report. Brussels/Luxembourg: Université Libre de Bruxelles/ESPON Monitoring Committee. See www.espon.eu. KLOOSTERMAN, R.C. and MUSTERD, S. (2001) The Polycentric Urban Region: Towards a Research Agenda, Urban Studies, 38, pp. 623-633. KNAAP, G.A. van der (2002) Stedelijke bewegingsruimte, over veranderingen in stad en land. The Hague: Sdu uitgevers. LAMBOOY, J.G. (1998a) Polynucleation and Economic Development: The Randstad, European Planning Studies, 6, pp. 457-466. LAMBOOY, J.G. (1998b) Agglomeratievoordelen en ruimtelijke ontwikkeling: steden in het tijdperk van de kenniseconomie, Inaugural lecture Utrecht University, 2 december 1998. LAMBREGTS, L. and ZONNEVELD, W. (2004) From Randstad to Deltametropolis: Changing Attitudes Towards the Scattered Metropolis, European Planning Studies, 12, pp. 299-321. LARSEN, K. (2005) Cities to Come: Clarence Stein's Postwar Regionalism, Journal of Planning History, 4, pp. 33-51. MALECKI, E.J. (2004) Jockeying for Position: What It Means and Why It Matters to Regional Development Policy When Places Compete, Regional Studies, 38, pp. 1101-1120. MEIJERS, E. (2005) Polycentric Urban Regions and the Quest for Synergy: Is a Network of Cities More than the Sum of the Parts? Urban Studies, 42, pp. 765-781. MEIJERS, E.J. (2007a) Synergy in Polycentric Urban Regions: complementarity, organising capacity and critical mass. Amsterdam: IOS Press. MEIJERS, E.J. (2007b) From central place to network model: Theory and evidence of a paradigm change, Tijdschrift voor Economische en Sociale Geografie, 98, pp. 245-259. MEIJERS, E. and ROMEIN, A. (2003) Realizing potential: Building Regional Organizing Capacity in Polycentric Urban Regions, European Urban and Regional Studies, 10, pp. 173-186. MEIJERS, E.J. and SANDBERG, K. (2006) Polycentric development to combat regional disparities? The relation between polycentricity and regional disparities in European countries, in: Proceedings of the 46th Congress of the European Regional Science Association in Volos, Greece. MUELLER, B. (2001) Urban Networks and Polycentric Spatial Development in Europe the Case of Germany, EUREG, 9, pp. 40-46. NORDREGIO et alia (2004) ESPON 1.1.1: Potentials for polycentric development in Europe, Project report. Stockholm/Luxembourg: Nordregio/ESPON Monitoring Committee. OECD, Organisation for Economic Co-operation and Development (2007) Randstad Holland, Netherlands, OECD Territorial Reviews. Paris: OECD Publishing. OORT, VAN F.G. (2004) Urban Growth and Innovation, Spatially Bounded Externalities in the Netherlands. Aldershot: Ashgate. PARR, J.B. (2002) Agglomeration economies: ambiguities and confusions, Environment and Planning A, 34, pp. 717-731. PARR, J.B. (2004) The Polycentric Urban Region: A Closer Inspection, Regional Studies, 38, pp. 231-240. PRIEMUS, H. (1994) Planning the Randstad: Between Economic Growth and Sustainability, Urban Studies, 31, pp. 509-534. STEIN, C.S. (1964) A regional pattern for dispersal, Architectural Record, pp. 205-206. TUROK, I. and BAILEY, N. (2004) The Theory of Polynuclear Urban Regions and its Application to Central Scotland, European Planning Studies, 12, pp. 371-389. ZUKIN, S. (1998) Urban Lifestyles: Diversity and Standardisation in Spaces of Consumption, Urban Studies, 35, pp. 825-839.
NOTES* Evert Meijers, OTB Research Institute for Housing, Urban and Mobility Studies, Delft University of Technology, The Netherlands, E-mail: e.j.meijers@tudelft.nl 1. Recognised by the Dutch postal services as official place names. 2. There is no multicollinearity. A normal probability plot of standardised residuals and a scatterplot of standardised residuals and standardised predicted values reveal that residuals are normally distributed and that the variance of residuals is constant.
Note: This Research Bulletin has been published in Urban Studies, 45 (11), (2008), 2323-2342 |
||||||||||||||||||||||||||||||||||||||||||||||||||||||||||||||||||||||||||||||||||||||||||||||||||||||||||||||||||||||||||||||||||||||||||||||||||||||||||||||||||||||||||||||||||||||||||||||||||||||||||||||||||||||||||||||||||||||||||||||||||||||||||||||||||||||||||||||||||||||||||||||||||||||||||||||||||||||||||||||||||||||||||||||||||||||||||||||||||||||||||||||||||||||||||||||||||||||||||||||||||||||||||||||||||||||||||||||||||||||||||||||||||||||||||||||||||||||||||||||||||||||||||||||||||||||||||||||||||||||||||||||||||||||||||||||||||||||||||||||||||||||||||||||||||||||||||||||||||||||||||||||