GaWC Research Bulletin 204 |
|
|
Introduction: questions askedThis presentation has three different but related objectives. First, I introduce a specific way of studying world cities through which inter-city relations can be measured. The world city network is defined by the globalization of advanced producer services (Sassen 2001). This world city network formation is modelled as an interlocking network wherein global service firms ’interlock’ cities through their everyday business. Thus the firms are the agents of the process whose outcome is the world city network (Taylor 2004). Since firms are the agents it is they who are studied in order to understand the inter-city relations. This paper reports on research that covers 80 global service firms and their offices across 315 cities worldwide. Data were collected in 2000 and 2004 enabling two cross-sectional analyses plus 2000 to 2004 change analysis. From these data the network connectivities are derived for individual cities; these measures indicate the degree of a city’s integration into the world city network. Second, I present results from this interlocking network analysis for leading Pacific Asian cities within the world city network. The focus is on the four ‘greater China world cities’ of my title supplemented by comparisons to the six other Pacific Asian world cities: Bangkok, Jakarta, Kuala Lumpur, Seoul, Singapore and Tokyo. The following empirical questions are answered:
Third, these results can provide a basis for discussion of the short- and medium-term prospects of the greater China cities. But I am a world-systems analyst, not a Chinese studies expert. Therefore, before we embark on such an exercise I provide some ground rules for discussion from my particular perspective. These cover the natures of globalization and of cities as specific processes created by the practices of specified agents. The paper is organised into three parts: Method, Results, and Interpretation. Method: the interlocking network modelFollowing Sassen’s (1991) identification of the production and consumption of advanced producer services (high value-added professional, creative and financial services) as critical economic processes in her ‘global cities’, such service firms are treated as interlocking cities through their office networks. With globalization, advanced producer service firms have themselves globalised to keep their important clients, and to maintain their brand integrity. This has resulted in such firms having offices in cities all across the world; today their globality is part of their identity, it is how their recruit both new clients and the new young professionals so vital in this knowledge industry. Thus the services originally identified as archetypal ‘global city’ activities are now interpreted as archetypal world city network activities. This has been formally modelled as an interlocking network analysis (Taylor 2001). Interlocking Network AnalysisThe interlocking network model has an unusual structure of three layers: the net level (world city network), the nodal level (cities) and sub-nodal level (advanced producer firms). The latter are the agents in the process; it is their decisions on office locations and how they use their offices that generate world city network formation. This can be specified formally as follows (for more details see Taylor (2001)). A universe of m advanced producer service firms located in n cities is defined. The service value of a firm j in city i is defined as the importance of its office in the city within its office network and is represented by v ij. An n x m array of all service values defines the service value matrix V.From the service value matrix V, the elemental relation is defined as
This is an elemental interlock between city a and city b in terms of firm j. The underlying premise for this measures is that the larger and more important an office (its service value), the more business it does generating multiple contacts between offices. Thus what are being measured here are estimates of intra-firm connections. Such connections enable multinational projects to be conducted for leading clients within the firm thus keeping control of brand integrity. Projects such as global advertising campaigns, complex insurance arrangements across different regulation regimes, or multi-jurisdictional legal services will require inter-city flows of information, knowledge, instructions, plans, ideas, advice, personnel, strategic nous to bring projects to fruition. It is such flows that I attempt to capture in interlocking network analysis. Therefore equation (1) specifies simply that there will be less flow in the office network between two small offices than between two large offices. Aggregating to the city-scale, city interlock can be defined as
Each city can have up to n - 1 such links; these are to all other cities that also have offices of firms located in the city. The overall relational status of each city within the network can thus be defined as:
Na is the global network connectivity for the city a. To ease interpretation (because N a will vary with size of matrix) the proportion to highest connectivity is defined as:
where Nh is the highest network connectivity recorded in the network.. These measures of a city’s connectivity in the world city network can be interpreted substantively and indicatively. First, a high level of connectivity means that business in the city is ‘globally serviced’ very well; new business in the city coming from other cities will find it can be seamlessly serviced across many cities. Second, these service firms are large but by no means the largest corporations in the world economy. Nevertheless they are very good indicators of business done in a city, especially non-local business. Thus high levels of connectivity tell us that a city is well integrated into the world economy. Global-level Data CollectionThe interlocking network model was initially operationalised to measure global network connectivities of cities in 2000. Details of how this was done can be found in Taylor et al (2002a), only an outline is given here. Basically 100 major advanced producer service firms were identified in accountancy, advertising, banking/finance, insurance, law, and management consultancy. They were selected for their global location strategies: They had to have offices in 15 or more cities of which at least one office had to be located in each of northern America, Pacific Asia and Western Europe. In addition 315 cities across the world were selected as possible important advanced producer service centres. Using the web sites of the firms, their office networks were recorded and the different types of office noted (size, functions, etc.). Using this information, cities were coded in terms of how each firm used them; service values were allocated from 0 to 5 with the former indicating no presence of a given firm in the city, and 5 being allocated to the city housing the firm’s headquarters. In this way a service values matrix was constructed with dimensions of 100 firms x 315 cities. This data collection exercise has been repeated for 2004 in order to measure change in the world city network over the first five years of the twenty first century. Details of how the new research was conducted are given in Taylor and Aranya (2006). The purpose was to replicate the data collection as exactly as possible in order to produce robust measures of change. In the event, several of the original firms no longer existed and, in addition, for some firms that were still operating, the information for 2004 was not directly compatible to that for 2000. The end result is that the 100 firms have been reduced to 80 firms for which direct comparisons across the five years can be made. Therefore for 2004 global network connectivities of cities are computed from an 80 firms x 315 cities service values matrix. For cross-sectional measures of connectivity in 2000 and 2004 80 firms x 315 cities matrices to compute P a (equation 4) are used to facilitate direct comparison. However, to measure a city’s change in connectivity between 2000 and 2004 I return to the original measure of connectivity (N a in equation 3) because the proportionate measure (P a) is a closed number system that restricts change possibilities. To reduce the resulting large numbers for easier elucidation connectivity is standardised for both 2000 and 2004. This produces an open number sequence pivoting on zero. Change in connectivity is simply measured by:
These changes in connectivity are reported for our 10 selected Pacific Asian cities below to see how they are faring in the world city network in the early twenty first century. Hinterworld AnalysisNetwork connectivities describe the aggregate connections of cities in a network. This means they can be disaggregated by returning to equation (2); which I repeat here for pedagogic reasons:
where r ab is the sum of elemental interlocks for all m firms (equation (1). Thus each city has n-1 such inter-city connections. These can be mapped to produce the city’s ‘hinterworld’, the pattern of its connections throughout the world city network ( Taylor and Walker 2004). These are absolute patterns of connections and they are broadly similar across all cities. For instance, every city has its first and second strongest link with London and New York, and all have increasingly lesser connections with cities of increasingly less network connectivity. But this is no a perfect fit: regressing hinterworld links against network connectivities produces residuals that indicate relative over-linkage and relative under-linkage:
so that
where hab is the relative hinterworld link between city a and city b. It is these values that are used to assess the particularities of a city’s hinterworld ( Taylor and Walker 2004). In practice, it is useful to combine hinterworld links into regional groups so that the regional orientation of a city’s hinterworld can be measured. For instance, the links between city a and all k cities in region T can be computed from
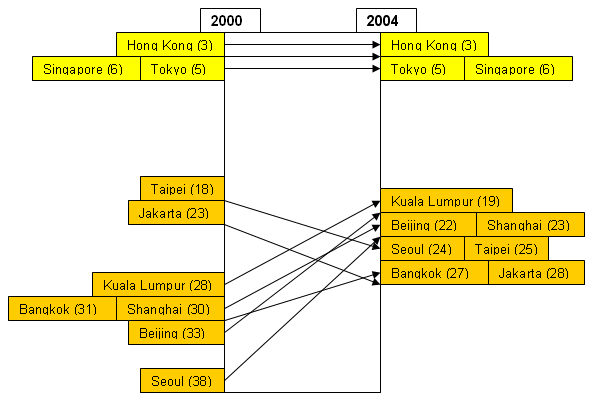
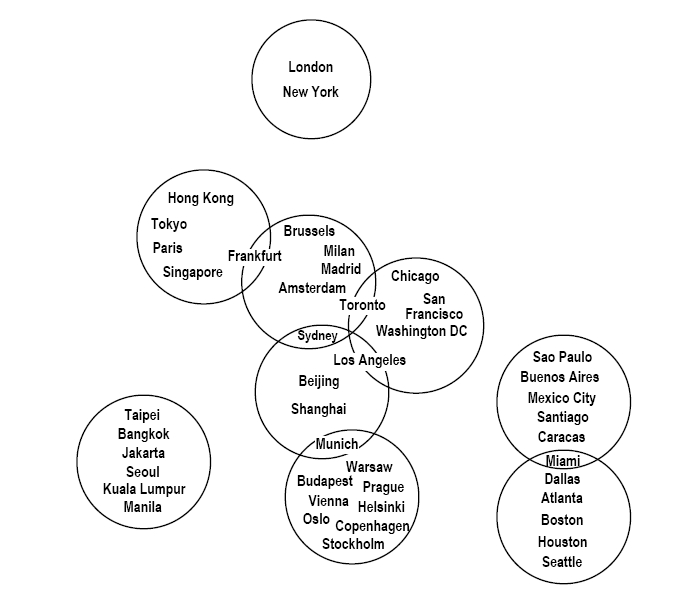
It is the latter measures that are used below to estimate the orientation of the 10 cities in the study in terms of how regional (Pacific Asian) they are and how ‘global’ they are. All measures are standardised. Configuration of the World City NetworkThe service values matrices can be analysed using standard multivariate statistics. These search out patterns in the data matrix and derive subsets or grouping that, in this context, can be interpreted as ‘sub-nets’ within the overall network. In this way the configuration of the world city network is explored. The most common approach has been principal components analysis (Taylor et al 2002b) that creates a parsimonious description of the data through grouping cities. However, it has been found that for discerning patterns among the leading cities of the network (those with the higher network connectivities), fuzzy set analysis produces the most interesting results (Derudder et al 2004). A fuzzy classification scheme computes grades of membership in different clusters. These ‘membership values’ range from zero to unity and are given to every city for each cluster; here I assign cities to clusters with membership value threshold on 0.3. This produces singular cities that are members of just one cluster; between them the singular cities in a cluster indicate the nature of that cluster. In addition some cities are assigned to two clusters and are referred to as hybrid cities; these cities indicate how clusters are linked together, or, where there are no hybrids, which clusters are separated in the world city network. Because the service values matrix is quite sparse for low connectivity cities it is reduced to a 80 firms x 234 cities matrix for this analysis. Different number of clusters can yield different salient results, and hence there is no firm theoretical basis for selecting the number of clusters from the classification analyses. Following Derudder et al (2004), I use the results for 22 clusters in 2004 enabling comparison with the 2000 analysis (Derudder et al 2004). However, in the argument below I focus on just the clusters incorporating the leading cities, including the Pacific Asian cities that are my topic here. Results: interlocking network analyses of Chinese citiesResults are presented in four sections that correspond to the questions asked in the introduction. ConnectivitiesIt was the economic successes of Pacific Asian countries in the final decades of the twentieth century that provided the evidential basis for the new globalization discourse. Therefore we would expect leading Pacific Asian cities to be relatively well connected within the world city network in the early twenty first century. This is borne out in Tables 1 and 2 showing global network connectivities of the ten cities under scrutiny in 2000 and 2004 respectively. Note that the cities are separated into two groups in both tables. This represents a strong structural feature of the results that indicate Hong Kong, Tokyo and Singapore to be the pre-eminent Pacific Asian cities. These world rankings show that these cities are indeed of vital importance: they are part of a set of six cities (with London, New York and Paris) that are firmly ensconced as the most connected strata of cities in the world city network (Taylor and Aranya 2006). The unusual finding is the ranking of Hong Kong above Tokyo, which is contrary to Sassen’s (2001) ‘global city’ thesis. The reason for this result is that although Hong Kong does not house headquarter functions and therefore its ‘command and control’ powers are much less than Tokyo’s, it compensates for this by being the ‘place-to-be’ for servicing clients into the fast growing Chinese market. As such it has immense ‘network power’, which is what the high level of connectivity is telling us (Taylor et al 2002c). Finally, the stable ranking of these cities is noteworthy. After Singapore in both Tables 1 and 2, there is a large gap in connectivity to the next Pacific Asian city with only one other city making, just, the world top twenty. However, this fourth ranked Pacific Asian differs in the two tables: Taipei (18 th) in 2000, Kuala Lumpur (19 th) in 2004. This is symptomatic of the rather less stability in the second group of seven cities. They all seem to be roughly on a par in connectivity levels in both tables but there is a degree of shuffling between the two years. To understand what is happening with this second stratum of Pacific Asian cities it is necessary to look at measures of change. Connectivity ChangesTable 3 shows the connectivity changes and the two cities featured in the previous paragraph are ranked first and last: Kuala Lumpur has the highest positive change; Taipei has the highest negative change. Beyond this it is noteworthy that eight of the ten cities record positive relative change, with four ranked in the top 50 for change worldwide. This indicates that on the whole Pacific Asia’s leading cities are becoming appreciably more integrated in the world city network at the beginning of the twenty first century. Note that the change measures do not correspond to the two groups of cities identified in Tables 1 and 2. In the first group Singapore appears to be ‘catching’ up the two cities above it but, as noted previously, the real story of change is in the second group. This is illustrated clearly through changing world ranks as illustrated in Figure 1. Two things are made clear by the diagram. First, the overall coming together of the second stratum group so that in 2004 they form a solid ranking strata from one region: they constitute 7 out of the 10 cities with world rankings between 19 th and 28 th. Second, there is a general shift upwards: Pacific Asian leading cities were all in the top 40 ranks in 2000; in 2004 they were all in the top 30 worldwide. This suggests that the region has become more integrated into the world economy through its leading cities. One feature of the results so far is that the ‘greater China cities’ are spread across the whole range of cities studied: Hong Kong is in the first connectivity group, Shanghai, Beijing and Taipei in the second group; Beijing and Shanghai are in the top half in terms of change, Hong Kong and Taipei are in the bottom half. Hinterworld ContrastsThe general measures of a city’s connectivity show its overall integration into the world city network but say nothing about the pattern of a city’s linkages. The latter is indicated by a city’s hinterworld; the pattern of residual links to other cities showing where is city is relatively over-linked and relatively under-linked. Here I use two measures of hinterworld: first, the average of a city’s hinterworld linkages to London and New York as representing the globalist orientation in a city’s hinterworld; and second, the average of a city’s residual linkages to other Pacific Asian cities as representing the regionalist (local) orientation in a city’s hinterworld. The results are shown in Table 4 . The patterns for global and regional orientations are generally obverse and clearly define two groups of cities again. The globalist group consists of the three leading cities in Tables 1 and 2 plus Shanghai and Beijing. Thus the regionalist group is the second group in Tables 1 and 2 minus Shanghai and Beijing. And this is not a simple trick of close rankings, there is a definite gap between the two groups of five cities in Table 4. This is an intriguing finding that separates Shanghai and Beijing from the second stratum of Pacific Asian cities and shows them to be like Hong Kong, Tokyo and Singapore. This means that although Shanghai and Beijing have connectivities similar to cities such as Kuala Lumpur and Jakarta, they are more global and less regionalist in the pattern of their linkages. Further, this is definitely not the case for Taipei, this ‘greater China city’ appears similar to its other Pacific Asian city peers in this respect. ConfigurationThis intriguing result can be followed up by looking at the configuration of the world city network using fuzzy set analysis. This produces groups of cities allowing overlaps. Analysis has been carried out for 2000 (Derudder et al 2004) and 2004; here I concentrate on the latter. The main change between the two years is the emergence of a separate group encompassing Shanghai and Beijing. This is shown in Figure 2 where the top 9 fuzzy groups are illustrated, ordered in terms of average network connectivity from top to bottom. The Shanghai-Beijing group is at the centre of second strata cities worldwide: it has three of the 5 overlaps: to western European cities through Sydney, to US cities through Los Angles, and to eastern European cities through Munich. In addition through the western European link it has an indirect overlap with the cities just below London and New York through Frankfurt. The latter fuzzy group includes Hong Kong, Tokyo and Singapore thus endorsing the division of cities in Table 4. This is confirmed by the other leading Pacific Asian cities having their own separated fuzzy group including no hybrid cities; thus affirming their regionalist tendency reported in Table 4. I think Figure 4 is an important result for assessing greater China cities. It brings out the distinctiveness of Beijing and Shanghai in the world city network. Clearly more connected than the other cities of their connectivity strata (Tables 1 and 2), they have a globality like the top tier strata (Table 3) that the fuzzy set analysis concretises. With the majority of hybrid cities (3 out of 5 in Figure 2) at this high connectivity level in the world city network, Figure 4 shows the centrality of Beijing and Shanghai to the early twenty first century global economy. They differ from the other two greater China cities in contrasting ways. In relation to Hong Kong they are sharing the globality although with lower connectivity but in a more linked sub-net in the world city network. In relation to Taipei, despite similar levels of connectivity, the fuzzy set analysis confirms total contrast with this more regionalist city in the separate Pacific Asian cluster. Interpretation: what processes are at work here?The questions asked in the introduction have been answered empirically but what do they actually mean? The results are summarised in Table 5 to facilitate discussion. The first point to make is to remind the audience that the results are derived from a global urban analysis from which Pacific Asian city findings have been abstracted. As noted at the beginning, I am a world-systems analyst not a Chinese studies specialist, and therefore I need to interpret these results in cooperation with others much more knowledgeable than I on the cities discussed. The results appear to make sense at my more general level of knowledge of what’s happening to cities in the contemporary world city network, but do they stand up to scrutiny by Chinese city experts? I hope to find out through responses to this presentation in subsequent discussion. The key point from my perspective is that the empirics derive from a theoretical model in which global service firms are designated as the agents. Therefore the route to interpretation should be to understand how the agents are contributing to world city network formation. There are three processes that the agents engage with. I deal with them in a sequence from the concrete to the more theoretical. Political Economy ProcessEven in contemporary globalization global service firms operate in markets that remain influenced by state boundaries. This is especially true in law and advertising but national regulation in all services compartmentalises markets for services. The job of the service firms is often to get around the boundary obstacles in trans-national projects but final implementation will always be country by country (e.g. an advertising campaign). This means that service firms require a presence in each country, and given the importance of politics in this process, this will normally be in the capital city. Thus it is no surprise that the six Pacific Asian cities included to compare to the ‘greater China cities’ are all state capitals. These are the centres of capital markets, advertising markets, insurance markets, large-project law markets, and so on in the compartmentalisation of demand for services in Pacific Asian economies. Although the six countries – Japan, South Korea, Thailand, Malaysia, Indonesia and Singapore – are very different in numerous ways, they do share the property of having just one major world city per country. Even in the largest economy, Japan, Tokyo dominates ‘global city functions’ (Sassen 2001) with the country’s second metropolitan centre, Osaka, not being able to become a major node in the world city network (Hill and Fujita 1995). This is even more the case for the other countries’ second cities, none of which feature prominently in the world city network at all. Here we have a straightforward political economy process whereby in the 1990s, service firms were expanding their office networks in order to maintain their services to global clients and they used capital cities to this end. One of the ‘greater China cities’ also fits this process – Taipei in Taiwan. The degree to which some firms emphasized a ‘capital cities only’ strategy, these cities came to form a separate and distinctive group of cities as the analysis has shown. But there are two exceptions to this process for which different political economies unfolded. As Sassen (2001) has long emphasised, Tokyo is much more than ‘ Japan’s world city’, it has its own firms, mainly in banking and advertising, who are leading globalisers: this citiy’s additional pre-eminence is due to these ‘global city’ functions. At a different geographical scale, Singapore has regional command and control functions for more than its own ‘national economy’: it is the gateway to South East Asia. Thus here there is a hierarchical process operating in which Singapore is being used as a regional headquarters. This process is similar to that occurring to make Hong Kong the ‘place-to-be’ as gateway to an emerging Chinese market, as previously discussed. Hence these are the processes that have lifted three cities above the capital city process as reflected in Tables 1 and 2. What of Beijing and Shanghai? Although, as a capital city, Beijing shares political affinities with other capitals, Shanghai is an example of a second city that has become a prominent city in the world city network. Clearly this has something to do with the size and growth of the Chinese markets for advanced services. This political economy process is linked to the second key process to make these Chinese cities distinctive. Time-space ProcessGlobalization is often discussed as if it is an end product: what is seen today is the final outcome of global processes. Rather, what is happening is an on-going process that is analysed as cross-sectional snapshots (Taylor 2000). As an unfolding myriad of processes, globalisations has distinctive time-space patterns. And these correspond to changing opportunities for, and obstacles to, realizing high returns on capital. In the case of advanced service firms this means using cities for activities leading to high profits at different times. Clearly in the processes dealt with here the starting point is Tokyo with its own globalising firms active from the 1980s, followed by extra-regional firms coming into Pacific Asian markets through using the regional service centres of Singapore and Hong Kong. Other capital cities get offices as markets grow and to be a serious player in growing national markets requires national presence. Hence there is a third wave of city network formation developing through the 1990s. China is outside these processes and becomes a slightly later market, large and with seemingly sustained high growth. It is this later feature that leads to the emergence of the Shanghai-Beijing cluster, which appears today to be central in the world city network formation in the early twenty first century. This is the message of my 2004 snapshot analysis. City Economy ProcessBoth Jacobs (1970) and Castells (1996) view cities as a process. According to Jacobs there are where the expansion of economic life occurs. She posits a process where the creation of new work replacing imports generates dynamic cities. Thus economically successful countries and regions are those with a surfeit of dynamic cities and the consequent production of new work. The economic rise of Pacific Asia at the end of the twentieth century would certainly appear to bear this out as does the more recent Chinese economic success: our analyses have shown how important cities from the region are in the world city network where they rival cities from the more established world-economy zones of western Europe and northern America. But how do the connectivity measures I have reported fit into a Jacobs-type interpretation? Clearly a dynamic city will be a well-connected city; the limiting case of a non-connected city is the ultimate stagnant city. But increasing connectivity does not inevitably mean a more dynamic city. It depends on how the people doing the connecting are using the city. Ultimately, it is what goes on the city – making new work in the conduit that is the city – that defines economic dynamism (Jacobs 2000). A city with largely warehouse functions is a depot with little or no new work happening, but it will have high levels of connectivity. In the services field such ‘city depots’ are called ’post-boxes’, places in which decisions made elsewhere are carried out. This is the other end of the scale from a city with an advanced producer service office constituted of managers, professionals and creatives working on rolling programmes of new work. In any discussion of cities in relations to other cities, degree of post-boxing compared to creative servicing is the key consideration for interpreting an interlocking network analyses.
REFERENCESCastells, M (1996) The Rise of Network Society. Oxford: Blackwell Derudder, B., Taylor, P.J., Witlox, F., Catalano, G. (2003) Hierarchical Tendencies and Regional Patterns in the World City Network. A Global Urban Analysis of 234 Cities. Regional Studies 37(9), 875-886 Hill, R. C. and Fujita, K. (1995) Osaka’s Tokyo problem International Journal of Urban and Regional Research 19, 181-91. Jacobs, J (1970) The Economy of Cities. New York: Vintage Jacobs, J (2000) The Nature of Economies. New York: Vintage Sassen, S (2001) The Global City Princeton.NJ: Princeton University Press Taylor, P J (2000) ”Izations” of the world: Americanization, modernization and globalization, in C Hay and D Marsh (eds) Demystifying Globalization. London: Macmillan, pp. 49-70 Taylor, P. J. (2001) Specification of the world city network. Geographical Analysis 33, 181-94. Taylor, P. J. (2004) World City Network – A Global Urban Analysis. London: Routledge. Taylor, P J and Aranya, R (2006) A Global ‘Urban Roller Coaster’? Connectivity Changes in the World City Network, 2000-04 GaWC Research Bulletin No. 192 Taylor, P. J., Catalano, G. and Walker, D. R. F. (2002a) Measurement of the world city network, Urban Studies 39, 2367-76. Taylor, P. J., Catalano, G. and Walker, D. R. F. (2002b) Exploratory analysis of the world city network. Urban Studies 39, pp. 2377-94 Taylor, P. J., Catalano, G. Walker, D. R. F and Hoyler, M (2002c) Diversity and power in the world city network Cities 19, 231-41 Taylor, P. J and Walker, D. R. F (2004) Urban hinterworlds revisited Geography
Table 1 Network Connectivities in 2000
Note: in all tables the ‘greater China cities’ are emboldened
Table 2 Network Connectivities in 2004
Table 3 Relative connectivity change, 2000-04
Table 4 Hinterworld properties of Pacific Asian cities
Table 5 Typology of cities based upon interlocking network analyses
Figure 1 Changes in network connectivity world rankings, 2000-04
Figure 2 The leading sub-nets of cities in the world city network, 2004
Edited and posted on the web on 22nd September 2006
|
||||||||||||||||||||||||||||||||||||||||||||||||||||