GaWC Research Bulletin 154 |
|
|
|
This Research Bulletin has been published in Tourism Review, 60 (1), (2005), 12-19. Please refer to the published version when quoting the paper.
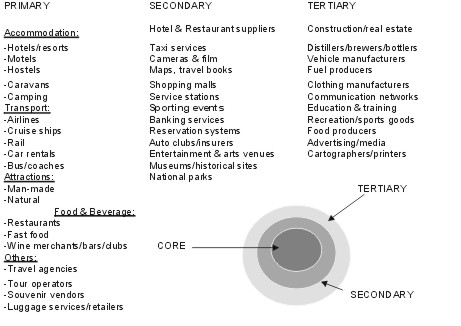
1. INTRODUCTIONIn this paper the development of the Olympic Games (the biggest mega sport and media event ever) is analysed as an interesting case in the sport-tourism relationship. The Olympics are indeed the biggest show on earth the most participants in history, spectators on site and the greatest television audience ever (Fortune Magazine, May 1996 p. 33-56). This marriage of convenience between sport and tourism will be explored and exemplified, first in general and second by means of on historical overview and the economic impact of the Olympic Games. 2. SPORT AND TOURISM2.1. Relationship between Sport and Tourism2.1.1. Tourism and the Tourism Industry According to a World Travel and Tourism Council report (www.wttc.org) discussing the economic importance of tourism in the year 2004, tourism is the world's largest industry and largest employer with $US 5,490.4 billion in gross output and 214.7 million jobs or 8.1% of total employment. Countries now boast considerable potential for developing different strategies to attract tourists. The basic facilities (cf. figure 1) a visitor to a place looks for are:
"Today, [this has been] added to by new [tourism factors] such as fairs, exhibitions, congresses, sporting and cultural events, all of which occupy an international arena. (Verdaguer, cited in Montanari & Williams 1995 p. 193-198) Medlik (1996 p. 252) describes the tourism industry as: firms and establishments providing attractions, facilities and services for tourists. Some companies can be further categorised as falling into the tourism-related industries if their activity and revenue is significantly dependent on tourists (this is shown as a Core or Primary tourism provider in Figure 1). Those companies that benefit indirectly from tourism through their dealings with core tourism-related businesses are classified as Secondary (i.e.sporting events) and Tertiary beneficiaries of tourism. Figure 1: The Core Tourism Model
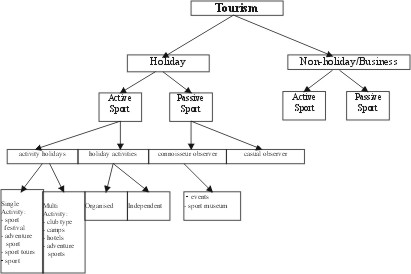
Source: based on A National Tourism Strategy, Australian Tourism Commission, Canberra 1992 p. 5. 2.1.2. Definition of "Sport Tourism" All forms of active and passive involvement in sporting activity, participated in casually or in an organized way for noncommercial or business/commercial reasons, that necessitate travel away from home and work locality. (Standeven & De Knop 1999 p. 12) Sport influences tourism in a number of ways (see Figure 2). More and more people are interested in activity vacations from which niche markets have arisen for tourism suppliers and operators. A good example of this is horse riding camps, hang-gliding, parachuting, rafting, etc.. A typical trip can be arranged with the exclusive intention of practicing a sport or, indeed, starting something new. There is also another class of sports tourist who is sometimes a passive and sometimes an active spectator. For example, agents and operators arranged tickets and trips to cater for the connoisseur observers' in France for the 1998 World Cup. The spreading of sport, therefore, leads to a complementary expansion of sport-related tourism. And the Olympics have contributed a great deal to the dispersion of sport around the world with its 199 National Olympic Committees and regional athletics competitions having sprung up all over the world (such as the Commonwealth Games since 1930, Asiatic Games since 1951 or African Games)(Augustin 1995, p.33) as well as the Paralympic Games. Figure 2: Tourism as it Flows through Sport
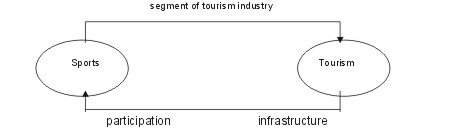
Source: Standeven & De Knop 1999 p. 13. 2.1.3. Tourism and Sport; a Two-Way Relationship The authors, Standeven and De Knop (1999) also explain that the sport-tourism relationship works both ways. Ski holidays are a good example of this. An interest in the sport can develop despite having no natural facilities in the practioner's local region. Thus the ski industry develops elsewhere to cater for the incoming enthusiasts. The Olympics is an interesting case in the sport-tourism relationship. If examined from the tourism side of the relationship, The Olympics contribute, ... permanent value to sport in the local community,...But, according to Standeven and De Knop these facilities may be over-sophisticated for community use. The two-way relationship explained here is shown in Figure 3. Figure 3: The Interrelationship between Sport and Tourism (The Basic Model of 'Sport Tourism')
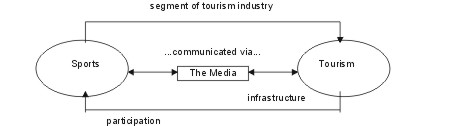
Source: Standeven & De Knop 1999 p. 5. 2.2. Olympic Sport as a Mega-EventOrganizing major events, for example the Olympic Games, can bring benefits to the host nation such as prestige and improved national morale. (Ritchie 1988 p. 2-11 & cited in Standeven & De Knop 1999 p. 213) What impact do The Olympics have on local communities? It is known that localised participative or spectator sports can contribute to tourism (i.e. local teams travelling to play away from home), and that tourism in turn can lead to local sports development. But when the sport is a mega-event, the added impact of the media means that the sport/activity is communicated to a much wider audience. Therefore, the relationship between tourism and sports and tourism and mega-event sports differs, as shown in Figure 4. Figure 4: The Interrelationship between Sports Mega-Events and Tourism
Source: revision of Standeven & De Knop 1999 p. 5. 2.2.1. Relationship between the Games and Tourism The relationship between the Olympics (which are the greatest sport event) and tourism is obvious. The diverse preparations in Sydney for the 2000 Games not only cater for the 11,116 athletes, but also take into consideration the potential tourism inflow from Olympic spectators (which could number in the millions), athletes' families, and an estimated 15,000 media personnel. Tourism stands to benefit directly and indirectly from The Olympics through economic and employment spin-offs. And when the Olympics leave the organising host city the Olympic-standard sports facilities will be at the disposal of many sports enthusiasts. Indeed the facilities will be sophisticated, but Sydney has a population of over 4 million people and had a well established tourism industry before the Olympics. The criticism of over-sophistication and waste levied at previous mega-events (such as the Albertville and Barcelona Olympics, Brisbane and Seville Expos) can not be made on Sydney. The Sydney Organising Committee of the Olympic Games (SOCOG) have gone to great lengths to make the facilities sustainable and recyclable in one form or anotherhence the title the Green Games'(see § 3.4.2.). 3. THE OLYMPIC GAMESThe International Olympic Committee (IOC) was founded at the (23 of June) 1894 Paris Congress by Baron Pierre de Coubertin (who was also its Secretary General until 1924). The first president was Dimitris Vikelas. The IOC moved their base to Lausanne, Switzerland, in 1915. It's main responsibility is to supervise the organisation of the summer and winter Olympic Games. De Coubertin defined it as; The laying of the foundations of the Olympic idea. (Olympia & Olympic Games 1999 p.118) The IOC is a non-profit, non-governmental organisation that, alongside overseeing the smooth running of the Olympic events, owns and protects the rights to all Olympic symbols, flags, mottos, anthems and Games as part of the umbrella term the Olympic Movement'. 3.1. Short Historical Overview of the GamesAlmost three millennia separate the Ancient and Modern Olympic Games. Yet, despite the time separating the two Olympics, the same spirit of peace and unity has prevailed. Founder of the Modern Games, Barron Pierre de Coubertin sums it up best: The irreplaceable value of the Olympic Games consists in that they are peculiar celebrations during which people of all religions, all tribes, all nations and all ranks can be unified with the others and during which it is revealed to them the deep sense of community above every kind of difference and border.It is necessary and advantageous to regard and cultivate the Olympic Games as a great celebration of the whole mankind, because in this way it promotes mankind. (Olympia & Olympic Games 1999 p.17) 3.1.1. The Ancient Games Interestingly, the origins of the English word for sport stem from the old' French word desport , from the verb desporter which meant to embattle or do battle. The perhaps ironic connection between this word and the idea of the Ancient Olympic Games being foremost an occasion to promote truce from the wars and battles that plagued ancient Greece at the time should not be overlooked. The word appeared again in a 12 th century French book called the Eneas. This text used the word desporter to characterise all genre of amusement for passing the time agreeably. (Thomas 1991 p.15). Again centuries later, Rabelais referred to the word simply as amusement. Eventually, the word was imported into English as disport via soldiers returning from battle on the Continent in the 15 th century. The di' was inevitably removed and the stem (sport) in English currently means, according to the Council Of Europe (1992): All forms of physical activity, which through casual or organised participation, aim at improving physical fitness and mental well being, forming social relationships, or obtaining results in competition at all levels. (Standeven and de Knop 1999 p.7&8) Clearly the word sport' has evolved significantly in meaning since it was first introduced into England six centuries ago. However, evidence on pottery, frescoes and sculptures indicate the existence and, thus, practice of sport as far back as between 3,000 to 1,500 BC. Sporting activity has been documented in the Greek text the Iliade . In this text, Achilles organises an event incorporating athletic activities to commemorate the death of his companion Patrocle. The Ancient Games were conducted between 884 BC and 393 ADand regularly every four years from 776 BC (= the First Olympiad) until around 393 AD. Theodosus, then Emporer of the Holy Roman Empire, condemned the Olympic Games as unchristian; believing them to be part of a religious festival honouring the pagan God Zeus and other unholy ceremonies. He eventually banned the Olympics, which marked the end of an era. The Ancient Games were held at the ancient site Olympia, which is located in the north-western part of the Greek island, the Peloponnese. 3.1.2. The Modern Games: The Summer Games The modern Olympic Games have gone from very humble beginnings in Greece in 1896 to a sporting mega-event second to none in the new millennium. But the rise of the Games was not all clear sailing. French aristocrat, Baron Pierre de Coubertin (1863-1937) together with the Greek, Georges Averoff (1818-1899), founded the new Olympic movement. Initially, they had difficulties financing the first Modern Games in 1896, but eventually found support in two prominent Greek industrialists. The Games survived two World Wars, terrorist attacks in Munich (1972), riots in Mexico City (1968), boycotts in Russia (1980), quarantine and logistical problems in Australia (Melbourne in 1956, not Sydney in 2000), pipebomb attack and communication problems in Atlanta (1996), near financial collapse after the Montreal Games (1976)(but since then always with positive figures)) and many smaller challenges and tribulations. Since Atlanta 1996 it was the first time all of the then registered National Organising Committees (=197) attended the Games together. The modern Olympic Games continued to put on the biggest show on earth with Sydney (2000) culminating a century of wonderful successes that far outweigh the trials. Athens (2004) has got a negative image because of the delay in constructions of infrastructure, but after all the Games were unbelievable dream games. The historical overview is showed in annexe 1. Next Olympic Games are planned in Beijing (2008), and the candidates for 2012 are Paris, London, Madrid, Moscou, New York. Is it a joke or not, Flanders is preparing (feasibility) studies concerning the opportunities to organise the Games in 2016! Table 1: Olympic Games Comparisons (1896-2004)
Source: slightly altered from IOC Marketing Matters 1996, pp. 1-16 & estimates for 2000 by SOCOG, and update. The history of The Games has, on the whole, been an example of success through continuous growth in terms of the number of countries where broadcasts (cf. table 1) of The Games are available. This is where organisers of The Games pride themselves the most, being able to deliver their message of hope, peace and goodwill to every corner of the globe. As Richard Pound from the IOC aptly put it; You turn on the (TV) set and see athletes of the world...trying as hard as they can to win and yet remaining friendly. It says something to the rest of the world about what is really possible. Now that the summer and winter Olympic events alternate every two years, the spotlight returns to The Olympic Flag, Rings (symbolising the five continents) and Motto (Citius, Altius, Fortius = Swifter, higher, stronger) twice as often. 3.1.3. The Winter Games Though sometimes in the shadow of the Summer Games, the Winter Olympics deserve in their own right to be classified as a truly spectacular four yearly event. They provide an unparalleled forum for the finest talent in winter sporting to gather in the one place. Like the Summer Games, the Winter Olympics are offered to a number of potential host cities (countries) up to 10 years ahead of the scheduled time of the competition to allow the nominees to submit proposals and to lobby the International Olympic Committee for the right to host (see § 3.3.) the Games. During 1999 this process was cast in a bad light with accusations of bribery and corruption surrounding the Salt Lake City application to host the 2002 Winter Games. The IOC were under fire from the media to justify their selection process and announced at the end of 1999/ early 2000 that the procedure would be overhauled to ensure a free and open Olympics host city bidding process. As with the Summer Games (which are usually referred to simply as The Games'), the chronology of Winter Games and host countries is given (annexe 2). Interesting to note that in the 1994 the Winter Games occurred only two years after the Albertville Games in 1992. This was a conscious decision by the IOC to stagger the Winter and Summer Games in order to be able to concentrate their efforts individually to the two events and to draw media and public attention on the Games twice as often. After 11 September 2001 het world changed a lot and there was a real fear for other terrorism attacks. Fortunally the Winter Olympics in Salt Lake City were very successful. The budget for security has increased extremely (like in Athens 2004). The next venues are planned in Turin (Italy) in 2006 and Vancouver (Canada) in 2010. 3.2. The Sydney Olympic Games in 2000 (= The Millennial Games)The Games began September 15 and the 27 different sports (Tae-Kwon-Do and the Triathlon new for these Games) and 11,116 athletes competed for world glory over the 17-day extravaganza. Like Atlanta, all NOCs attended the 2000 Games. And, again like Atlanta, huge audiences were expected via terrestrial and satellite television: 25 billion cumulative global audience watching +/- 3,000 hours of feed by host broadcaster Channel 7. In fact, television will again be the winner at Sydney, playing the all-important role of spreading the Olympic message of peace and unity. SOCOG claims that the Sydney Games will be the first to be fully digital, which means 100% documented and reproducable by the 15,000 strong media presence. 3.2.1. Facilities and Services All Olympics events, with few exceptions, were be conducted within the Sydney metropolitan area. Construction of new facilities was on a need only basis. Some facilities were built independent of the Olympics but will be put to use during the Games, such as the Penrith Lakes project. The big Olympic Zone for over half of the sports including athletics events, cycling and swimming, was the Olympic Park (660 ha) at Homebush Bay, 14 km from the CBD of Sydney. Another eight sports are expected to be housed within the Sydney Harbour Zone, such as basketball and weight lifting and yachting on the Harbour itself. Equestrian events were going to be at Eastern Creek, shooting at Holsworthy, soccer at the Sydney Football Stadium and mountain biking at Calmsley Hill. Accommodation An officially appointed tour operator by NOCs from each attending country should wase able to package accommodation, tickets, transport and tours together. There was also a residential accommodation scheme to billet private housing to the millions of visitors to Sydney for the Games. Tickets News about ticket misappropriation came to light late in 1999 with SOCOG defending their allocation decisions and promising to rectify the situation before the Games commence. In total 9.6 million tickets were intended for sale. Cost for tickets vary depending on venues attended and the staging of events (e.g. the Opening Ceremony is more expensive than the heats of the cycling). Transport SOCOG would obviously like to prevent a repeat of the logistics problems in Atlanta. Sydney has spent a lot of time and money refurbishing and reorganising its public transport system in preparation for the Games. The new rail link is able to carry 50,000 passengers per hour between venues and the Sydney Olympic Park. Private car access to the park area during the Games was prohibited to reduce the transport anomalies. The Sydney Harbour was also function as an active means of Olympic (water)transport. Visas and Tourism Many countries require a visa to enter Australia. Travel agencies handling Olympic packages or trips to Australia can usually arrange visas also. Touring after the Games were is recommended. Australia is a vast continent with natural and cultural diveristy; from deserts, to rainforest, beaches to cosmopolitan cities. Australia offers modern city living and 50,000 year-old native culture (e.g. Aborigines) in the one package. Television Television coverage of the Centennial Games of Atlanta 1996 topped all previous records with 3,000 hours of Olympic coverage by NBC, the host broadcaster. The 1992 Games in Barcelona managed 2,700 hours. Atlanta also attracted the largest cumulative television audience to date for an Olympics with a global cumulative audience of 20 billion over the 17-day event. The 1992 Games in Barcelona recorded an impressive 16.6 billion viewers. The Centennial Games was available on television to an estimated 226 countries world-wide, 33 more than in Barcelona. Additionally, estimates indicate that 142 countries televised Atlanta on national channels, 89 with access to a second foreign channel and 66 countries received satellite coverage. 3.2.2. The Green GamesWith a budgeted spend of around $A2.3 billion which, it has already been revealed, may have been blown out to $A5.2 billion, hosting the Olympics is not a cheap way to draw attention to a tourist destination. How the money is spent and what will happen to the faciltities built after the mega-event leaves town are questions being asked by green campaigners against the mass waste that huge international events can represent. A wave of criticism washed over the Spanish government in the wake of its purpose-built 1992 Expo site in Seville which had little or no sustainable features once the event closed. Later the same year, although a huge tourism success following Barcelona's hosting of the Olympics1,, the Spanish were again criticised for not anticipating sustainable development concerns. Australia learnt a valuable ecological lesson about hosting mega-events after the 1988 Brisbane Expo, which was much maligned for the waste of resources going into what ended up being a disposible expo'. Virtually nothing could be used of the expo facilities along the Brisbane river site. The Committee for Sydney's Olympic Games and the Olympic Co-ordination Authority invested a great deal of time and millions of A$ into a cleanup of the Olympics site at Homebush Bay which, it has since been discovered, was the dumping site for highly toxic dioxins during the time it was a Union Carbide (chemical) factory. Despite unfavourable media attention regarding the so-proclaimed Green Games; that the dioxin contamination in the Bay area was 1,500 times higher than accepted levels (Hanna 1998 p.44-49) and that the government had covered up a report on the site during its Olympic bid process; there have been some Green' highlights worth talking about in the lead up to the Games in September 2000:
The Olympic Co-ordination Authority's (1995 p.13) Green Olympics vision is a long-term one; encapsulat[ing] the elements of a complete and integrated approach to sustainable development. 4. Economic Impact of the Olympic GamesOlympic host nations invest a lot of time and money into earning the right to host the Games. Being an Olympic host nation is usually a great privilege. The value of which can be measured in terms of national pride, world status and a grand platform to promote a destination. But there is also a more tangible benefit of hosting the Olympicsthat being economic growth, tourist revenues and increased employment. At least that is the common belief held by people surveyed by the Australian Tourism Commission (26% of respondents stating increased tourism' as a perceived benefit of hosting the Games, 25% stating general economic boost'). Analysts differ in opinion as to how much added value the Olympics brings to a country. For example, two investigations into the expected additional economic value due to The Games came to different conclusions. The KPMG Peat Marwick report on additional visitors expected to Australia through hosting the Games (between 1994 and 2005) differed to the Australian Tourism Commission (ATC) report by up to 1.1 million. Richardson (1995 pp.59-61) elaborates on this disparity, saying that, with average spending per overseas visitor at $A1,794 (1993), the net difference between these two impact studies (using KPMG's most likely scenario) could be around $A1.6 billion. The ATC conducted another study in 1998 and revised the expected extra visitors to Australia to 1.6 million (cf. 1.7 in reality, see table 4) which translates into $A6.1 billion in extra earnings between 1977 and 2004. The ATC are leaving nothing to chance, spending $A12 million over four years (1997-2001) to stimulate this extra tourism demand. KPMG also predicted that, between 1991 and 2004, the Olympics should create 175,006 extra jobs. However, economic analyst, Geoff Carmody, estimated extra employment due to the Olympics to be one fifth that. He was also unconvinced of the tourism and economic growth prospects at the hands of the Games, putting expected growth in inbound tourism at possibly less than 5% with only a 0.33% improvement in GDP (Gross Domestic Product). 4.1. Centennial Games (Atlanta 1996) Budget Forecast Before the Games, ACOG estimated that hosting the Olympics would have a net economic impact of US$ 5.1 billion dollars (2.4 billion from ACOG spending and 2.7 from sporting events, media, athletes, officials and spectators) on the state of Georgia over the six-year period from 1991 to 1997. This added value was predicted to result from new money coming into the state, primarily in and around venue locations. Positive predictions were also made for short-term Olympics related employment gains and incremental personal and corporate tax revenues in the periods following the Games. Table 2: The Centennial Olympic Games Budget (Atlanta 1996)
Source: PressGuide Atlanta Games 1994 p. 38. 4.2. Sydney 2000 Games Budget Leaving aside the differing opinions on how much spin-off potential the Olympics carries, perhaps the net impact should be measured more in terms of the Olympics' unique ability to attract the attention of the world's media. The Australian Tourism Commission (ATC) said in their report on The Games that during the 17-day event the Olympics website is preparing for over three billion visits. And in the 1997/8 financial year (June to June), the Olympics already generated an additional $A48 million in positive publicity for Australia. The conclusion: The Games raise awareness of a host country in the minds of people from all over the world. This could translate into future business. The ATC conducted research back in 1998 which highlighted that Germans knew that the Games would be held in Australia and 45% said they would consider a holiday to Australia within the next four years. SOCOG produced a working and planning budget for the hosting of the Games in 2000. This budget was released in May 1997. Based on estimates, the Games are expected to run at a net surplus of $A 42.7 million after contributing $A 363.6 million to the New South Wales (NSW) Government for venue rental, construction, management and security. For an overview of the Sydney 2000 Olympic Games Budget, refer to Table 3. Interesting to observe that the greatest expected expenditure is allocated to technology, premises and administration', followed closely by venue management & security', which is a payment to the New South Wales Government. A significant sum has also been awarded to media: press & broadcasting' and sponsorship & general marketing', which confirms the financial and qualitative value attached to this very important part of hosting a mega-event the enormity of the Olympics. Perhaps surprising is the relatively small amount dedicated to what has been simply called sport'. Given that the Olympics is a sporting mega-event, it seems strange to see the word sport mentioned in this financial statement just once and for such a small financial contribution. This is perhaps a philosophical question that may need elaborating in the future, and, indeed, has been discussed in relation to the Olympics (the over-commercialisation argument) leading to the Centennial Games being dubbed the Coca-Cola Games (Atlanta 1996). It is not a subject for this particular paper, however. For a better look at the breakdown of revenue sources for the Sydney 2000 Games, refer to table 3 and Funding in table 1. Table 3: The Sydney 2000 Olympic Games Budget
Source: Official Site of the Sydney 2000 Olympic Games -SOCOG 1997 4.3. Impact of the Sydney Olympics on Tourism The (Australian) Tourism Forecast Council should have the final say:
A well planned, properly marketed and publicised mega-event like the Olympic Games attract millions of foreign and domestic visitors to a place. Tourists attend the event and spend money in related tourism businesses while it is being held. They also visit surrounding tourist destinations and attractions and may even extend their stay to take in attractions in other cities and states outside the event perimetres. The flow-on effects of event tourism are numerous: they act as image maker, travel motivator, stimulator of infrastructure and communications development, employment generator, add to gross domestic product and generally boost the economy of the host nation. Some criticism has been levied on governments for not doing enough to lure major mega-events like the Olympics to their shores. Other critics say the net benefits to a place are overrated given the cost of building world-standard facilities to host such mega-festivals, which is increasingly being born by tax payers, and the inevitable disruptions to normal business, residents, the environment and the general living conditions. Event tourism must, therefore, seek to enhance the attractiveness of individual events and festivals and to use them to enhance destination attractiveness. [he also states] Successful events can enhance the image of the destination, generating an important but often unmeasurable increase in general-purpose tourism. (Getz 1991 p.23-36) . At the same time the event organisers and government participants must be seen to be working toward minimising disruption to local residents in the short-and-long-term, and maximising the return on investmentboth financial and emotionalto the private and public contributors. Admittedly, this is a delicate balancing act, one that organisers past of the Olympics have not always been able to achieve. Table 4 illustrates the summarised results for the Sydney Games 2000 and the impact on Tourism in Australia:
Source: X, Australia's Olympics, Special Post Games Tourism Report, ACT (Australian Tourist Commision), 2001, p.1,4. CONCLUSIONWe have seen that sport and tourism in general and the Olympics in specific have developed into major economics sectors showing steady growth since 1984 in Los Angeles. This analysis suggests that sport tourism must be considered a sector of some significance in the economy of many countries. The most of Olympic cities boomed in tourism and became famous resorts. It is especially the case with wintersport resorts such as St.Moritz in Switserland, Cortina d'Ampezzo in Italy, Garmisch- Partenkirchen in Germany or Chamonix in France. Barcelona is the best example to illustrate the urban renewal and the explosive increase in number of tourists since the Olympic Games in 1992: 1,727,610 tourists in 1991; 2,455,249 in 1993 and 3,149,002 in 2000 (X, Cahier Espaces 74, 2002, p.1331) Athens 2004 resulted in a lot of new infrastructures for (public)transport. The new airport Eleftherios Venizelos (19km north of Athens),opened april 2001 and has a capacity of 16 million passengers. Yet the economic benefits attributable to sport tourism have to be offset against the costs involved and these are not limited to financial costs. Any benefits must be seen in the context of sociocultural and environmental impacts involved. If sport tourism is developed for economic gain without regard to its other impacts, there is a very real danger that its true costs will greatly exceed its economic value. But well planned and organised sport tourism (e.g., Olympic events) can be a roaring success. REFERENCESAugustin, J.P., Sport Géographie et Aménagement, Nathan Universié, Paris, 254p. De Groote, P., Panorama op Toerisme, Garant, Leuven/Apeldoorn, 1999, 354p. De Groote, P., A Multidisciplanary Analysis of World Fairs (=Expos) and Their Effects, Toeractua 1997/1, Limburg University Centre, Diepenbeek, 1997, 21p. De Groote, P. & Nielsen, C., The Olympic Games & Tourism, Toeractua , 1999/4, LUC, Diepenbeek, 31 p. Demullier, L., Heirman, A. (editors), Het Nieuws van de XXste eeuw. Vlaamse ooggetuigenverslagen over gebeurtenissen in binnen- en buitenland, Deel I 1900-1949, Scoop, Gent, 1999, 272p. De Veene, C., Hereng, J., Olympische Spelen, Artis-Historia, Brussel, 1984, 152p. (+ updates) Ejnès, G., De Olympische Spelen 1896-2004 van Athene tot Athene, Lannoo & Musée Olympique Lausanne, 2004, 312 p. Elias-Varotsis, S., Le Tourisme Evenementiel en Australie: enjeux et perspectives, unpublished paper, Université Paris XII, 199X. Xp. Fayos-Sola, E., "Conference Report: The Impact of Mega Events", Journal of Travel Research, September 1997, p. 243-4. Getz, D., Festivals, Special Events, and Tourism, Van Nostrand Reinhold, 1991, 374p. Goldblatt, J.J., Special Events: The Art and Science of Celebration, Van Nostrand Reinhold, New York, 1990, 386p. Gold, J., Ward, S. (editors), Place Promotion: The Use of Publicity and marketing to Sell Towns and Regions, John Wiley & Sons, Baffins lane (Chichester), 1994, 268p. Hache, F., Jeux Olympiques: La Flamme de l'Exploit, Gallimard, France, 176p. Hanna, N., The Millennium: a Rough Guide to the Year 200, Rough Guides, London, 1998, 262p. Kotler, P., Haider, D., Rein, I., Marketing Places, The Free press (Macmillan), New York, 1993, 388p. Lolkama, J., Triomf en Tragiek van de Olympische Spelen 1896-Heden, De Vrieseborch, Haarlem, 1992, 167p. Medlik, S. (editor), Managing Tourism, Butterworth-Heinemann, Oxford, 1991, p. 191-198 (344p.) Medlik, S. Dictionary of Travel, Tourism and Hospitality (2 nd Ed.), Butterworth Heinemann, Oxford, 1996, 332p. Montanari, A., Williams, A. (editors), European Tourism: Regions, Spaces and Restructuring, John Wiley & Sons, Chichester, 1995, 284p. Ritchie, B., "Assessing the Impact of Hallmark Events: Conceptual and Research Issues", Journal of Travel Research, Vol. 23(1), 1988, p. 2-11. Ritchie, B., Yangzhou, J., "The Role and Impact of Mega-Events and Attractions on National and Regional Tourism", AIEST Conference Report 37, Vol. 28, St. Gall, 1987, p. 17-58. Roche, M., "Mega-Events and Micro-Modernization; On the Sociology of the New Urban Tourism", British Journal of Sociology, Vol. 43, 1992, p. 563-600. Short, J.R., "Going for Gold: Globalizing the Olympics, Localizing the Games", GaWC Research Bulletin 100, 2003, 21. Socher, K., Tschurtschenthaler, P., "The Role and Impact of Mega-Events: Economic Perspectives- The Case of the Winter Olympic Games 1964 and 1976 in Innsbruck", AIEST Conference Report 37, Vol. 28, St. Gall, 1987, p. 103-119. Standeven, J., De Knop, P., "Sport Tourism", Human kinetics, Champaign, Ill., 1999, 367p. Thomas, R., Histoire du Sport, Presses Universitaires de France, Paris, 1991, 127p. Witt, S., Martin, C., "Measuring the Impacts of Mega-Events on Tourist Flows", AIEST Conference Report 37, Vol. 28, 1987, p. 213-221. XX, Olympia & Olympic Games, Editions M. Toubis, Athens, 1999, 176p. XX, Olympic Movement Directory, The International Olympic Committee, Lausanne, 1996, 159p. XX, World Travel Atlas, Columbus Press Ltd, London, 2002(8), 224p. + 16p. annexes. XX, Sport & Toerisme, Sportacahier Congresverslag dec. 9, 1994, U.I. Antwerpen, 1994, 92p. XX, Le Livre Officiel des XVIIes Jeux Olympiques D'Hiver Lillehammer 1994, J.M. Stenersens Forlag A.S., Oslo, 1994, 303p. XX, 1896-1996 Kroniek van 100 Jaar Olympische Spelen, Chronik Verlag, Munich, 1995, 310p. XX, World Travel Dictionary, Columbus Travel Guides, London, 1998, 208p. XX, St. Moritz: 125 Jahre Erholung und Sport/Heilbad seit 3000 Jahren, Orell Füssli, Zürich, 1989, 160p. XX, Economic Impact Study of the Sydney 2000 Olympic Games, report, Arthur Andersen, Centre for Regional Economic Analysis, University of Tasmania, January 1999, 30 p. + Executive Summary, 7 p. Articles & Other Kurtzman, J., Sport! Tourism! Culture!, paper presented on the Symposium on Sport and Tourism, Barcelona, 24/2/2001, 21 p. Persson, C., A background to the host selection for the 2002 Olympic Winter Games, The Tourist Review, 3/2000, p.8-20. XX, Barcelona Olympic Games: a successful example of project management, Ajuntament de Barcelona, Report from the Project Management World Congress, Florence, 1992, 30p. XX, Les Répercussions Economiques des Jeux Olympiques de Barcelona 92, Ajuntament de Barcelona, Report 1992, 23p. XX, Visitors to Barcelona during the Olympic Games, Barcelona Tourism News, No. 12, Jan.-March 1993, p.3 XX, "Empowering the Olympic Movement- A Look at the Business Dynamics Behind the Olympics", Fortune Magazine- Special Report, May 1996, p. 33-56. XX, "Marketing Matters (The Olympic Marketing Newsletter), IOC Marketing No. 10- Winter, Lausanne, 1996, p. 1-16. XX, "Marketing Matters (The Olympic Marketing Newsletter), IOC Marketing No. 9- Summer, Lausanne, 1996, p. 1-16. XX, Press Guide Atlanta 1996, Atlanta Committee for the Olympic Games, 1994, 99p. XX, ABS (Australian Bureau of Statistics) Year Book Australia 1999, CD-ROM. XX, Australia's Olympics, Special Post Games Tourism Report, ACT (Australian Tourist Commision), 2001, p.1,4. XX, Evénements tourisme et loisirs, Les Cahiers Espaces, 74, august 2002, 174 p. Internet Citations (URL:http://)www.abc.net.au/news/Olympics/1998/O5/grom1998052271.html (1998). www.athens2004.com www.msnbc.com/news/ , (1998, 1999) www.olympic.org/ (IOC & Olympic Museum) www.sydney.olympic.org www.smh,com.au/news/9809/25/national/national7 , ("Broadcasters to Make Sure They Get Their Money's Worth", 1998). www.sydney2000.com/ , ("Olympic Sydney 2000", 1998). www.wttc.org NOTES* Patrick De Groote, Limburgs Universitair Centrum, Belgium, patrick.degroote@luc.ac.be 1. The 1,492,000 visitors to Barcelona during the Olympics were just below the predicted flow of 1.6 million (Barcelona Tourism News, Jan-March 1993, N°12). ANNEXE 1 CHRONOLOGY OF THE SUMMER OLYMPIC GAMES (1896-2004)
Source: De Groote P., 2004. Based on:1996 Olympic Movement Directory, IOC 1996 p. 5-50 & Olympia
& Olympic Games 1999 pp.124-170 ANNEXE 1 CHRONOLOGY OF THE WINTER OLYMPIC GAMES (1908-2006)
Source: P. De Groote 2004, based on IOC Edited and posted on the web on 1st December 2004; last update 21st September 2005 Note: This Research Bulletin has been published in Tourism Review, 60 (1), (2005), 12-19 |
|||||||||||||||||||||||||||||||||||||||||||||||||||||||||||||||||||||||||||||||||||||||||||||||||||||||||||||||||||||||||||||||||||||||||||||||||||||||||||||||||||||||||||||||||||||||||||||||||||||||||||||||||||||||||||||||||||||||||||||||||||||||||||||||||||||||||||||||||||||||||||||||||||||||||||||||||||||||||||||||||||||||||||||||||||||||||||||||||||||||||||||||||||||||||||||||||||||||||||||||||||||||||||||||||||||||||||||||||||||||||||||||||||||||||||||||||||||||||||||||||||||||||||||||||||||||||||||||||||||||||||||