GaWC Research Bulletin 153 |
|
|
|
This Research Bulletin has been published in Journal of Urban Health, 79 (4), (2002), 445-463. Please refer to the published version when quoting the paper.
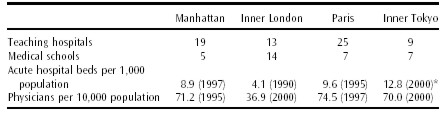
WORLD CITIES AND URBAN HEALTHUrban health evokes contrasting images: the city as a center of disease, poor health, and enduring poverty versus the city as a cradle of historic public health interventions, innovative medical cures, and healthy lifestyles for the well-to-do. New York, London, Paris, and Tokyo are good examples of such contrasts. These world cities (also known as global cities) are the largest ones among the wealthy nations belonging to the Organization for Economic Cooperation and Development (OECD). They are renowned for their roles as central hubs in global city-regions and their international dominance in high-level functions of government, business, the media, and the arts.1,2 Each of these cities has the highest numbers of older persons and children in its respective nation. Within each city, there are neighborhoods that range from some of the wealthiest in their nations to some of the poorest. The contrast has provoked caricatures of third-world life within first-world cities and analysis of why health and quality of life can be so unevenly distributed within urban areas.3 In this article, we introduce the World Cities Project (WCP), our rationale for it, our framework for comparative analysis of urban health in world cities, and an overview of our current studies in progress. THE WORLD CITIES PROJECTThe WCP, a joint venture of the International Longevity CenterUSA and New York University's Wagner School, uses New York, London, Paris, and Tokyo as a laboratory in which to study urban health, particularly the evolution and current organization of public health infrastructure4 and the health status and quality of life in these cities. Despite a growing recognition that public health systems play a crucial role in promoting health,5,6, there are no good descriptions of urban public health infrastructure in world cities. One aim of the World Cities Project, therefore, is to compare systematically the public health infrastructure in these four cities. New York City has the most local control and responsibility over its public health infrastructure and health systems. London, Paris, and Tokyo are capital cities in strong unitary states that have more power to intervene in the life of their capital. Nonetheless, health protection in all four cities involves important links between local, subnational, and central or federal authorities. Beyond describing the public health infrastructure of each city, a major focus of our inquiry is to explore the impact of world citiestheir health system and neighborhood characteristicson two outcomes: the use of health services and health status. In measuring these outcomes, we are limited by available indicators and city-level data. For use of health services, we focus on selected hospital procedures by neighborhood of residence. For health status, we focus on conventional indicators by neighborhood of residence, including age-specific mortality rates, morbidity (e.g., incidence of reportable diseases such as tuberculosis [TB] or human immunodeficiency virus/acquired immunodeficiency syndrome [HIV/AIDS]) and hospital discharge rates by selected diagnoses. Our initial studies examine conditions that are prevalent in the population (e.g., coronary heart disease [CHD]). We focus on three aspects of health system characteristics: (1) medical resources (a high density of medical schools, tertiary hospitals, and physicians); (2) levels of health insurance coverage; and (3) organizational factors. We also emphasize two dimensions of neighborhoods: (1) the socioeconomic status and demographic characteristics of the population and (2) the quality of the built environment and collective resources, including aspects of social capital. The assumption guiding our research is that differences in health system and neighborhood characteristics among world cities will affect the outcomes defined above, both within and among world cities. There are important differences among the health system characteristics of world cities. London stands out as having the lowest number of teaching hospitals, acute care beds, and physicians (Table 1). New York City stands out as having the highest level (28%) of uninsured patients.7 In contrast to Parisians and Tokyoites, who are covered by national health insurance (NHI), and Londoners, who are covered by the National Health Service (NHS), New Yorkers are covered by a patchwork insurance system of public and private indemnity insurers and managed-care organizations. Even among older New Yorkers, most of whom are covered by Medicare (Parts A and B), there are significant gaps in coverage, such as coverage for prescription drugs. As for the organizational factors that differentiate health care among these world cities, there are at least two that are likely to affect use of health services and possibly health status: the specialty mix of physicians and the relative size of the public hospital sector. Again, New York City stands out as having a specialty mix of physicians least oriented to primary care and most oriented to specialist medical services. Although the New York City Health and Hospitals Corporation is the largest public hospital system in the United States, its relative size in New York is small compared to the role of public hospitals in London, Paris, and Tokyo. To compare these world cities, we are developing a database that will allow us to describe their public health infrastructure and examine indicators of the health, quality of life, and health and social services for older persons and children in each city. We highlight similarities and differences among New York, London, Paris, and Tokyo, as well as among neighborhoods within them, and raise questions that will generate more refined hypotheses for further study. Since New York, London, Paris, and Tokyo share some sociodemographic characteristicsgreater income inequalities and more ethnic diversity than their respective nation-statesbut have different health system characteristics (levels of medical resources, health insurance coverage, and organizational factors), the comparative analyses we conduct can provide insights into the possible effects of these health systems on the outcomes noted above. While it would be imprudent to draw causal inferences from such comparisons, observed differences in health status and medical care practices in world cities can suggest promising directions for new research. Beyond the research component of this project, in discussions with policymakers and program managers, we inquire about cases of best practices and interesting failures. When we discover innovative programs in selected neighborhoods that aim to improve the health of their population, we seek to learn more about them and to share this information with policymakers in other cities. In comparison to the typical study tour, the combination of our database with case material on innovative programs allows knowledgeable practitioners to interpret what they see. Since local authorities can sometimes implement innovative initiatives faster than their national governments (e.g., in the 1980s, cities in the United States and Canada passed ordinances banning ozone-depleting chlorofluorocarbons well before the 1996 deadline for eliminating them was set by an international treaty), such information about world cities can be useful to their governments and program managers.8 Table 1: Medical resources: Manhattan, Inner London, Paris, and Tokyo (1995-2000)
Sources: Manhattan: New York State Department of Health. London: UK Department of Health and Health of Londoners Project. Paris: Ministe`re de l'Emploi et de la Solidarite´, Direction de la Recherche, des Etudes, de l'Evaluation et des Statistiques re´pertoire ADELI, January 1, 1998. Tokyo: Report on Survey of Physicians, Dentists and Pharmacists 1998, Tokyo Metropolitan Government, Bureau of Public Health, 2000. WHY COMPARE HEALTH SYSTEMS AMONG WORLD CITIES?Global trends in urbanization, emerging health risks and population aging justify our comparison of health systems among these four world cities. It is also important to study these cities because they exercise a dominant influence on megacities of developing nationsfor better or for worseand may provide some useful lessons. Finally, existing data and scholarship about world cities provide a firm foundation on which to develop comparative analyses of their health systems and health. Urbanization, Health Risks, and Population AgingThe world's population is increasingly concentrated in urban areas. Estimates by the United Nations indicate that 60% of the population will live in cities9 in 2030. There are now at least 20 megacities, defined by the United Nations as cities of over 10 million people; by 2015, there will be 23 such cities.10 The fastest-growing megacities are in developing nations, and by 2015, all megacitieswith the exception of Tokyo and New Yorkwill be in developing nations. Megacities in developing nations affect global health. Growth of air travel, migration, number of refugees, as well as the persistence of wars, famine, and natural disasters have magnified their vulnerability and their impact on world cities of wealthier nations. Megacities are increasingly viewed as instruments of social and economic development.11 They are strategic locations for transnational corporations, as well as for government and international organizations that seek to generate economic growth, reduce the birth rate, promote innovation, and protect population health.12,13 As urbanization, emerging health risks, and population aging increase, policymakers in megacities will need models for how to organize public health infrastructure and accommodate this population shift. The experience of world cities in establishing public health infrastructure, developing health systems, and attempting to overcome their own inequalities among diverse neighborhoods may provide useful lessons in meeting these daunting challenges. Lessons from World CitiesNew York, London, Paris, and Tokyo share a recent history of relative success in organizing public health campaigns and establishing a well-respected public health infrastructure to protect their population from disease. They are great centers for prestigious university hospitals, medical schools, and research institutions. They have been the sites for innovative strategies to improve the urban environment, protect their vulnerable populations, address outbreaks of infectious disease, develop organizational arrangements for health care delivery, and contribute to biomedical research. Moreover, they often influence, significantly, the growing megacities of developing nations due to their relative wealth and dominance, their ties to the global economy, and their concentration of business, cultural, and scientific activities. Despite the success of public health reformers and urban planners in improving their quality of life over the past century, these world cities still confront onerous health risksalbeit to different degreesfor at least four problems:
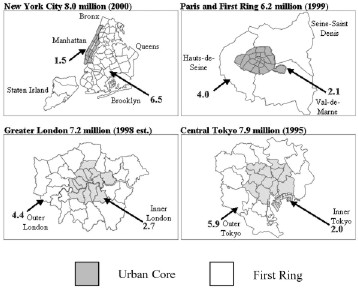
In addition to the challenge of renovating their public health infrastructure to meet emerging health risks, New York, London, Paris, and Tokyo also confront the worldwide trend of population aging.14 The populations in all of these cities are aging rapidly due to declining birth rates and increases in human longevity. This demographic shift has consequences not only for older persons, but for all age groups and for the organization of health and social services.15 Existing Data and Scholarship on World CitiesA final reason to compare urban health in world cities is that this effort can build on the existence of significant data for each city as well as scholarship on their economic functions, architecture, urban design, and transportation infrastructure.12,16,17 There is even a recent comparative study of New York, London, Paris, and Tokyo that focuses on their competitive strengths and weaknesses.18 A cautionary note, however, is in order. Although these world cities serve as headquarters of command and control for transnational corporations, international financial institutions, there are still formidable problems in collecting comparable data about them.19 Despite the interest in these cities and the images we hold of their monuments and buildings, comparative analyses of their health systems are notably absent in the comparative urban literature; leading scholars of urban health in an international context have not systematically compared world cities.20 Yet, comparisons of health and social characteristics among and within world cities can highlight a range of unexpected and equally compelling images of these vulnerable giants. WORLD CITIES AND COMPARATIVE HEALTH SYSTEMSThere is an immense amount of literature on cross-national comparisons of health systems and health and social policies in OECD nations.21 For example, health data for OECD member states are routinely published.22 Similarly, in its World Health Report 2000 , the World Health Organization (WHO) analyzed the performance of health systems in 191 countries.23 The problem with these studies, however, is that their focus on national aggregates masks important variations within nations, for instance, between urban and rural areas, large and small cities, cities and suburbs, and as discussed below, urban cores and their surrounding first rings (Fig. 1).24 Figure 1: Four world cities: urban core and first-ring populations (millions)
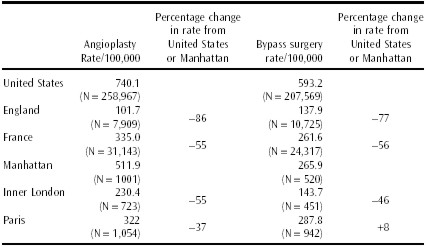
Much of the literature on cross-national comparisons of health systems and health and social policies focuses on analysis of public expenditure data and highlights the extent to which the United States is a welfare laggard or the odd man out in comparison to Western Europe and other OECD nations.25,26 In terms of developing an understanding of the distinctive characteristics of American health care financing and organization, this body of work yields important insights. It has also spawned a second, and equally important, form of cross-national research: comparative policy analysis.27-29 This approach addresses the following question: Given the ways in which the health sector in the United States resembles other OECD nations and the ways in which it is exceptional, what inferences can be drawn from comparative analysis for purposes of learning from abroad?3031 The third and the most recent development in cross-national comparisons of health systems is the effort to evaluate the performance of different health systems based on data assembled by such organizations as OECD, WHO, the World Bank, and the United Nations (UNICEF [United Nations Children's Fund] and United Nations Development Program [UNDP]).32-35 The first two approaches to cross-national comparisons are necessarily based on aggregate data at the level of the nation-state because that is the level at which the key policy decisions are made. This is appropriate in thinking about welfare, social security, and national health insurance because these programs affect whole countries. With respect to judging the performance of different health systems, however, there are at least three limitations to this approach. First, there are enormous variations in health and health system performance within nations.36 Second, there is no agreement on the boundaries of what we loosely call health systems and on the extent to which public health infrastructure is subsumed within this concept.37,38 To the extent that public health infrastructure is considered part of the broader health system, national comparisons are limited because there is great variation in public health functions among local and state governments in the United States, as well as in other nations. Third, it is exceedingly difficult to disentangle the relative importance of health systems from other determinants of health, including the sociocultural characteristics and neighborhood contexts of the populations whose health is measured. The World Cities Project represents a new approach to the comparative analysis of health system performance. It does not overcome all of the problems noted above. But, in contrast to nation-states, world cities have more characteristics and problems in common; therefore, they provide notable advantages for more refined comparisons and cross-national learning. Consider just two examples of how comparison of world cities can alter conventional views of national health systems based on aggregate data for nation-states. First, we compare data for bypass surgery and angioplasty in England, France, and the United States. Next, we examine population-based hospital admission data for these procedures, by neighborhood of residence, for Manhattan, Inner London, and Paris. The disparities are much lower among these cities than among the nations (Table 2). Second, in contrast to a recent study39 that found higher rates of angioplasty and bypass surgery within 1 year after a heart attack in the United States compared to rates for other OECD countries, we find significantly (at the .05 level) higher rates in Paris than in Manhattan.40 Our finding on the low rates of angioplasty and bypass surgery in England are not surprising to anyone familiar with Aaron and Schwartz's classic study of health care rationing in the English NHS.41 However, the national differences have narrowed significantly over time, and those between Manhattan and Inner London are far smaller than most observers of national health systems would expect. Also, one must adjust the London rates because private sector data are not included, which would create a 10% to 30% increase.42 Table 2: Cardiac procedures for older persons (65 years or older) in nations and world cities: Manhattan, Inner London, and Paris (1998-1999)
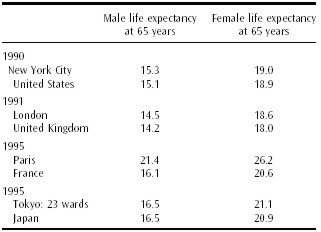
Sources: Manhattan: New York City Department of Health/Center for Health Statistics. London: Life Expectancy figures from Bone MR, Bebbington AC, Jagger C, Morgan K, Nicolaas G, Health Expectancy and Its Uses , London, HMSO, April 1995. Paris: Institut National de la Statistique et des E´tudes E´conomiques (INSEE), Chiffres et Indicateurs de´partementaux , Ministe`re de la Sante´ and Ministe`re des Affaires Sociales. Tokyo: Tokyo Eiseikyoku, Annual Report on Health in Tokyo , Vol. 48, Tokyo Statistical Association, 1997. United States, United Kingdom, France, and Japan: Organization for Economic Cooperation and Development Health Data 2000. The higher bypass rate in Paris is not related to national regionalization policies because we are comparing only rates of Parisians with those of Manhattanites. We have deducted all admissions of patients coming into these medical centers from the outside. Thus, the Manhattan comparison contradicts more conventional national comparisons and raises an important question for research. In the context of two centers of medical excellence with similar densities of cardiologists and a higher incidence of myocardial infarction in Manhattan than in Paris, does the lower rate in Manhattan reflect barriers to access that are not present in Paris? Since world cities include neighborhoods with some of the wealthiest and most disadvantaged members of their nations, we can examine these cities to investigate the impact of concentrated medical resources, health insurance coverage, and organizational factors on population health. Although there is strong evidence in the United States that urban populations suffer from higher rates of communicable diseases and premature mortality than their counterparts outside the city, we have found that, in New York, London, Paris, and Tokyo, older persons have a slightly longer life expectancy than their counterparts in their respective nations (Table 3).43-45 Whether this reflects higher per capita income or level of education, better access to medical care, stronger constitutions of older persons who have survived in world cities, or selection bias from locating there in the first place is not clear. Table 3: Life expectancy at 65 years of age: world cities and nations (1990-1995)
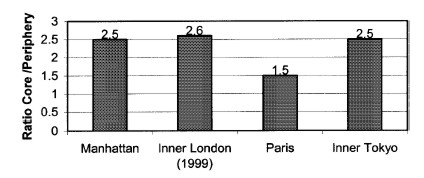
Sources: United States: National Center for Health Statistics/Centers for Disease Control National Hospital Discharge Survey. Manhattan: Statewide Planning and Research Cooperative System. London and United Kingdom: Department of Health and Social Security, London Regional Office. Paris and France: Programme de Me´dicalisation des Syste`mes d'Information, Ministry of Health, Direction de la Recherche, des Etudes, de l'Evaluation et des Statistiques. One of our goals for the World Cities Project is to consider this question by examining the relationships among neighborhoods, health care use, and the health of the neighborhood populations. Although there is a clear connection between deprived neighborhoods and poor health, much less is known about the causal factors linking neighborhood characteristics and health. Recent studies suggest possible pathways through which neighborhood characteristics affect the health of residents.46 Others examine avoidable hospitalization rates as they relate to socioeconomic status and access to primary care.47,48 Still others note that gaps in insurance coverage for those under 65 years old in the United States have led to deferred care, resulting in disparities in health status and use of health services later in life. 49-51 All these studies highlight the need for further research on the impact of neighborhood poverty and access to primary health care on health status. Although there are individual studies of inequalities within specific cities, as far as we know, these questions have not been investigated across neighborhoods of world cities. A FRAMEWORK FOR COMPARING WORLD CITIESThe first task in any comparative inquiry is to define the relevant units of analysis. Comparison of world cities calls for a definition of spatial units of analysis because the literature on cities has produced no widely accepted agreement on their boundaries.52 Another promising approach is to structure comparative analyses around similarities as well as differences among these units. The Urban Core as a Unit of AnalysisIn contrast to studies of health system performance at the national level, comparison of world cities provides comparable spatial boundaries within which to assemble local data on the characteristics of populations, the density of medical resources, the extent of health insurance coverage, and other neighborhood and health system characteristics. For this reason, we defined an urban core (see Fig. 1) for New York City, London, the Paris region, and Tokyo. Our definition of the urban core was guided by five criteria: (1) historic centers of urban development, (2) large populations, (3) high population density, (4) mix of high- and low-income populations, and (5) functions as central hubs for employment and medical resources. First, with respect to urban development, Manhattan, Inner London, and Paris represent the historic centers from which these metropolitan regions grew (Fig. 1). In Tokyo, the same can be said of its 11 inner wards within the surrounding Yamanote subway line. Second, in terms of population size, Manhattan, Inner London, and Paris range from 1.5 to 2.7 million. Third, in terms of density, Manhattan and Paris are similar: 66,000 versus 53,000 inhabitants per square mile. Both Manhattan and Paris have almost twice the population density of Inner London. Likewise, however one might define an urban core in Tokyo, the density is much closer to that of London than to that of Manhattan or Paris. Fourth, the urban cores of these cities combine a mix of high- and low-income populations. In Manhattan, average household incomes range from $92,876 on the Upper East Side to $23,730 in Central Harlem; in Paris, they range from F388,883 in the 8th arrondissement to F131,765 in the 20th arrondissement; and in Inner Tokyo, they range from ¥3,791 in Chiyoda to ¥1,782 in Arakawa.53 For Great Britain, household income data are not available, but there are wide variations in measures of social deprivation. For example, among the boroughs of Inner London, the percentage of persons who are income deprived ranges from 16.8% in Kensington to 51.3% in Tower Hamlets.54 Finally, a number of criteria related to their functions as central hubswhat geographers call central place theorysuggest two striking parallels among Manhattan, Inner London, Paris, and Inner Tokyo: concentrated employment centers and medical resources.55,56 Concentrated Employment Centers These cities function as employment centers that attract large numbers of commuters. Approximately one third of the first ring's employed labor force commutes to Manhattan, Inner London, Paris, and Inner Tokyo. Medical Resources The urban core as a unit of analysis provides a frame within which to focus cross-national comparisons on a more coherent and discernible set of health system characteristics. For example, with respect to the concentration of medical resources, Manhattan, Paris, and Inner Tokyo are characterized by a high density of physicians (Table 1). Inner London is the outlier. But, all four urban cores have a much higher density of physicians than their first rings. The core/firstring ratio of physician density is higher for Inner Tokyo (3.82) and London (3.58) than for Manhattan (2.10) or Paris (2.13). These cities also have high levels of acute care hospital beds (public and private combined), with the exception of London. Manhattan, Inner London, and Inner Tokyo have 2.5 times as many beds as their first rings; Paris has only 1.5 times as many. These ratios indicate the concentration of acute hospital beds, including those among large university teaching hospitals, in all of the central cores (Fig. 2). Figure 2: Ratio of acute-care beds in urban core to first ring: Manhattan, Paris, Inner Tokyo, and Inner London (1995)
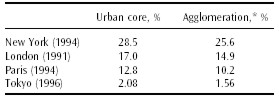
Sources: Manhattan: Health Care Annual, 2000 update. United Hospital Fund. London: London Health Observatory, 2000. Paris: INSEE, 2000. Tokyo: Bureau of Public Health, Tokyo Metropolitan Government, 2000. In summary, Paristhe city with 2.1 million inhabitants living within its 19th century walls and the peripheral freeway that surrounds its 20 arrondissementswas the prototypical urban core against which we selected a comparable urban core for New York, London, and Tokyo. The Paris population and area (105 km2 ) is miniscule in comparison to Greater London's 7.2 million people and 1,590 km2 , New York City's 8 million people and 826 km2 , and Central Tokyo's 7.9 million people and 616 km 2 . Paris is comparable to the urban core of these cities (Fig. 1). For New York City, this is Manhattan; for London, it is the 14 boroughs known as Inner London; for Tokyo, since there is no conventional definition of an urban core, we relied on the five criteria noted above and arrived at an urban core comprised of 11 inner wards ( kus ) that cover an area of 67 square miles and have a population of 2 million (1995). Beyond choosing appropriate units of analysis, it is useful to structure a comparative inquiry around similarities and differences among the units being compared. Similarities and Differences as a Starting Point for Comparative AnalysisAmong our four world cities, there are striking similarities in the relationships between their urban cores and first rings (Fig. 1). We consider two rather different examples: poverty and spatial patterns among older persons living alone. Poverty Poverty rates for the population of the urban core are slightly higher than in their first rings. In New York and the Paris agglomeration, the poverty rate may be defined as the percentage of households with income below one half of the median.57 Although it is impossible to obtain household income data for the United Kingdom and Japan, in London we rely on occupational/class categories defined by the census, and in Tokyo, we use a proxy indicator of deprivation: the percentage of households receiving public assistance (Table 4). Table 4: Measures of poverty: New York, London, Paris, and Tokyo (1991-1996)
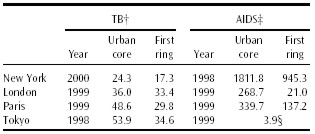
Sources: New York City: Current Population Survey 1994. London: Office of National Statistics, 1991. Paris: INSEE study on income of Parisian households carried out by Christine Chambaz. Tokyo: Tokyo Statistical Association, 1998, Tokyo Statistical Yearbook , 1996. One of the consequences of higher poverty rates in the urban cores is a higher incidence of disease. Consider, for example, the incidence of tuberculosis and AIDS in the urban cores and first rings of our world cities (Table 5).58 Along with higher rates of poverty, the populations residing in the urban cores of world cities are also characterized by higher rates of upper-income and better-educated residents than their counterparts in the first rings. This mix of populations within the urban core provides an excellent opportunity for comparing the effect of inequalities on the use of health care and health status for the populations in world cities. Table 5: Tuberculosis and AIDS: New York, London, Paris, and Tokyo (1996-2000)*
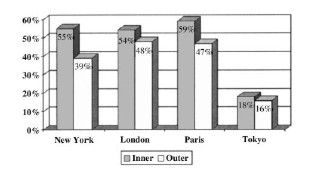
Sources for tuberculosis: New York: New York City Department of Health, 2001, Tuberculosis Control Program, Information Summary: 2000. London: UK Department of Health, 1999, Centre for Public Health Monitoring, Compendium of Clinical and Health Indicators. Paris: Observatoire Re´gional de la Sante´ d'Ile-de-France, 1999, La Tuberculose en Ile-de-France. Tokyo: Tokyo Metropolitan Government, Bureau of Public Health, 2000, Tuberculosis in Tokyo, 1998. Spatial Patterns Among Older Persons Living Alone Inner Tokyo has the lowest rate of persons 85 years and older living alone compared to Manhattan, London, and Paris. Yet, there is a similar pattern across the urban cores of all four cities: The percentage of older persons living alone is higher in their urban cores than in their first rings (Fig. 3). Figure 3: Proportion of persons over 85 years living alone in core and first ring of four world cities (1990-1998)
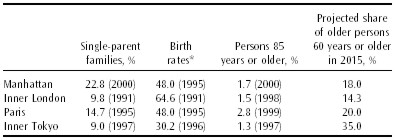
Sources: New York City: Public Use Microdata Set (PUMS) 1990. Data from: Paris: INSEE 1990. London: Population census 1991. Tokyo: Statistical Association, 1998. Percentages were calculated by dividing the number of community-dwelling people living alone by the number of persons in that age cohort. These patterns raise a host of questions about aging and long-term care in the urban cores of world cities. How are they adapting to a world in which baby boomers are aging? How do older city dwellers who age in place make use of health and social services, and how does their life in the urban core compare with that of their counterparts in the first rings of world cities? Despite their common characteristics, there are also significant differences among world cities. Consider, for example, two indicators of family structure, the percentage of older old (85 years and over) and population projections for older persons (Table 6). Table 6: Family structure and aging: Manhattan, Inner London, Paris, and Inner Tokyo (1991-2000)
Sources for single-parent families: Manhattan: US census. London: Office of National Statistics. Paris: INSEE, 1995. Tokyo: Tokyo Statistical Association. Tokyo has the lowest birth rate, the lowest percentage of single-parent families, and the highest projected increase in the population 60 years and over. London has the highest birth rate and lowest projected increase of older persons. Paris has the highest share of older old. Manhattan stands apart with the highest percentage of single-parent families. Two other examples highlight some striking differences among our world cities: patterns of income inequality and infant mortality. Income Inequality Manhattan is characterized by the highest level of inequality in the distribution of average household income, among neighborhoods, in three of our four cities. The ratio of average household income in the most well-to-do neighborhoods to that in the poorest ones varies from 2.1 in Inner Tokyo, to 3.0 in Paris, to 5.0 in Manhattan.59 One of the characteristics of world cities is the polarization between the rich and the poor. Opinions differ, however, on the extent to which there are important variations among cities.60,61 Paris has been called a soft world city in contrast to New York because it provides more family services, income support, and health services to the poor.62 Tokyo is closer to Paris, based on the above data, and although there is no available household income data for London, studies of London's socioeconomic disparities suggest that it resembles New York more closely than Paris or Tokyo in this regard.63 Infant Mortality Infant mortality is a well-accepted indicator of social conditions. Manhattan stands out in relation to other world cities because its average infant mortality rate over the 19931997 period (7.5) was higher than in Inner London (6.8), Paris (5.1), and Inner Tokyo (4.5).64 This probably reflects higher levels of concentrated poverty in Manhattan compared to the other world cities. Differences among world cities (e.g., patterns of income inequalities and family structure) may reflect national patterns and policies with regard to income maintenance and immigration. In this sense, these world cities are important sites for studying the impact of national patterns. Other differencespatterns of infant mortality and the percentage of the older oldreflect distinctive urban characteristics and the impact of world cities. CURRENT STUDIES IN PROGRESSIn response to our key questions about the organization of public health infrastructure in world cities and how their concentrated medical resources, diverse neighborhoods, and health system characteristics affect the use of health services and health status, we are pursuing five related studies concerning (1) public health infrastructure, (2) aging and long-term care, (3) coronary heart disease, (4) avoidable hospital conditions (AHCs), and (5) patterns of infant mortality. Public Health InfrastructureNew York, London, Paris, and Tokyo are the gateways through which the principal health risks from the rest of the world are most likely to enter their countries. Following September 11, there is a new awareness of the importance of public health infrastructure, particularly disease surveillance systems, for protecting the public's health. This study synthesizes the literature on the evolution and current organization of public health infrastructure in each world city; compiles indicators across the four cities, based on comparable data, on health status; and draws inferences from interviews with local health officials and experts on their perceptions of public health risks and local capabilities for epidemiologic surveillance systems, control mechanisms, and emergency response to health crises. Aging and Long-term CareAs population aging and urbanization increase, we will have to accommodate a growing population of vulnerable older people living in cities. It will also be important to understand how urban long-term care systems are dealing with an aging population whose health is increasingly affected by urban poverty. This study synthesizes the state of knowledge of older persons in each city, as well as of the organization, financing, and use of long-term care services for them. We develop case studies that address population characteristics of older persons over 65 years and over 85 years, their health status, housing arrangements and institutional care, and health and social services. Coronary Heart DiseaseMost cross-national studies of coronary artery disease limit their analysis to comparisons of mortality and fail to examine more specific diagnoses, such as acute myocardial infarction. Our study examines mortality, morbidity, and treatment patterns for acute myocardial infarction and other forms of CHD in New York, London, and Paris. In addition to addressing these shortcomings, we explore the relationship between health system and neighborhood characteristics and the incidence of CHD in New York, London, and Paris. By comparing the treatment of CHD for individuals just before and after the age of universal Medicare coverage with treatment for individuals in London and Paris, where access to medical care is not conditioned on age, we are also able to examine the importance of health insurance coverage for access to treatment.65 Avoidable Hospital ConditionsPrevious research suggests that the uninsured are more likely to be admitted to hospitals for conditions that could have been treated and managed in outpatient settings earlier in the illness episode, for example, dehydration among older persons. 66,67 While a number of studies have examined the relationship between these AHCs and insurance status in the United States, most existing studies fail to disentangle the relative importance of access to primary care and poverty. This study compares rates of AHCs by race and by neighborhood in New York City just before and after the age of universal Medicare coverage (65 years) in the United States. As in our study of CHD, we then compare these rates to those of equivalent age cohorts in London and Paris (5564 and 6575 years), where access to medical care is not conditioned on age. Patterns of Infant MortalityFinally, our study of infant mortality in four world cities is designed to explore the relationship between neighborhood characteristics and health. We have shown that, in comparison to other world cities, Manhattan has more neighborhoods with concentrated poverty and the highest infant mortality rates; and these neighborhoods drive up the median neighborhood rate. 57 Although Manhattan succeeded in lowering its citywide infant mortality rate more than the other cities over the decade between 1988 and 1997, its citywide rate remained higher than that of Inner London, Paris, and Inner Tokyo at the end of the period. Also, Manhattan stands out, by far, as the city with the greatest spread and asymmetry in the distribution of neighborhood infant mortality rates for the full decade. CONCLUDING OBSERVATIONSThe World Cities Project offers a new approach to the comparative analysis of public health infrastructure, health systems, and health status. It can contribute to our understanding of urban health systems and health, particularly for older persons and children who live in New York, London, Paris, and Tokyo. Each of the studies in progress, noted above, concerns at least three of our four world cities. We expect that this research will shed light on issues related to inequalities in health care use and health, the importance of health system and neighborhood characteristics in protecting population health, and the quality of life and health status in diverse urban communities; we welcome contributions and reactions from colleagues in world cities and elsewhere. ACKNOWLEDGEMENTWe are grateful to Robert N. Butler for his early enthusiasm and collaboration on WCP. We acknowledge financial support from the Japan Foundation, the Center for Global Partnership, and a health policy investigator award from the Robert Wood Johnson Foundation to Professor Rodwin for his project on Megacities and Health. We also acknowledge the support of the sister organizations of the International Longevity CenterUSA (ILC-USA) in Paris (ILC-France), London (ILC-UK), and Tokyo (ILC-Japan); from the French Ministry of Health's Office of Research (Direction de la Recherche, des Etudes, de l'Evaluation et des Statistiques, DRESS); the London Regional Office of the NHS; and the Direction de l'Action Sociale de l'Enfance et de la Sante´ of the city of Paris, and the Observatoire Re´gional de la Sante´ for Ile de France. We are grateful to the following individuals for assistance with obtaining and interpreting data: Irena Dushi, Marilyn DeLuca, Ruth Ferry, Susan Ghanbarpour, Keiko Honda, Naoki Ikegami, Bobby Jacobson, Loic Josseran, Kabir Karim, Emiko Kobayashi Mikami, Yukiko Kudo, Pascal LaSalle, Erik LePage, Roland Moreau, AtoZ Okamoto, Robert Poinsard, Diane Salma-Lequet (DRESS), Philippe Pe´pin, Jeremie Sautter, Marie-Sophie Schwalm, Marc Simon (Institut National de la Statistique et des Etudes Economiques, Ile de France), Wendy Sykes, Emmanuel Tobier, Anthony Warnes, and Yoshiko Yamada. Finally, we thank Birgit Bogler, Margaret Hodgson, and Daniel Weisz for their research assistance, Charlotte Muller for reading early drafts, and Gabriel Montero for close collaboration on the final manuscript. NOTES* Dr. Rodwin is Director and Dr. Gusmano is Associate Director, World Cities Project, International Longevity CenterUSA; Dr. Rodwin is Professor of Health Policy and Management, Robert F. Wagner School of Public Service, New York University. Correspondence: Victor G. Rodwin, Robert F. Wagner School of Public Service, New York University, 4 Washington Square North, New York, NY 10003, victor.rodwin@nyu.edu 1. Scott A. Global City-Regions: Trends, Theory and Policy . New York: Oxford University Press; 2001. 2. Sassen S. Global financial centers. Foreign Aff . 1999;78:7587. 3. Whiteis D. Third world medicine in first world cities: capital accumulation, uneven development and public health. Soc Sci Med . 1998;47:795808. 4. By public health infrastructure , we mean the capacity of local officials to perform the core functions of public health: (1) assessment , The regular, systematic collection, assembly, analysis, and dissemination of information on the health of the community; (2) policy development , The development of . . . health policies [on the basis of] scientific knowledge; (3) assurance , The assurance to constituents that . . . necessary [services] . . . are provided (p. 610). The capacity of local officials to perform these functions will depend, in part, on the size and quality of their workforce, their information systems for epidemiologic surveillance, and the organizational links they can forge to implement regulations and deliver public health services. Roper WL, Baker EL Jr, Dyal WW, Nicola RM. Strengthening the public health system. Public Health Rep. 1992;107:609615. 5. Fielding J, Garrett L. Betrayal of Trust: the Collapse of Global Public Health . New York: Hyperion; 2000. 6. Fielding J, Halton N. Where is the health in health systems reform? JAMA . 1994;272: 12921297. 7. Sandman D, Schoen C, Des Roches C, Makonnen M. The Commonwealth Fund Survey of Health Care in New York City . New York: The Commonwealth Fund; 1997. 8. O'Meara M. Reinventing Cities for People and the Planet. Washington, DC: Worldwatch Institute; June 1999. 9. Here, cities refers to urban agglomerations, defined by the United Nations as the population contained within the contours of a contiguous territory inhabited at urban density levels without regard to administrative boundaries. It usually incorporates the population in a city or town plus that in the suburban areas lying outside of but being adjacent to the city boundaries (p. 5). United Nations Population Division. World Urbanization Prospects: the 1999 Revision . 2001. Available at: www.un.org/esa/population/publications/wup1999/urbanization.pdf. 10. United Nations Population Division. World Urbanization Prospects: the 1999 Revision . 2001. Available at: www.un.org/esa/population/publications/wup1999/urbanization.pdf. 11. Bugliarello G. Megacities and the developing world. The Bridge . 1999;29:1926. 12. Sassen S. The Global City: New York, London, Tokyo . 2nd ed. Princeton, NJ: Princeton University Press; 2001. 13. Kaplan F. Could this be the New World? New York Times . December 27, 1999:A23. 14. Butler RN, Jasmin C, eds. Longevity and Quality of Life: Opportunities and Challenges . New York: International Longevity CenterUSA; 2000. 15. Butler RN, Grossman LK, Oberlink M, eds. Life in an Older America . New York: The Century Foundation Press; 1999. 16. Hall P. The World Cities . London: Weidenfeld and Nicholson; 1966. 17. Sassen S. Cities in the World Economy . Thousand Oaks, CA: Pine Forge Press; 1994. 18. Department of Environment and Government Office for London, United Kingdom. Four World Cities . London: Llewelvn-Davies; June 1996. 19. Short J, Kim M, Wells H. The dirty little secret of world cities research: data problems in comparative analysis. Int J Urban Reg Res . 1996;20:697717. 20. Harpman T, Tanner M. Urban Health in Developing Countries . London: Earthscan Publications; 1995. 21. Rodwin V. Comparative analysis of health systems: an international perspective. In: Kovner A, Jonas S, eds. Health Care Delivery . New York: Springer; 2001:107144. 22. The OECD health data come from a CD-ROM available from the Paris or Washington office of the OECD. The most recent version (1998) uses a broad definition of health and includes a wide range of social and economic indicators. 23. World Health Organization. World Health Report 2000 . Geneva, Switzerland: World Health Organization; 2000. 24. Andrulis D, Goodman N. The Social and Health Landscape of Urban and Suburban America . Chicago, IL: AHA Press; 1999. 25. Wilensky H. Rich Democracies: Political Economy, Public Policy, and Performance . Berkeley, CA: University of California Press; 2002. 26. Abel-Smith B. Who is the odd man out? The experience of Western Europe in containing the cost of health care. Milbank Q . Winter 1985:117. 27. Marmor T, Bridges A, Hoffman W. Comparative politics and health policies: notes on benefits, costs, limits. In: Ashford D, ed. Comparing Public Policies . Beverly Hills, CA: Sage; 1978:5080. 28. Morone J. American political culture and the search for lessons from abroad. J Health Polit Policy Law . Spring 1991:129154 29. Brown L. Exceptionalism as the rule? US health policy innovation and cross-national learning. Int J Urban Reg Res . 1998;23:3651. 30. Rodwin V. American exceptionalism in the health sector: the advantages of backwardness in learning from abroad. Med Care Rev . 1987;44:119153. 31. White J. Competing Solutions: American Health Proposal and International Experience . Washington, DC: Brookings Institute; 1995. 32. World Health Organization. The World Health Report 2000. Health Systems: Improving Performance . Geneva, Switzerland: World Health Organization. Available at: www.who.int/whr/2000/en/report.htm. 33. The World Bank. Investing in Health , World Development Report. Washington, DC: The World Bank; 1993. 34. Anderson G, Hussey P. Comparing health system performance in OECD countries. Health Aff . 2001;20:219232. 35. Reinhardt U, Hussey P, Anderson G. Cross-national comparisons of health systems using OECD data. Health Aff . 1999:21:169181. 36. Ginsberg P. The RWJF Community Snapshots Study: introduction and overview. Health Aff . 1996;15:715. 37. Coyne J, Hilsenrath P. The World Health Report 2000: can health care systems be compared using a single measure of performance? Am J Public Health . 1992;92:30, 3233. 38. Navarro V. The World Health Report 2000: can health care systems be compared using a single measure of performance? Am J Public Health . 1992;92:31, 3334. 39. The Technological Change in Health Care Research Network. Technological change around the world: evidence from heart attack care. Health Aff . 2001;20:2542. 40. Gusmano MK, Rodwin V, Weisz D. Ischemic heart disease, angioplasty and bypass surgery in Paris and Manhattan: a comparative analysis of two world cities. 2002. Under review. 41. Aaron H, Schwartz W. The Painful Prescription . Washington, DC: Brookings Institute; 1984. 42. The range of these estimates is broad because there are no solid studies on this specific issue: personal communications with Liz Lowe, London Regional Office, NHS. London; Nick Black, London School of Hygiene and Tropical Medicine; Brian Williams, Faculty of Medicine, University of Nottingham. 43. Rodwin V. Urban health: is the city infected? In: Mariner M, ed. Medicine and Humanity . London: King's Fund; 2001:141152. 44. Andrulis DP. The urban health penalty: new dimensions and directions in inner-city health care. In: Inner City Health Care . Philadelphia, PA: American College of Physicians; 1997:149. 45. Benbow N, Wang Y, Whitman S. Big Cities Health Inventory, 1997: the Health of Urban USA . Chicago, IL: Department of Health; 1998. 46. Ellen I, Mijanovich T, Dillman K. Neighborhood effects on health: exploring the links and assessing the evidence. J Urban Aff . 2001;23:391408. 47. Billings J, Zeitel L, Lukomnik J, Carey T, Blank A, Newman L. Impact of socioeconomic status on hospital use in New York City. Health Aff . Spring 1993:162173. 48. Bindman A, Grumbach K, Osmond D, et al. Preventable hospitalizations and access to health care. JAMA . 1995;271:305311. 49. Cooper P, Schone B. More offers, fewer takers for employment-based health insurance: 1987 and 1996. Health Aff . 1997;16:142148. 50. Schoen C, Lyons B, Rowland D, Davis K, Puleo E. Insurance matters for low-income adults: results from a five-state survey. Health Aff . 1997;16:163171. 51. Schoen C, Puleo E. Low-income working families at risk: uninsured and underserved. J Urban Health . 1998;75:3049. 52. For example, definitions of New York City range from the administrative boundaries of the city (8 million population) to the US Census definition of the consolidated metropolitan area (21.2 million), to the tristate region (19.5 million) with 29 counties in New York, New Jersey, and Connecticut. Similar variation applies to other world cities as well. Netzer D, Conoscenti T. In: Effective Real Property Rates for the New York Metropolitan Area . New York: Taub Urban Research Center, New York University; 2002:127. 53. For Manhattan: Housing and Vacancy Survey, 1996; Paris: Ministry of Finance, 1996; Tokyo: Japan Marketing and Education Center, 1998. 54. Department of Transport, Local Government and the Regions. Indices of Deprivation 2000 . Accessed at: www.neighborhood.statistics.gov.uk/catalogue.asp. Date accessed: October 1, 2000. 55. Berry B. Central Place Studies . Philadelphia, PA: Regional Science Research Institute; 1961. 56. King LJ. Central Place Theory . Beverly Hills, CA: Sage; 1984. 57. The poverty level for Manhattan is the percentage of households with income below half of the median household income of Manhattan. For New York City, it is the percentage of households with income below half of the median household income in New York City. The poverty level for Paris is measured as the percentage of households with income below half of the median household income for Paris. For the Parisian agglomeration, it is the percentage of households with income below half of the median household income for the Paris agglomeration. The area of the Paris agglomeration is slightly larger than Paris and its first ring. Data for both cities refer to pretax income; for Manhattan, pretax income includes social security payments and welfare payments, but does not include other transfer payments (e.g., food stamps). 58. New York: New York City Department of Health; cumulative cases from 1990 through 1998 using 1995 population to calculate rate per 100,000. London: Public Health Laboratory Service; cumulative cases from 1990 through 1999 using 1995 population to calculate rate per 100,000. Paris: Observatoire Re´gional de la Sante´ d'Ile-de-France; cumulative cases from 1991 through 1999 using 1995 population to calculate rate per 100,000. Tokyo: AIDS News Letter , 8-1(75), 2000; cumulative cases from 1990 through 1999 using 1995 population to calculate rate per 100,000. 59. These are ratios of average household income by neighborhood: 20 arrondissements in Paris, 11 kus in Inner Tokyo, 14 boroughs in Inner London, and 10 sub-borough areas in Manhattan. In Paris and Tokyo, the data are from the Ministry of Finance for all households that file income taxes. In Manhattan, they are from the Housing and Vacancy Survey for the same geographic units used by the census in its Public Use Microdata Set (PUMS). All figures are for 1990 except for Manhattan (1989). 60. Hamnett C. Social polarization in global cites: theory and evidence. Int J Res Urban Reg Stud . 1994;31:401423. 61. Mollenkopf J, ed. Fragile Giants. New York: Routledge, in press. 62. Body-Gendrot S. Paris: a soft global city? New Community . 1996;22:595605. 63. Logan J, Taylor-Gooby P, Reuter M. Poverty and income inequality. In: Fainstein S, Gordon I, Harloe M, eds. Divided Cities: New York and London in the Contemporary World . Oxford, UK: Blackwell; 1992: Chapter 5. 64. Neuberg L, Rodwin V. Infant Mortality in Four World Cities . New York: International Longevity CenterUSA. Working Paper 2001. 65. We obtained data for this study from the New York State Department of Health, the French Ministry of Health, and the London Regional Office of the British National Health Service. 66. Billings J, Anderson GM, Newman LS. Recent findings on preventable hospitalizations. Health Aff . 1996;15:239249. 67. Weissman JC, Gatsonis C, Epstein AM. Rates of avoidable hospitalization by insurance status in Massachusetts and Maryland. JAMA . 1992;268:23882394. Edited and posted on the web on 2nd November 2004 Note: This Research Bulletin has been published in Journal of Urban Health, 79 (4), (2002), 445-463 |
||