GaWC Research Bulletin 118 |
|
|
|
This Research Bulletin has been published in Australasian Journal of Regional Studies, 8 (3), (2002), 247-260. Please refer to the published version when quoting the paper.
1. THE CONVENTIONAL SENSE OF GLOBALISATION AND URBAN DEVELOPMENTThere is a well established literature outlining why industries and activities with powerful localisation advantages, embedded knowledge and skills have centred in a few locations around the world. Those locations have been labelled global cities. In a broad ranging literature, beginning with Friedmann's initial ideas in 1986 and flowering in a very substantial collaborative research effort (the results of which are displayed on the web site of the Global and World City project: www.lboro.ac.uk/gawc/), the idea of a hierarchy of global cities associated with the location of finance and corporate control have been etched into urban analysis and policy. That etching has been done with some confidence, as even simple information on the attributes of major cities expressed in terms of number of firms or turnover in finance and banking, advertising and corporate services, along with data on airport traffic, and costs of office space all produce very similar rank orders of cities. That simple insight has been reinforced by more complex work on the linkages or relationships between places, and here too the hierarchy of linkages between corporate service companies or as expressed in air traffic are very similar. Faced with the strength of understanding of this analysis, it is reasonable that city officials examine lists of cities and explore their rank with benchmarking exercises, and then move on to identify what could be done to lift their city in the rankings. That thinking has produced a lot of urban policy action focussed upon physical inner city change, major events, image and an effort to attract at least regional headquarters of major corporate service companies to a city. These policies are the activities of what Short and Kim (1999) have called the "global city wannabees". Moving a place or two on the hierarchy of global cities is not easy and given that the rank on the hierarchy seems to be a strong pre-condition for local vitality and potential future growth, one can be excused for being pessimistic about the fortunes of the middle- ranked cities. However a cursory examination of some of the middle ranked global cities (see Appendix 1 derived from Beaverstock et al 1999), identifies a wide range of prosperous and impressive cities like Munich, Stuttgart, Lyon, Barcelona, Lille, Copenhagen, Oslo, Stockholm and Helsinki, along with North American counterparts such as Atlanta, Philadelphia, Toronto, Vancouver and Denver. In Australia, Melbourne, Brisbane and Perth would figure in such a list. These places suggest that successful urban development is possible outside the top layers of the global hierarchy, and that a different understanding of the way global linkages and networks shape local urban change might be needed. A well argued case for a different perspective has been developed by Markusen et al (1999:3). They show that "second tier cities have been growing at the expense of older, larger ones , upsetting urban hierarchies" . They associate this outcome with "a specialised set of trade-oriented industries". They carry out a sophisticated research project that utilises industrial structure and firm linkages to account for the vitality of second tier cities. The current paper has taken the lead of that project in its concern with trade, but looks beyond the industrial base to incorporate producer services. 2. TOWARD A DIFFERENT PERSPECTIVE ON GLOBALISATION AND LOCAL OUTCOMES(A) A Conceptual ContextThe first part of re-thinking the forces shaping urban change has to develop a different way of understanding the forces of globalisation associated with world trade. A long heritage of ideas suggests trade links are shaped by relative comparative advantage; a political economy perspective on that process predicts the emergence of a core and a periphery. Together these ideas suggest a few cities and regions in a few countries will dominate economic activity. Storper (2000) has presented a different set of ideas on trade and globalisation. He discusses four types of trade. One is the "winner take all" activities based on special knowledge and skill which underpins the roles of London and New York. A second is the much publicised trade created by the international division of labour (in practice the shift of production from high-wage to low-wage countries). Here he shows that the new pattern involves not only labour savings but also complex flows of knowledge as "local partners of multinational firms in developing countries speak the language of international product standards ..(and) such knowledge flows and accompanying experience will have important effects on which activities can be deterritorialized" (ie relocated to third world countries) (Storper 2000:50). In these links, the simple trade effect is enriched by learning and the application of knowledge from one industry to many others, which means that some nations or regions are able to move up through the product chain and achieve development objectives in the process. Such a perspective is consistent with the experience of Taipei and Singapore and may be replicated in Guanghzou and Shanghai in the not-too-distant future. The fortunes of these cities are removed from the finance and corporate links of the global city cycle, although they need service sector sophistication to take advantage of the knowledge connections associated with their mainly manufacturing trade linkages. In a part of trade that is closer to the Australian experience, Storper (2000) discusses contestable markets in manufacturing and services, noting that old theory would suggest production should be slowly concentrated in the best locations, but that in fact "most of these sectors have not had significant changes in the degree of unevenness of their spatial dispersion". He also provides evidence that trade in similar products "averages about 30 percent of the trade of the (Europe-North America-Asia) Triad and goes beyond 50 % of trade in certain sectors" (Storper 2000:51). He goes on to observe the appearance in many countries at roughly the same time of techniques of "flexibilised mass or diversified quality production in manufacturing or mass services". This means a range of nations and regions can be involved in the exchange of goods and services within industries drawing upon particular knowledge and skill in production, and local firms can be engaged in globally significant production. In turn that means some cities and regions can be "globalised" via these activities and experience local job and investment growth. In a related approach, O'Connor and Daniels (2001) have developed an explanation for the empirical fact that the trade in services involves exchanges between developed countries. They suggest there is a minimum level of professional service development, along with minimum expectations of institutional structures and regulations, before service companies can negotiate the sale of services into foreign markets. Those minima are met in a large number of cities within developed nations, so that firms in a large number of cities can confidently plan international alliances and sales activity. As trade in services continues to rise, more firms in more cities may be able to participate in that activity. These elements indicate that global trade impacts on urban change in a much wider range of activities than the established global city research suggests. In turn it is possible that the second ranked cities benefit from global activity to a greater degree than previously expected. (B) An Empirical ContextOne measure of the impact of trade on cities has been developed by Foster (2002:9-10). She explored whether the location of a W, using a sample of US cities, explored the strength of global coorld Trade Center (used as a local institutional representation of the importance of trade) was reflected in the strength of global connections of 90 US and Canadian cities. associated with the location of World Trade Centers in metropolitan areas. Although World Trade Centers are a diverse activity and vary from place to place she did find that "the 48 metropolitan regions with a World Trade Center are larger and more globally engaged..". They had ".- more exports per capita, more sister cities.. more overseas visitors and more likely to be listed as an intended residence for immigrants (and hadve more air passengers per capita) than. are the 42 metropolitan areas without a World Trade Center". Though the presence of a World Trade Center is a very crude measure of global linkages Foster's results are important first, as they show global an associations are found in that reaches out toacross at least 48 US and Canadian cities, not just into the few that are normally labeled "global" in the US., and second, as they underscore the role of effect that role of ttrade inhas on the creation of local-in the broad sense of Storper (2000) as a conduit of global connectionslinks. Hence one plank of the project will be laid by understanding Australian trade in more detail, and by identifying firms that are involved in the export of both goods and services. These we will label globally focused firms. Those firms will provide a set of individuals and local institutions (like national trade associations) which will be the raw material for the second plank of the project. On another tack, a variety of empirical work has begun to show that the impact of globalisation is felt in a wide range of urban areas. Some of this utilises a new spatial scale. Rather than analyse global cities, (and by implication concern oneself largely with the down-town core and its finance and corporate activities) current analyses are dealing with global city regions (Scott 2001). Although not tightly defined, these areas involve the suburbs and surrounding smaller towns that fall within a commuter belt, or within convenient business-meeting access (Hall 2001). By seeing the urban impact of globalisation in that spatial framework urban analysis immediately recognises a wider array of activities that can be part of a metropolitan area's global economy, an aspect that was significant in the Hodos (2002) study of Philadelphia cited earlier. In effect production activities like advanced manufacturing, research and development and logistics and freight handling, in many metropolitan areas located outside the core of the global city, are now part of its global functions. An analysis of New York by O'Neill and Moss (1991) provides a good illustration of this effect. By looking at both a 17 county and a 31 county definition of the New York global city region, they find 13 headquarters of Fortune 100 corporations, 7 Diversified Service corporations and 38 Corporate research facilities that would not be counted if the urban core definition had been used. That insight is incorporated into their perspective on policy, as they emphasise the role that manufacturing (as expressed through headquarter functions and research and development) will play in the region's future, and suggest policy actions designed to accelerate the location of these activities in the region. Hodos (2002), researching Philadelphia. as a region beyond its central city, found a range of firms with global investments and global production operations, counting 12 headquarters of Fortune 500 firms in 1999. In its chemical and pharmaceutical industry "50 percent of regional employees work for foreign owned companies" (Hodos 2002:368). Hence its regional economy is exposed to the global market place in one of the contestable markets discussed by Storper. In this sense it is a global city, although it generally sits toward the bottom of most lists of US global cities. Gertler (1999) working on Toronto, found its global role was expressed through itshas identified the key global sectors of the Greater Toronto area, a city that is acknowledged as Canada's global city but not in the top echelon of global city lists. He nominates auto industry, information and communications technology, advanced engineering, health and education and cultural industries in addition to the commonly citeds well as the usually studied longside the finance and business services group. Much of this activity was dispersed through Greater Toronto. Extending that perspective it is important to recognise that a wide range of global activity is located outside the usual list of major global cities. The Markusen et al (1999) study provides examples of rapid industrial employment growth in second-ranked cities in the US, Korea, Brazil and Japan. Research on the location of high technology in the US by Florida and Gates (2001) showed that cities such as Boston, Dallas and San Francisco rated ahead of the global cities of New York (which was tenth on their list), Los Angeles and Chicago. In a survey of innovation, although New York ranked at three after San Francisco and Boston, places like Philadelphia, Dallas, Hartford, Buffalo and Cleveland were also in the top ten (Audretsch 2000). That is mirrored in the computer industry where the most influential software firm Microsoft is based in Seattle, and an influential producer, Dell, is in Austin, while San Francisco-San Jose dominates the industry. Townsend (2001) has recently argued that there is now a system of "network cities" shaped by the spatial configuration of the Internet. He suggests Washington DC and San Francisco are "tier one" cities in this new hierarchy. He concludes that "rather than being completely centralized in a small group of global cities, nodes for Internet activity are distributed among a far broader group of information producing regions in the US than predicted by the global city hypothesis" (Townsend 2001:55). Given that the clustering of traffic at these key nodes is associated in part with the location of major users, these network cities will have a new array of employment opportunities not previously seen as part of global city thinking. A recent analysis of innovative cities in Europe involved Milan, Amsterdam and Stuttgart as well as London and Paris (Simmie 2000). These insights point to a strong role for mid-sized cities, an outcome consistent with their gains in employment shown in the UK (Breheny 1999) and in Germany (OECD 1999). Some confirmatory evidence of the significance of the second ranked global cities has emerged in the analysis of the pattern of international air traffic. Using the global hierarchy identified by the Loughborough group (Beaverstock et al 1999) O'Connor (2003) has shown small falls in the shares of passengers at the largest global cities, and growth among the second ranked places. The explanation might lie in the adoption of new smaller and faster aircraft technology along with new demand for travel between the globally focussed businesses in pairs of smaller cities. Finally, Abu Lughood (1999) has stressed that the development, current vitality and problems that face the global cities of the US (New York, Chicago and Los Angeles) can be related to some very significant local factors, and that in these places their global dimension is but a small part of their overall activity. Taken together, these conceptual and empirical perspectives suggest that there is a role for the second ranked city that lies outside the activities and concentrating forces that have been conventionally associated with winner-take-all trade and global city urbanisation. That outcome has some relevance for interpreting the recent experience of Melbourne, and provides a number of signals that could be used to develop policy to enhance the growth and development of the metropolitan economies of second ranked cities. 3. THE MELBOURNE ECONOMY AND GLOBAL SYDNEYA strong theme in urban analysis in Australia has been the impact of Sydney as a global city not only on its own growth, but on its dominance within Australia, and particularly its accelerated leadership over Melbourne. This has been explored in research on corporate headquarters (Newton 1995), producer services (O'Connor and Edgington 1991 ) and symbolic analysts (O'Connor, Stimson and Daly 2001) and discussed at a local scale in a collection of papers edited by Connell (2000). All approaches showed that global market-serving finance, advertising, media and publishing as well as advanced business services in Sydney had expanded while activity in those areas had declined in Melbourne. That trend seemed to accelerate in the latter part of the 1980s and into the early 1990s with widely publicised financial institution failures in Melbourne. The outcome can be seen in the data displayed in tables 1 and 2 which displays the geography of activity in the middle to late 1999s. In table 1, the concentration of the more sophisticated service sector employment is apparent in Sydney. Although it has 25% of all jobs in Australia, it accounts for 36% of the jobs in media and publishing, for example. The data in table 2 shows the dominant position of Sydney in an array of measures of commercial and social development. In summary this information illustrates the dominance of global city Sydney over the other metropolitan areas of a nation. Table 1: Shares of National Employment in Selected Service Sector Activities in Australian Metropolitan Areas 1998
Source: The Australian Capital City Report (1999) Table 2: Commercial, Residential and Social Indicators of Australian Metropolitan Areas.
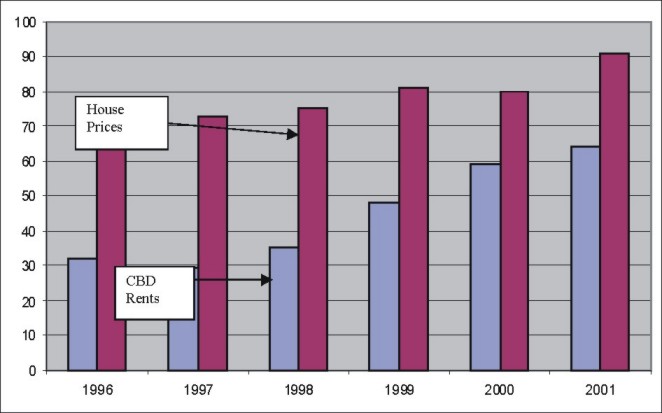
Sources: (1) The Property Council (1997) The Office Space Report. July Page 1; However it is important to acknowledge that the economic performance of the Melbourne economy from the late 1990s up to 2001 does not reflect the global city dominance implied in tables 1 and 2. As displayed in a wide array of data (O'Connor 2002) the Melbourne economy has led the nation in home construction and attracted commercial investment over a wide range of industries in the 1998-2000 period. Samples of this outcome can be seen in the Melbourne's shares of national construction investment as shown in table 3. Table 3: Percentage Share of National Commercial Construction in Melbourne by type of Building , 1995-2000
* largely involving Transport and Telecommunications Source: O'Connor 2002 There are two important insights in this table. The first is that since 1997 or 1998 Melbourne's level of investment in commercial building has usually been well in excess of its share of national population of 17 percent. That is particularly so for factories and the other business premises category. Perhaps consistent with its lower share of the employment in advanced business services as shown in table 1, Melbourne does account for a smaller share of office construction. Over the same period it has also accounted for generally smaller shares of building in the population-serving areas like shops, health and education, although in some years these sectors do attract a surge in investment. As will be explored below, it is possible the high level of investment in education for example could be associated with the high number of foreign students enrolled in institutions within the metropolitan area. The investment associated with the data displayed in table 3 has been felt in a change in the economic performance of Melbourne relative to Sydney since the later years of the 1990s.. That is well illustrated in the information displayed in figure 1 which shows the relative level of CBD office rent and house prices in Melbourne compared to Sydney in the later part of the 1990s and early 2001. It is clear that major changes have been felt in the Melbourne housing market, which have driven up the average price to be about 90 percent of that in Sydney in 2001; it had been 70 percent five years earlier. Rents in the CBD office space market have also recovered, moving in the past few years from a level 30 percent of that in Sydney to around 60 percent in 2001. Figure 1: Melbourne CBD Office Rents and House Prices as a ratio of Sydney Prices
The high level of economic performance reflected in the data displayed above could be associated with a stronger role in a rapidly growing national economy. O'Connor, Stimson and Daly (2001) argue that the Australian economy has begun to operate as a single economic unit in the past decade, and in a number of areas Melbourne has been well placed to serve that market. That is especially so in manufacturing and in the wholesale and distribution functions in Melbourne's key role in the nation's transport system. In addition, some special local circumstances, such as a rapid privatisation of a range of Government functions which stimulated business services along with private investment in new transport infrastructure and a new casino provide some additional explanation of the changes displayed in figure 1. It is also possible that opportunities created by the global economy in the range of manufacturing and service activities outlined by Storper, as discussed above, could be a critical element. In effect, it is possible that the global exposure of businesses in the Melbourne economy is greater than commonly understood which has stimulated a wider array of economic opportunity. That aspect is explored in the following section. 4. THE GLOBAL EXPOSURE OF THE MELBOURNE ECONOMYFollowing Storper's lead, an attempt has been made to express globalisation in a different way. To do this involved identifying the extent of the global exposure of the Melbourne economy relative to the rest of Australia in some components of globalisation like foreign direct investment and trade. The objective is to determine whether there has been a bias in favour of Melbourne in these activities that could account for the growth and development outlined in the previous section. Results of this preliminary investigation rely upon a variety of measures, and a variety of time periods and spatial units. Subsequent research in this area will develop an array of more consistent information. Foreign InvestmentOn Foreign Investment, it is possible to establish the destination of recent capital expenditure. Table 4 shows two measures of the global exposure of the states of Australia, showing shares of foreign direct investment in private new capital expenditure in 1998-1999. Table 4: The Global Exposure of Private New Capital Expenditure. Australian States 1998-1999
Source: ABS. Australian Economic Indicators. Publication 1350. July 2001. Page 3. table 1: ABS. Australian National Accounts: State Accounts Publication 5220. Table 4. The data indicate that Victoria has been the most globally exposed state in this particular data, as 31 percent of its investment was drawn from overseas, compared to 26 per cent for the nation, and it accounted for 31 per cent of the nation's foreign investment, a much greater share than its 26 per cent share of national population. That is a significant piece of information as it corresponds to the period when the large shares of construction investment were recorded, particularly in factories as shown in table 3. Regretfully it is not possible to obtain this type of information for any earlier years and so pursue with greater rigour the link between it and investment in construction. TradeA number of measures have been assembled here. These include the shares in the value of national imports and exports registered in Victoria, along with two measures of the traffic through the Melbourne airport and seaport for the period 1995-2000. These are displayed in table 5. The data shows Melbourne does not have a prominent role in Australia's exports, which still include resources and agricultural products shipped out of Western Australia and Queensland. On the import side however, the State is a national leader. The two measures of activity at the airport and seaport show Melbourne's strong role as the container gateway of the nation, along with a steadily growing role in air freight. Taken together these measures suggest Melbourne (as the major urban centre in Victoria) has experienced a steady share of imports and container traffic and a growing share of air freight. In their own ways these indicators suggest sustained or expanding exposure to the global economy. Table 5: Percentage Shares of Selected International Trade Activities in Victoria or Melbourne 1995-2000
Source: O'Connor (2002) Two other measures of the global exposure of Melbourne deserve closer attention. These are tourism and education, areas that figure as important service exports (O'Connor and Daniels 2001). Global demand for this part of Australian production has grown rapidly. Data displayed in table 6 illustrates that Melbourne is nationally important in the provision of education to international students. As the national enrolment of international students has grown, (by 50 percent of its level just four years ago) Melbourne has been able to record a small expansion in its already large share. With nearly one third of the nation's overseas student enrolment, Melbourne educational institutions are by far the leading providers of this kind of education in the country. This is a dimension of globalisation that has not been analysed in detail, but provides important direct benefits to the Melbourne economy through the fees paid and the property rented by students. Table 6: Melbourne's Role in Overseas Tertiary Education 1996-2000
Sources: DEETYA: Selected Higher Education Student Statistics Table 7: Expenditure by International Tourists in Australian Cities 1999
Source: Tulpule, A (1999) Tourism Expenditure by International Visitors in Regional Australia. Occasional Paper 29. Bureau of Tourism Research In international tourism Melbourne also has a stronger role than its population size alone would suggest, recording the longest average stay and the second highest expenditure per visit among Australian cities in 1997, although Sydney's position as the gateway city for global tourism is underscored by its dominant share of tourist expenditure. Hence this aspect of global activity could be having a major impact on Melbourne. To some extent that has been expressed in an increased share of national hotel construction (O'Connor 2002). The very preliminary information assembled in this section of the paper illustrates that the Melbourne metropolitan area is exposed to the global economy in a range of areas that fall outside the commonly researched "global city' functions associated with finance, banking and corporate activity. It is possible that this exposure is associated with some major changes in the vitality of the metropolitan area in recent years. 5. CONCLUSIONSThis paper has argued that a broader perspective on globalisation needs to be incorporated into the analysis of modern urban development. That means re-thinking the long established global city perspective, which has provided much detailed insight on the geography of urban development and the fortunes of individual cities. Rethinking the approach will need to acknowledge some of the more complex elements of world trade by looking beyond the finance and banking and corporate management sectors. The analysis carried out in this stage of the research has been limited to aggregate measures of trade. To produce more refined understanding it will be necessary to be more precise about the actual sectors and firms that are involved in global exports or imports, carrying out more detailed analysis of their networks within the metropolitan area. That approach could extend to include the number and type of international migrants attracted to Melbourne. In addition, details on the diversity of links from the airport could be used as an indicator of change in the global connections of Melbourne. Finally, better ways of exploring how these links are felt in local economic activity need to be developed. At the urban scale, the study of global impacts will need to be broadened beyond the CBD and its fringe, utilising the concept of global city regions. This approach will create scope to incorporate the impact of globally-focussed manufacturing, research and development and some service activities that locate within the wider city region. These new perspectives will show how urban economic performance depends in part on the way that a particular location responds to the broader challenges associated with globalisation. That will lead to concerns with transport, educational and tourism infrastructure, the quality of the labour force and the innovative and engineering capacity of manufacturing and service (ie consulting) firms. It will also be shaped by national trade and industrial policy as much as by regional and local actions. That is a much broader perspective than that associated with hierarchical lists of cities commonly used in global city policy and planning. REFERENCESAbu Lughod, J (1999) New York, Chicago, Los Angeles. America's Global Cities. Minneapolis. University of Minnesota Press. Audretsch, D (2000) Knowledge, Globalisation and regions: an Economist's perspective, in Dunning, J (ed) Regions, Globalisation and The Knowledge-based Economy. Oxford. Oxford UP. page 63-81 Beaverstock, J.G., Taylor,P., and Smith, R.G. (1999) A Roster of World Cities, Cities, 16, 445-458. Breheny, M. (1999) Introduction. in Breheny, M. (ed) The People: Where Will They Work?. Report of TCPA research into the Changing Geography of Employment. Town and Country Planning Association, London, pp. 1-8. Connell, J (2000) (ed) Sydney. The Emergence of a Global City. Melbourne OUP. Florida, R and Gates, G (2001) Technology and Tolerance: The Importance of Diversity to High Technology Growth. The Brookings Institution Center on Urban and Metropolitan policy. Survey Series. Washington. The Brookings Institution. Hall, P (2001) Global City Regions in the Twenty First Century, in Scott, A (ed) Global City Regions. Trends, Theory and Policy. Oxford, OUP. Page59-77 Hodos, J (2002) Globalisation, Regionalism and Urban Restructuring: The Case of Philadelphia, Urban Affairs Review 37, 358-379 Markusen, A., Lee, Y-S., and DiGiovanna, S. (1999) (eds) Second Tier Cities. Rapid Growth beyond the Metropolis. Minneapolis. University of Minnesota Press. Newton, P (1995) Changing Places? Households, Firms and Urban Hierarchies in the Information Age, in Brotchie, J., Batty, M., Blakely, E., Hall, P., and Newton, P (eds) Cities in Competition. Productive and Sustainable Cities for the 21st Century. Melbourne Longman Australia. Page 161-190 O'Connor K (2002) Monitoring the Greater Melbourne Region . Department of Infrastructure. State of Victoria. O'Connor, K. (2003) Global Air Travel Toward concentration or Dispersal, Transport Geography. 11, 83-92. O'Connor, K. and Daniels, P (2001) The Geography of International Trade in Services: Australia and the APEC region, Environment and Planning A 33, 281-296. O'Connor, K., Stimson, R., and Daly. M (2001) Australia's New Economic Geography: A Society Dividing. Melbourne. Oxford UP O'Connor, K. and Edgington, D (1991) Producer Services and Metropolitan Development in Australia, in Daniels, P. (ed.) Services and Metropolitan Development: International Perspectives. London. Routledge. Pages 204-225 O'Neill, H., and Moss, M.L. (1991) Reinventing New York. Competing in the Next Century's Global Economy. Urban Research Center, Robert Wagner Graduate School of Public Service. New York University. OECD (1999) Urban Policy in Germany: Towards Sustainable Urban Development. Organisation for Economic Co-operation and Development, Paris. Scott, A (2001) (ed) Global City Regions: Trends, Theory, Policy. Oxford. Oxford U.P. Short, J.R. and Kim Y.H (1999) Globalisation and the City. Harlow, Essex. Longmans. Simmie, J. (2001) (ed) Innovative Cities. London. Spon Press. Storper, M. (2000) Globalisation and Knowledge Flows: An Industrial Geographers perspective, in Dunning, J (ed) Regions, Globalisation and The knowledge based Economy London. Oxford. Oxford U.P. Page 42-62 Stimson, R., Daly, M., Jenkins, O., Roberts, B., and Ross, S. (1996) Tourism in Australia: An Overview of Trends, Issues and Prospects. Occasional Paper 23. Canberra. Bureau of Tourism Research. Townsend, A (2001) The Internet and the Rise of the New network cities, 1969-1999, Environment and Planning B: Planning and Design, 28, 39-58. NOTE* Kevin O'Connor, Faculty of Architecture, Building and Planning, The University of Melbourne, Kevin.oconnor@unimelb.edu.au. Edited and posted on the web on 4th August 2003
Note: This Research Bulletin has been published in Australasian Journal of Regional Studies, 8 (3), (2002), 247-260 |
|||||||||||||||||||||||||||||||||||||||||||||||||||||||||||||||||||||||||||||||||||||||||||||||||||||||||||||||||||||||||||||||||||||||||||||||||||||||||||||||||||||||||||||||||||||||||||||||||||||||||||||||||||||||||||||||||||||||||||||||||||||||||||||||||||||||||||||||||||||||