GaWC Research Bulletin 103 |
|
|
INTRODUCTIONGlobal city research has so far privileged analysis of "First World" metropolis over studies on cities in "Third World" countries. Only very recently, some so-called mega-cities have been explored in the light of globalization (see, for example, Lo/Yeung 1998; Sassen 2002). However, as I have argued elsewhere (Parnreiter 2002a, 146f), both theoretical and empirical reasons exist to include "Third World" metropolis into global city research. Latin American economies are being integrated ever deeper into the world economy in the last two decades, which is shown, for example, by a strong increase in export production originating and foreign investment flowing to these countries. Thus, production (in the widest sense) carried out in Latin America has to be organized, serviced and controlled. This raises, of course, the question of global city formation and the related question of integration into global networks of cities. Studies undertaken by the GaWC (http://www.lboro.ac.uk/gawc/) reveal that firms in advanced producer services have created firm links to Mexico City, São Paulo, Buenos Aires, Caracas and Santiago. In this paper, I seek to contribute to the ongoing debate by focusing on two Latin American cities: Mexico City and Santiago de Chile. In particular, I will
ECONOMIC, SOCIAL AND SPATIAL CHANGES IN MEXICO CITY AND IN SANTIAGO DE CHILEMexico City1After the so-called debt crisis of 1982, Mexico City witnessed deep changes in its economic, social and spatial organization as well as in its role within the national urban network. Before import substituting industrialization (ISI) came to an end, public and social services constituted one third of Mexico City’s GDP, followed by manufacturing and trade. Regarding employment, more than half of formally employed people worked in manufacturing, followed by trade and services. By 1998, the picture had changed drastically. As regards GDP, manufacturing dropped to 19 % of the urban production, while concerning employment losses were so strong that manufacturing was being outstripped by both services and trade (see tables 1 and 2). As a result, the city ceased to be specialized on manufacturing, developing a high coefficient of local specialization in services, and, in particular, in public and social services. It is striking to which extent advanced producer services expanded their role in the last 20 years. By increasing their participation in the urban GDP by more than 50 % they obviously are the main winning sector of transformation from ISI to an open, world market oriented economy (table 1). In a similar vein, employment in "Real Estate, Financial and Professional Services" grew by 75 % in absolute terms (1987–1997), being again the fastest growing sub-sector of the formal urban labor market (INEGI, ENEU). Table 1: GDP of Mexico City, 1980 - 1998 (percent)
Source: Sobrino 2000, Cuadro 3.2.2. Table 2: Employment in Mexico City, 1980 - 1998 (percent)
Source: 1980, 1986: Aguilar 1996, Cuadro 8.1; 1989–1998 Own calculations, based on INEGI, Censos Económicos 1989, 1994, 1999. This transformation of the productive basis of Mexico City contributed to a remarkable modification of the national urban network. Until the end of ISI, Mexico City was the unchallenged epicenter of the national economy. In 1980, 37 % of national production originated in this city, being manufacturing (with a share of 47 %) and public and social services (45 %) the sub-sectors with highest concentration. Regarding employment, the situation was similar, with 40 % of all employment, but 44 % in manufacturing being concentrated in Mexico City (see tables 3 and 4). Since then, however, situation changed dramatically. Mexico City lost 14 % of its share in national GDP, mainly due to drastic reduction of manufacturing in the total national production (-38 %). Thus, in 1998 only 27 % of national industrial output originated in Mexico City. All other sectors also lost participation, except one: Financial services, insurance, real estate increased their participation by 10 %. As regards the labor market, the tendencies were even more pronounced. Mexico City’s share dropped to 24 %, being again manufacturing the sector with the most severe losses (-54 %). The reduction of Mexico City’s share in national production and employment (and, by the way, also in population), was basically for the benefit of Northern border states (Chihuahua, Baja California y Nuevo León), and, in second place, for federal states in the country’s center or west of it (Querétaro, Aguascalientes, Puebla, Jalisco Guanajuato) and in the South-east (Quintana Roo)(table 5). Table 3: Shares of Mexico City in national GDP, 1980 – 1998 (percent)
Source: Sobrino 2000, Cuadro 3.2.2. Table 4: Shares of Mexico City in national employment, 1980 – 1999 (percent)
Source: 1980, 1986: Aguilar 1996, Cuadro 8.1; 1989–1998 Own calculations, based on INEGI, Censos Económicos 1989, 1994, 1999. Table 5: Main winners among Mexican federal states regarding GDP and employment
Source: Own calculations, based on INEGI, SCN and on INEGI, Censos Económicos 1989, 1994, 1999. Transformation happened, however, not only in Mexico City’s economy. Rather, economic changes were accompanied by social and spatial restructuring. It is one of the main outcomes of nearly 20 years of transformation policy that poverty today affects more people than ever, and that both in absolute and relative terms. In 2000, more than 60 % of Mexico City’s population were stuck into poverty, which amounts to nearly eleven million people (table 6).2 In addition, real wages declined by two thirds since 1982, implying that people nowadays have to work three times as long as 20 years ago to buy the same items (own calculation, based on Juárez Sánchez 2002 and Fox Quesada 2002). In terms of social polarization, data do not allow for a conclusion. On the one hand, the GINI-coefficient showed three highs in 1994, 1998 and 2000, pointing to a strong tendency of polarization (INEGI, ENIGH).3 On the other hand, analyzing participation of Mexico City’s household in total and average income of the city, the result is more favorable to poorer groups, showing that they succeeded to increase their share after the crisis of 1994/95 (own calculations, based on Garza/Fajardo 2000, cuadro 3.7.1.). This might be, however, the immediate result of the "peso-crisis" (which certainly hit the well-off more than the already poor), while both in more recent years and in the long rung (1980–2000) the reverse result is likely. Table 6: Poverty in Mexico City, 1984 – 2000
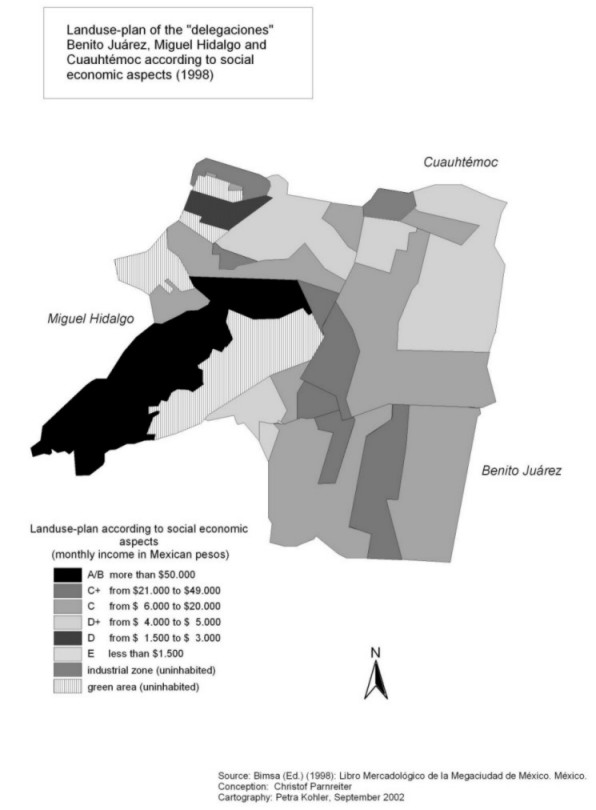
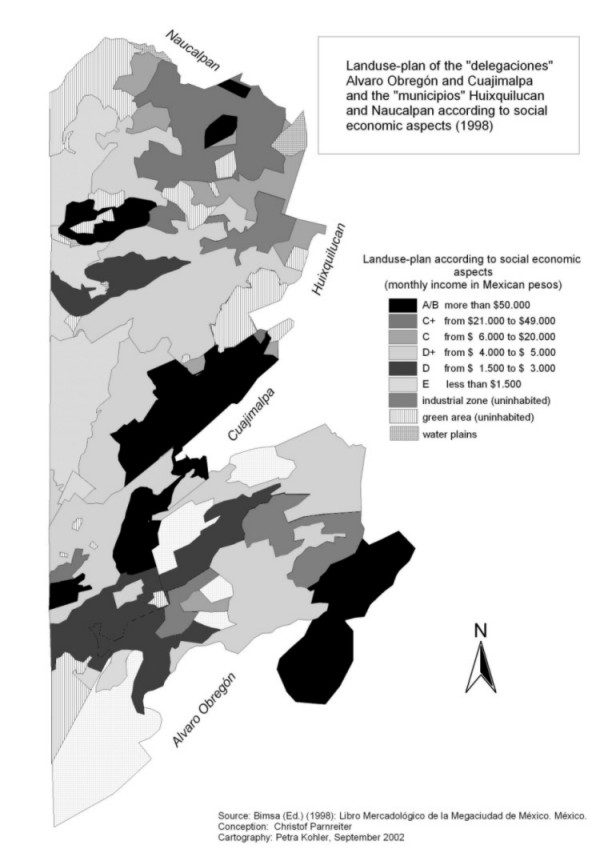
Source: Boltvinik 2002. Date before and after 1994 are only limited comparable. Spatially, the most important feature is that the city is far less polarized as previously assumed; rich and poor people live rather close together. Studying residential segregation on a large scale (what has been made possible by improvement in the collection of census data4), Rubalcava and Schteingart (2000) show that in "delegaciones" (districts), that are considered to be rich a considerable number of middle and even low income households are to be found. For example, in Miguel Hidalgo, Benito Juárez and Cuauhtémoc in the city’s center half of the population belong either to the top of the social pyramid (234,000 well-off people) or to the bottom (245,000 people living in poor households)(own calculations, based on BIMSA 1998, 37; see map 1). Even around Paseo de Reforma, one of the main business streets and certainly one of the most globalized areas in Mexico City, a considerable number of poor households is found (SEDECO 2001, 109). Another, even more clear example of the multi fragmented city, where rich and poor while living physically closer together are socially further apart (e.g. through the spread of gated communities) is Huixquilucán, a district in the Western parts of Mexico City. There, 22 out of 46 neighborhoods ("colonias") are categorized as "rich", while another 22 are considered to be "poor" and two are "very poor". Thus, despite the expansion of gated communities in Huixquilucán, rather than being a rich area it is strongly fragmented. The same applies, though to a lesser extent, to the neighboring districts of Cuajimalpa, Álvaro Obregón and Naucalpan (see map 2). Map 1: Segregation in Miguel Hidalgo, Benito Juárez and Cuauhtémoc (1995)
Map 2: Segregation in Huixquilucán, Cuajimalpa, Álvaro Obregón and Naucalpan (1995)
Santiago de Chile5In Chile, ISI was abandoned already in the early 1970s – after the coup d’etat of Augusto Pinochet. Thus, transformation to an open economy, oriented towards the world market, began a decade earlier than in Mexico. As a consequence, changes in the economic structure of Santiago de Chile began earlier, too. As shown in table 7, manufacturing suffered severe losses in the employment in Santiago between 1967 and 1994, while services substantially increased their participation. A look on production, however, shows that from the mid 1980s manufacturing could maintain its share in the urban GDP (table 8). That points to a recovery of industry that began with giving up strict neoliberalism and the implementation of more flexible, heterodox policies. It is, however, striking that despite this recovery financial services (including insurance and producer services) contribute more to the urban GDP than manufacturing, being the second sector behind trade. Table 7: Employment in Santiago de Chile, 1967 - 1994 (percent)6
Source: de Mattos 1999,3 (cited in Rodríguez/Winchester 2001, 5) Table 8: GDP of Santiago de Chile, 1985 - 1997 (percent)
Source: Karin Fischer/Johannes Jäger, based on Banco Central de Chile 2001(1) includes financial services, insurance, producer services. (2) includes education, health care. Like in many other Latin American countries, ISI in Chile was characterized by a high concentration of economic development in the capital city (and also of population). In the early 1970s, nearly half of the country’s GDP originated in Santiago. This share dropped, however, to 42 % in 1985, to recover since then. Different to the development in most other Latin American countries, Santiago regained its economic primacy. At the end of the 1990s, again half of the country’s GDP is produced in the capital (table 9). It is interesting to note that manufacturing too is very much centralized in Santiago. After a relatively short period of crisis and some decentralization, in which the share Santiago in the total national production in manufacturing dropped from 52 to 44 % (1970 – 1980), the capital’s industry recovered to produce more than half of national output at the end of the 1990s (de Mattos 1999, 3; table 10). Most centralized sector are, however, financial services with four fifth of national GDP originating in Santiago de Chile. Table 9: Shares of Santiago de Chile in national GDP, 1960 – 1997 (percent)
Source: Karin Fischer/Johannes Jäger, based on CIEPLAN/SUBDERE (1995), de Mattos el at. 2001, 8, Banco Central de Chile 2001. Table 10: Shares of Santiago de Chile in national GDP, selected sectors, 1985 – 1997
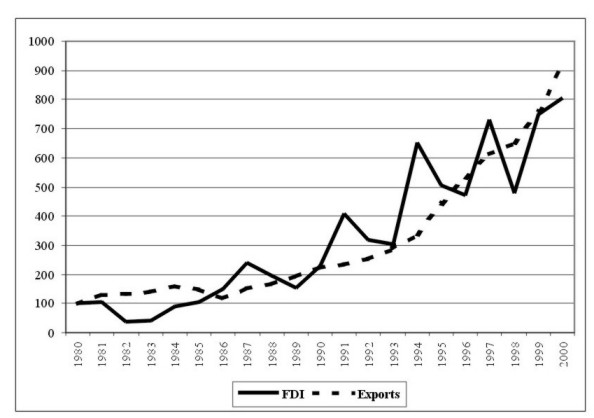
Source: Karin Fischer/Johannes Jäger, based on Banco Central de Chile 2001 (1) includes financial services, insurance, producer services. In terms of social developments, existing information points to certain catching up of poorer strata in the last 15 years. While in 1987-88 the poorest 30% of households in Santiago achieved 8.7% of all incomes, in 1996-97 it was already 11 %. This recovery happened basically at expense of the richest tenth of the urban population. Regarding per capita household incomes, the picture is less favorable, being the upper income groups the ones which expanded their share in total income (de Mattos 2000, table 4 and 5; de Mattos 2002, table 2). Spatially, Santiago used to be a city with a very pronounced residential segregation on small scale. Rich and poor neighborhoods were strictly separated; partially because of urban policies implemented by Pinochet (whose studied profession was, by the way, geographer). A clear-cut segregation is true in both senses of the term (regarding the concentration of social groups in specific urban areas and regarding the social homogeneity of these areas). Put differently, rich and poor lived in different spaces, and they did not share theses spaces with elements of the "other" group. In 1992, 54 % of rich people live in only two districts ("comunas"), Las Condes Providencia y Vitacura, while another fifth of the rich gathered in for more "comunas: Lo Banrechea, Nunoa y La Reina (Ortíz/Inostroza 1997; Ducci 2000; Rodríguez/Winchester 2001; Greene/Soler 2001). It is therefore not by accident that the models of the Latin American city, which showed a marked residential segregation, were based by and large on cast studies in Santiago (for an overview see Wilhelmy/Borsdorf 1984). Since then, not much has changed (Ortíz/Schiappacasse 2000). The concentration of different social groups in different parts of the city is still very pronounced (Arriagada/Simioni 2001, 25-26, 30), what is shown also by the fact that income differentials between "comunas" increased (own calculations based on Mideplan). Recent works, however, indicate that on a larger scale (that is, in smaller spaces) segregation increased, what points to a mixing of social groups in specific places (Sabatini 2002; Cáceres/Sabatini 1998). This is particularly true in those poorer "comunas", which are neighboring rich districts. Affluent and, in particular, middle income people, looking for cheaper land, "invade" the poorer neighborhoods, creating there islands of prosperity (ACOP 2001, Cámara Chilena de Construcción 2001). Thus, at least in some parts of the city we also observe a process of fragmentation, making the established picture of segregation more complex. GLOBAL CITY FORMATION IN MEXICO AND CHILE: EVIDENCE AND AN AGENDA FOR FURTHER RESEARCHAfter having documented major economic, spatial and social changes in Mexico City and in Santiago de Chile, we now can interpret the findings in order to discuss whether global city formation takes place in the two cities. Global cities are places where national and regional economies are articulated with the world economy. They are, therefore, places where global flows of capital, goods, information, migrants, etc. intersect, and where these flows are directed, controlled, and managed (see, for example, Friedmann 1986; Sassen 1991; Knox/Taylor 1995). Thus, if global city formation in Mexico and in Chile is expected to happen, three requirements have to be met. There has to be, first, something to articulate with the world economy. Differently put, if the hypothesis of global city formation in Mexico and in Chile shall be confirmed, then significant levels of globalization of the economies of the two countries must be proved (e.g. via export production or capital flows). Second, globalization of the Mexican and Chilean economy must be at least partly, organized, managed and controlled from its capital cities. That requires a substantial number of command and control functions in the cities in question. Third, in order to justify the attribute "global city formation", the cities must be linked with other global cities through the flows of advanced producer services, capital, information, and so on. Evidence allows, in fact, to conclude that all three requirements are met. Mexico and Chile passed through a pronounced course of globalization in the last decades. Though it is, due to limitations in space, not possible to describe at length all transformations related to globalization, critical features may be sketched out. In Mexico, the growing outward orientation of the economy is shown, first, by a rapid increase of exports, which were nine times higher in 2000 than in 1980. As a consequence, the value of annual exports grew from 6 % of GDP in 1980 to 35 % in 2000 (see figure 1).7 Figure 1: Exports and FDI in Mexico, 1980 – 2000 (1980=100)
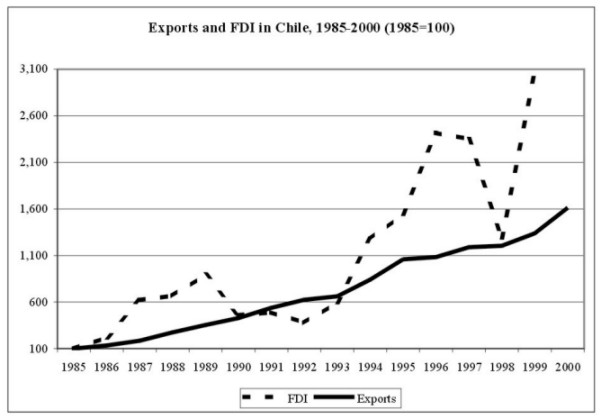
Source: Own Calculation, based on INEGI and Banco de México Exports, however, did not only grow, they also changed their characteristics. While oil makes an ever-smaller portion of all exports (10 % in 2000, compared to 58 % in 1980), industry and in particular "maquiladora"-industry8 grew extraordinarily. In 2000, maquiladoras made 47.7 % of all exports (14 % in 1980), and non-maquila export manufacturing amounted to further 40 % (1980: 16 %)(own calculations, based on Banco de México, IFE). The other significant change in the characteristics of exports is that they are ever more organized via global commodity chains. About 85 % of Mexican exports corresponds to so-called "programs of temporarily imports for re-exportation", which permit the custom and tax-free import of semi-fabricated goods that are then processed in Mexico and re-exported (basically to the United States)(Dussel Peters 2000a). Because foreign trade is concentrated primarily in Mexican branches of transnational companies, it is, strictly spoken, ever less inter-national trade. Rather, intra-firm trade is the dominant structure. Two thirds of Mexican exports of goods to the United States9 are traded within firms, and so are 44 % of imports from the US. Moreover, the share of intra-firm in overall Mexican foreign trade is still on the rise (OECD 2002, table VI.4). Globalization of the Mexican economy is shown, second, by a strong increase in foreign capital flowing to the country. Annual foreign direct investment grew eightfold between 1980 and 2000, amounting to more than 13,000 million US-D in 2000 (figure 1; Dussel Peters 2000b, table 1; CNIE 2001, table 5). In Chile, exports and foreign direct investment also grew markedly. Exports were 16 times higher in 2000 than in 195, while annual inflows of FDI were even 30 times higher (figure 2). The structure of Chilean exports remained relatively stable, being copper with more than 40 % still the most important product. Some non-traditional exports such as fruits, cellulose, salmon or forestry rise, too (Banco Central de Chile 2001). Figure 2: Exports and FDI in Chile, 1985 – 2000 (1985=100)
Source: Banco Central de Chile Thus, it can be concluded that the first requirement for global city formation posed above is clearly met. In both countries, export production (of manufacturing in Mexico and of traditional and non-traditional primary goods in Chile) increased strongly, and both countries are important recipients of foreign direct investment. There is, hence, much to be articulated with the world economy. The second established condition, that is necessary to allow speaking of global city formation, is that a substantial number – and concentration – of command and control functions (usually identified with advanced producer services) must be found. In general, both in Mexico and in Chile financial services, insurance and real estate extended their participation in national GDP in the last decades. In Mexico, they grew by 30 % to 14.5 % of national GDP (1980 – 2001), while in Chile this sector doubled – with significant variations – its share from 5.2 % in 1974 to 11.3 % in 1998 (own calculations, based on INEGI, SCN; Banco Central de Chile 2001). The growth in these services is, however, very centralized (see tables 3 and 10). In Mexico, 35 % of national GDP in financial services, insurance and real estate originates in Mexico City (1998), which represents a slight, but constant increase over the years. In Chile, 78 % (!) of national GDP in financial services are produced in Santiago (1997). Thus, they represent clearly the strongest concentrated sub-sector in Chile, while in Mexico centralization of advanced producer services is only outnumbered by public and social services. Though the concentration of advanced producer services in the respective capital city supports the hypothesis of global city formation, additional information might be useful to further strengthen the argument. In a detailed analysis of the regional distribution of headquarters of main companies operating in Mexico (Parnreiter 2002a), I showed that Mexico City is not only the place, where most companies have their command centre. Rather, the interesting finding is that the greater a firm’s sales volume and the stronger its links to the global economy in terms of exports, imports and foreign capitalization, the higher the probability that its headquarters are in the Federal District (see table 11).10 For example, companies dominated by international capital are much more likely to locate in Mexico City than nationally owned, private firms (58.3 % versus 39.4 %). Regarding foreign trade (except for the maquiladora industry), the results show the same tendency: the preference for choosing Mexico City to locate headquarters increases the more a company exports or imports: 73.4 percent of the exports of the 100 biggest export companies originate in the Federal District. Table 11: Location patterns of the Top 500 firms registered in Mexico, 1998 (percent)
Source: Own calculations, based on Expansión 1999: Las empresas más importantes de México. Note: Along with maquiladoras, the three state-owned enterprises listed among the 500 most important Mexican firms are not included in Table 2. Petróleos Mexicanos (Pemex), the biggest firm registered in Mexico, has its headquarters in the Federal District, while the other two state-owned enterprises, which are of minor importance, are located in Baja California Sur. Regional distribution of foreign investment points in the same direction. Both FDI and portfolio investment are highly concentrated in the Federal District (for FDI see table 11). It is remarkable that the Federal District maintained a very high level of 60 % of all FDI for 13 years, despite the end of important privatizations and regardless of the significant growth of FDI directed to maquiladora industry. It is striking that the six border states (Baja California, Coahuila, Chihuahua, Nuevo León, Sonora, Tamaulipas), where more than 80 % of all maquiladoras a many other export industries are located, together attracted only 25.4 percent of FDI (1994 – 2001) – less than half the share of FDI invested in the Federal District. Mexico City’s dominance is even greater if one considers that most of the FDI in the State of Mexico may have been directed to firms located in the ZMCM. In that regard, Mexico City’s share was nearly two-thirds of all FDI. Portfolio investment data on regional distribution is lacking but it is likely that here the concentration in the Federal District is even higher than for FDI since the stock market and the headquarters of all major banks – and hence their accounting departments – are located in the capital. Table 11: Distribution of foreign direct investment in Mexico, 1989 – 2001 (percent)
Source: Author’s calculations based on SECOFI; Dirección General de Inversión Extranjera (1989 – 1993) and on CNIE 2002 (1994 – 2001).) FDI includes new investment plus investment in maquiladoras. Due to the change in methodology for measuring FDI, the absolute numbers before and after 1994 are not comparable. However, since the purpose of this paper is to show the regional distribution of FDI, a comparison can still be made. In Chile, a first analysis of locational patterns and of FDI leads to the same conclusion. Only one of the top 20 firms – a shipping company – is not headquartered in Santiago, while all other companies, including mining, have their main office in the country’s capital (own calculation, based on Unidad de Inversiones y Estrategias Empresariales (UIEE) / División de Desarrollo Productivo y Empresarial (DDPE), Santiago; El diario. IDE: Ministerios de Economía, Minería y Energía/Foreign Investment Committee). Regarding regional distribution of FDI, the share registered in Santiago is much smaller than the one of Mexico City. Santiago is, however, by far the region where most capital is flowing in (table 12). Table 12: Distribution of foreign direct investment in Chile, 1990 – 2000 (percent)
Source: INE 2002. One can conclude, therefore, that the second requirement for global city formation is met, too. Economic activities, which are necessary to articulate national and regional economies into the world market (e.g. the organization of export production), are increasing their importance, and they are strongly concentrated in Mexico City and in Santiago. Consequently, the two cities are places, wherefrom the globalization of the Mexican and the Chilean economy (or parts of it) is, at least to some extent, organized and managed. Regarding the third condition for "global city formation" – linkages to other global cities through nets of advanced producer services firms and other critical flows – evidence for Mexico City allows for the conclusion that this city is in fact well embedded into the cross-border grid of global cities (Parnreiter 2002a). Various studies of the ‘Globalization and World Cities Study Group and Network’ (Beaverstock et al. 1999a; 1999b; 2000; Taylor/Walker 2001; Taylor 2000; Taylor et al. 2002) show that advanced producer services firms operating at a global level have created firm links to Mexico City. Among 55 world cities identified by the GaWC, Mexico City ranks 20th, as the highest ranked Latin American city. It has 12 percent of world city formation (measured in terms of the level of service provision of the mentioned sectors relative to the top scoring city), ahead of São Paulo (with 11 percent of world city formation), Buenos Aires (6 percent), Caracas (6 percent), and Santiago (5 percent). Mexico City can be compared to cities like Zurich (11 percent), Johannesburg, Milan (13 percent each) and even Los Angeles (14 percent). The high ranking of Mexico City is based on the strong presence of ‘global players’ among service firms. Mexico City qualifies as a ‘major’ global service center for all four sectors (accountancy, advertising, banking and legal services), while São Paulo is a ‘major’ global service center in three sectors (advertising, banking, and legal services) and Buenos Aires only in one (banking). The fact that Mexico City houses many of the global service firms suggests that the Mexican capital is well embedded into the cross-border network of cities. Indeed, further evidence obtained by the research of the ‘GaWC’ confirms this assumption. Firms in the advanced producer service sector that are located in London but operate on a global scale tend to have a high presence in Mexico City. In finance and banking, for example, there is a 93 percent probability that a global firm located in London has a direct link to another of the firm’s branches in Mexico City. Considering that only two cities show a higher probability of direct organizational links to London (New York and Tokyo) and taking into account that London-based finance firms are as present as in Mexico City only in three cities (Buenos Aires, Hong Kong, and Singapore), Mexico City can in fact be considered as a strategic location for globalization processes. In advertising the organizational links to London are slightly weaker—the likelihood that a London-located advertising firm has a direct connection to another of the firm’s branches in Mexico City amounts to 82 percent. In law the ties are still very weak—the probability for a London-located law firm to have direct link to Mexico City is only 5 percent. Mexico City is also well integrated into inter-urban telecommunications networks. Concurrent with the findings of the ‘GaWC’, a survey which classifies the competitiveness of telecommunications provision in July 1998 in 25 major cities ranks Mexico City 16th - better than any other third-world city and better even than Zurich or Singapore (Finnie 1998, cited in Graham 1999, 938). Finally, analyzing of air travel between 22 world cities between 1985 and 1997. Smith et al. (2002; Smith and Timberlake 1995) found that Mexico City ranked 16th in terms of the number of mutual relations with other cities in the network and in terms of the strength of the connections. Mexico City is more central than Miami, Montreal, or Houston, but behind San Francisco, Chicago, Madrid, or Zurich. To sum up: Evidence presented indeed allows speaking of global city formation in Mexico and in Chile. While the cities’ function during import substitution (ISI) were to develop and integrate the domestic market, in the era of globalization they are working as pivots not only for the operating of the national economy but increasingly between the respective national economy and the global economy. Rather than integrating the domestic market via the production and distribution of manufacturing goods, today both capital cities are ever more engaged in "producing" the global integration of those parts of the countries’ economy that are competitive at the world market.11 Producing global integration implies "nodalization", which is empirically documented by the high concentration of those activities and infrastructures, which are essential for the globalization of the countries’ economies (e.g. producer services, foreign investment, headquarters of companies with global reach, networks of telecommunication). Thus, Mexico City as well as Santiago is being transformed from the auto centric city into the city as a node. In addition, global city formation in Mexico City and in Santiago involves a modification of their relational spaces, that is, their interactions with other urban areas. Due to the concentration of "global city functions" both countries witnessed the emergence of new forms of centrality in their urban networks that differs from the well-known phenomenon of urban primacy in so far as it can well be accompanied by an overall decentralization of economic production and of population (Parnreiter 2002c); Parnreiter/Fischer/Jäger 2002). RESEARCH AGENDATo this point, the argument has been that global city formation in Latin America is based on three requirements: An increasing orientation of Latin American economies towards "globalization" (basically via export production, imports, and financial flows); a growing importance of advanced producer services and their concentration in major cities; and the integration of these cities into global service networks created by big firms. Evidence presented for Mexico City and Santiago de Chile supports the notion that we may indeed speak of global city formation. This conclusion is, however, still tentative, because it is based on assumptions. The crucial point is that though each of our three conditions may be well documented individually, the links between them are still not proved. It is, however, precisely the connection between increasing export production, growing importance and concentration of advanced producer services, and cross-border links between cities, that makes the notion of global city formation sound. Put differently, we know that Mexico and Chile increased their export production in the last two decades, we also know that advanced producer services are highly centralized in Mexico City and in Santiago, and we know, that these services are partly provided by firms operating on a global scale – but we do not know whether advanced producer services in Mexico City and in Santiago (be they provided by local or global companies) are articulating production in the two countries with the world market. That remains an assumption – a reasonable one, but an assumption. Taking the automobile sector in Mexico as an example, this can be exemplified as follows. The Mexican branches of General Motors, Daimler-Chrysler, Volkswagen, Ford and Nissan are leading enterprises in terms of sales, exports and foreign investment. All but Volkswagen have their headquarters in the Federal District, yet production facilities are spread all over the country. General Motors produces in Toluca (State of Mexico), Ramos Arizpe (Coahuila) and Silao (Guanajuato); Daimler-Chrysler in Saltillo (Coahuila), Toluca and in the Federal District; Ford in Hermosillo (Sonora), Chihuahua and in Cuautitlán (State of Mexico); Nissan in Aguascalientes, Cuernavaca y Zivac (both in Morelos), and in Lerma (State of Mexico). What by some is interpreted as decentralization of manufacturing (and hence of de-industrialization of Mexico City) is in my understanding the emergence of a new "national" division of labor, that completes the new "international" division of labor.12 Big companies, while having dispersed their plants across various cities in the country, maintain only specific segments of production in Mexico City, namely command and control functions. Take FDI: As noted above, foreign direct investment is strongly concentrated in the Federal District. Nevertheless, massive inflows of capital did not translate into an increase in production and employment in manufacturing in Mexico City (see tables 1–4). Rather than being a statistical distortion, this points to the specific role of the Federal District as a place, where FDI is processed, while "real" investment takes places where production facilities are located. This argument is supported by a closer analysis of regional distribution of FDI. Between 1994 and 2001, the Federal District captured 4.109 million US-D as FDI in automobile industry, while the seven federal states, where the plants of this industry are actually located (Chihuahua, Edo. de México, Aguascalientes, Guanajuato, Coahuila, Sonora and Morelos), captured in sum only half of FDI in the Federal District. Daimler-Chrysler and Ford, for example, invested $1.5 billion each in Mexico (1998-99) in order to expand an existing plant in Coahuila in the case of Daimler-Chrysler, and to build a new one in Chihuahua in the case of Ford. Yet, since both companies are headquartered in the Federal District, it is very likely that these inflows of capital have entered the books in Mexico City (because accountancy is carried out there), despite the fact that "real" investment took place in the North (Parnreiter 2002b).13 If FDI is being processed in the Federal District but "materialized" elsewhere, then we have an example illustrating that the capital is a site wherefrom global production carried out in Mexico is serviced. Yet, detailed information about this division of labor – and hence about the transformation of Mexico City into a "pivot" between "global" production in Mexico and the world market – is missing. We do not know what flows of capital (services, goods, etc.) exist between the cities that take on manufacturing and the Federal District. Thus, neither the concrete shape nor the particular character of the emerging new "national" division of labor is identified. As a consequence, both shape and character of the Mexican urban network remain unspecified. To overcome this limitation, we have to seek a better understanding how spatially dispersed export production, centralized services, and cross-border networks are coming together. A way to achieve this is to integrate two bodies of literature, that have co-existed so far without much communication, though they are in fact not really apart: global city research and global commodity chain research. A global commodity chain is, according to Hopkins and Wallerstein (1986, 159), a "network of labor and production processes whose end result is a finished commodity" (for a compilation of case studies see Gereffi/Korzeniewicz 1994). Because the global commodity chain approach seeks to trace all kinds of inputs (such as capital, labor, raw materials, machinery, services, etc.) from their origins to the end product, the concept is basically about flows. It is, therefore, useful to study connections between different places, which are socially tied together in a commodity chain. Because inputs originate more often than not in different countries, the concept draws attention to the global character of the chain and hence to the internationality of connections. On the other hand, the global commodity chain approach also forces us to consider very specific places, namely those where different inputs are pulled together. It is, hence, a concept that is appropriate to analyze transborder networks as well as their nodes. Both global city and global commodity chain research have, despite their unquestionable values, some shortcomings. Global city research is strong in generally conceptualizing the relationship between globalization and cities, and it is also strong in analyzing socio-economic changes in specific cities, paying much attention to the role of advanced producer services. More recently, thanks to the work of the GaWC, our knowledge of connections between cities at a global scale has increased substantially. The weak point is, however, that the analysis of those links is not extended to a national scale. GaWC does not (yet) provide information about the clients of firms, which are connecting globally in service networks. If, however, the basic idea of a global city is that it articulates local, regional and national economies into the world economy, and if this globalization is (at least partly) produced by service firms operating in global networks, then there must be demand for these services at a national or local scale. In other words: Cross-border connections between cities obviously have to have extensions at the national level. Thus, the global urban network is built upon ramifications at lower levels, ramifications that link secondary and tertiary cities to the global cities. Of course, connections between cities at a national scale have been studied. In Mexico and in Chile, they focused, however, on migration flows and on transportation. Without dismissing the importance of these flows, it is obvious that the rationale for selecting them is not only based on analytical reasons but also guided by the availability of data. To my knowledge, analysis of connections between cities built upon intra- or inter-firm links (e.g. through "flows" of services) do neither exist for Chile nor for Mexico. The global commodity chain approach has most merits in studying production chains in manufacturing. In addition, some work has been carried out on investigating agriculture and retailing (Gereffi/Korzeniewicz 1994; Crewe/Gregson 1997; Gereffi 1999). Among the weak points of this body of literature is, first, that most of it remains abstract when it comes to space. Despite the theoretical insight that a global commodity chain links inputs from different parts of the world in order to pull them together in specific sites, to my knowledge none of the existing studies takes space seriously. Obviously, case studies are carried out in certain places (e.g. villages where people work in the textile industry [Vangstrup 1997]), and cluster studies (which are sometimes related to global commodity chain research) focus on the potentials of localities (e.g. Schmitz 2000; Dávila Flores 2002). They do, however, not conceptualize the whole chain as space-bound, that is, as a connection between rural areas, villages, cities, and states. The second main shortcoming of global commodity chain literature is that it ignores by and large that the task of connecting the different sites (in order to put together a chain) has to be done. This task is, as much of the global city literature tells up, related to advanced producer services. However, in spite of their importance, advanced producer services have to my knowledge not been subject of global commodity chain research. Thus, the crucial point – what makes a chain a chain? – remains unanswered. Pulling together global city and global commodity chain approaches allows to overcome limitations of both concepts. Obviously, the global commodity chain approach can be very stimulating for urban studies. Spatializing a commodity chain, that is, spatializing an analysis of connections between the different points of a production process, means to study how cities at a regional, national and global level are linked together through flows of capital, labor, goods, services, etc. In addition, the global commodity chain approach allows to capture the local demand for services provided by global firms. On the other hand, global city research is helpful insofar, as a global city can be seen as a very specific and crucial intersection of a commodity chain, precisely because its function is to contribute advanced services to the production process. In other words: if global city research is right, without the services provided in global cities there would be no global commodity chain. Thus, a global city is a service node in and for many chains, obtaining thereby its overall centrality. Based on these insights, in order to work out our assumptions about global city formation in Latin America and to elaborate a more precise picture of how this formation fits into the globalization of production in Mexico or in Chile, we have to uncover who buys the services offered in Mexico City or in Santiago. Such a research would focus on just one link in the commodity chain, namely the one that is established between the advanced producer services sector in the capital city and its clients in other places in the respective country. In other words, the investigation would focus on a link between producers gearing to the world market (e.g. automobile production in Mexico or fruits in Chile) and service firms (be they "global players" or local companies) in the major city. Dealing with the extension of "service flows" to the national level, tracing – and mapping – the connections between Mexico City or Santiago and other cities in the respective countries would provide a missing link both for global city and for global commodity chain research. LITERATUREACOP 2001: Base de datos. Santiago. Aguilar, Adrián Guillermo: 1996 Reestructuración económica y costo social en la Ciudad de México. Una metrópoli periférica en la escena global. Ponencia presentada en el Seminario "Economía y Urbanización: Problemas y Retos del Nuevo Siglo", organizado por el Instituto de Investigaciones Económicas, UNAM, en la Unidad de Seminarios "Dr. Ignacio Chávez", 20-22 de mayo 1996. Arriagada, Camilo/Daniela Simioni: 2001 Dinámica de valorzación del suelo en el àrea metropolitana del Gran Santiago y desafíos del financiamiento urbano. División de Medio Ambiente y Asentamientos Humanos. Santiago de Chile. Banco Central de Chile: 2001 Indicadores Económicos y Sociales de Chile 1960-2000. Santiago. Banco de México, Información Financiera y Económica (IFE), http://www.banxico.org.mx/eInfoFinanciera/FSinfoFinanciera.html (Septembre 2002) Beaverstock, J. V./R. G. Smith/P. J. Taylor: 1999a A roster of world cities. In: Cities 16, 16 (6), 445-458. Beaverstock, J. V./R. G. Smith/P. J. Taylor: 1999b The global capacity of a world city: a relational study of London. In: GaWC Research Bulletin 7 Beaverstock, J.V., R.G. Smith and P.J. Taylor: 2000 Geographies of Globalization: US Law Firms in World Cities. In: Urban Geography, 21 (2), 95-120. BIMSA: 1998 Libro Mercadológico de la Megaciudad de México. Buro de Investigación de Mercados (BIMSA). México DF. Boltvinik, Julio: 2002 Pobreza en la ciudad de México. In: La Jornada, 25.1.2002 Cámara Chilena de Construcción: 2001 Base de Datos. Santiago. Cáceres, Gonzalo/Francisco Sabatini: 1998 Chile neoliberal sin instrumentos de recuperación de plusvalías. ?Un contrasentido? Viejas y nuevas experiencias en Santiago. PUC. Serie Azul no. 23. Comisión Nacional de Inversiones Extranjeras (CNIE): 2001 Informe estadístico sobre el comportamiento de la Inversión Extranjera Directa en México (Enero - junio 2001). http://www.economia.gob.mx/ (7.11.2001) Comisión Nacional de Inversiones Extranjeras (CNIE): 2002 Informe Por Estados. http://www.economia.gob.mx/ (Octubre 2002). Crewe, L./N. Gregson: 1997 Excluded spaces of regulation: car boot sales as an enterprise culture out of control? In: Environment and Planning A 29, pp. 1717-37. Dávila Flores, Alejandro 2002 Matriz de insumo-producto de la economía de Coahuila e identificación de sus flujos intersectoriales más importantes. In: Economía mexicana, nueva época, vol. XI, núm 1, 79-162. De Mattos, Carlos: 2000 Reestructuración del mercado metropolitano de trabajo, distribución del ingreso y polarización social en Gran Santiago. Mimeo. De Mattos, Carlos: 2002 Santiago de Chile de cara a la globalización, ¿otra ciudad? Documento preparado para el Seminario Internacional El Desafío de las Areas Metropolitanas en un Mundo Globalizado. Una mirada a Europa y América Latina, realizado en Barcelona durante los días 4, 5 y 6 de junio del 2002, bajo la organización del Institut Catala de Cooperacio Iberoamericana, el Institut d'Estudis Territorials de la Universitat Pompeu Frabra y el Instituto de Estudios Urbanos y Territoriales de la Pontificia Universidad Católica de Chile. De Mattos, Carlos/Luis Riffo Pérez/Sonia Reyes: 2001 Reestructuración, crecimiento y concentración territorial de la industria: el caso de la Región Metropolitana de Santiago. Programa de Investigación Santiago Metropolitano (PISM). Santiago. Ducci, María Elena: 2000 Santiago: territorios, anhelos y temores. Efectos sociales y espaciales de la expansión urbana. In: EURE, vol. 26, no. 79. Dussel Peters, Enrique: 2000a Polarizing Mexico. The Impact of Liberalization Strategy. Lynne Rienner Publishers. Boulder/London. Dussel Peters: 2000b La inversión extranjera en México. Comisión Económica para América Latina y el Caribe (CEPAL). Serie Desarrollo Productivo 80. Santiago de Chile. Expansión 1999: Las empresas más importantes de México. México DF. Fox Quesada, Vicente: 2002 Segundo Informe de Gobierno. Estados Unidos Mexicanos. México DF. Friedmann, John: 1986 The World City Hypothesis. In: Development and Change 17, 69-83. Garza, Gustavo/Daniel Fajardo: 2000 Distribución del ingreso y estructura del consumo. In: Gustavo Garza (ed): La Ciudad de México en el fin del segundo milenio. El Colegio de México, 202-211. Gereffi, Gary: 1999 A Commodity Chains Framework for Analyzing Global Industries. http://www.ids.ac.uk/ids/global/pdfs/gereffi.pdf (24.1.2003) Gereffi, Gary/Miguel Korzeniewicz (eds.): 1994 Commodity Chains and Global Capitalism. Westport: Praeger. Graham, Stephen: 1999 Global Grids of Glass: On Global Cities, Telecommunications and Planetary Urban Networks. In: Urban Studies, vol. 36, 5-6, 929-949. Greene Zúñiga, Margarita/Fernando Soler Rioseco: 2001 Santiago: de un proceso acelerado de crecimiento a uno de transformaciones. Programa de Investigación Santiago Metropolitano (PISM). Santiago. Hopkins, Terence K./Immanuel Wallerstein: 1986 Commodity Chains in the World-Economy Prior to 1800. In: Review 10, 1, 157-170. INE: 2002 Censo 2002. Resultados preliminares. www.ine.cl (5.10.2002). Instituto Nacional de Estadísticas, Geografía y Informática (INEGI): Censos Económicos 1989, 1994, 1999. INEGI. Aguascalientes. Instituto Nacional de Estadísticas, Geografía y Informática (INEGI): Encuesta Nacional del Empleo Urbano (ENEU). INEGI. Aguascalientes. Various years. Instituto Nacional de Estadísticas, Geografía y Informática (INEGI): Encuesta Nacional de Ingresos y Gastos de los Hogares (ENIGH). INEGI. Aguascalientes. Various years. Instituto Nacional de Estadísticas, Geografía y Informática (INEGI): Sistema de Cuentas Nacionales de México (SCN). En: Banco de Información Económica. http://www.inegi.gob.mx/difusion/espanol/fbie.html Juárez Sánchez, Laura: 2002 Los trabajadores de México a dos décadas de neoliberalismo económico. Universidad Obrera de México, México D.F. Knox, Paul L./Peter J. Taylor (eds): 1995 World cities in a world system. Cambridge University Press. Cambridge. Lo, Fu-Chen/Yue-Man Yeung (eds): 1998 Globalization and the world of large cities. UNU Press. Tokyo. Mideplan: several years Encuesta Casén. Santiago. OECD: 2002 Economic Outlook. OECD. Paris. http://www.oecd.org/pdf/M00030000/M00030802.pdf Ortíz, Jorge/Wilma Inostroza: 1997 Distribución Espacial des Status Ocupacional de la Población en el Gran Santiago: Un Análisis de la Diferenciación des Espacio Social. En: Anales de la Sociedad Chilena de Ciencias Geograficas, XVIII Congreso de Geografia. Santiago, 161-169. Ortíz, Jorge/Paulina Schiappacasse: 2000 Evolución de la diferenciación areal interna del espacio social del Gran Santiago: una dinámica opuesta a la sostenibilidad social de la ciudad. In: Invest. Geogr., no. 34, 61-76. Parnreiter, Christof: 2002a Mexico: The Making of a Global City? In: Saskia Sassen (ed): Global Networks, Linked Cities. Routledge, London, 145-182. Parnreiter, Christof: 2002b La Ciudad de México: el camino hacia una ciudad global. In EURE 85, 89-119. Parnreiter, Christof: 2002c Globalization and New Forms of Urbanization in Latin America: Does the Weakening of Urban Primacy Indicate a "Polarization Reversal"? In: Kim, Inn/Young-Woo Nam/Jae-Heon Choi (eds): Diversity of Urban Development and Urban Life. Seoul National University Press, Seoul, 18-38. Parnreiter, Christof: 2003 Polarización económica y fragmentación espacial. El caso de México. In: Actas Latinoamericanas de Varsovua. Parnreiter, Christof/Karin Fischer/Johannes Jäger: 2002 Convergencia o Divergencia del Desarrollo Metropolitano: Globalización y Transformaciones Socioeconómicas en la Ciudad de Mexico y en Santiago de Chile. Ponencia presentada en el Seminario Internacional de la Red Iberoamericana de Investigadores Sobre Globalización y Territorio. Grupo Temático 4: Globalización y Expansión Metropolitana. 27 al 29 de Noviembre del 2002, Universidad de Camagüey, Cuba. Rodríguez, Alfredo/Lucy Winchester: 2001 Santiago de Chile. Metropolización, globalización, desigualdad. In: EURE, vol. 27, no. 80, 121-139. Rubalcava, Rosa Mariá/Martha Schteingart: 2000 Segregación socio-espacial en el Área Metropolitana de la Ciudad de México. In: Gustavo Garza (ed): La Ciudad de México en el fin del segundo milenio. El Colegio de México, 287-296. Sabatini, Francisco: 2002 La segregación residencial en las ciudades Latinoamericanas: causas, posiblees políticas y rol de los mercados de suelo. In: Smolka, Martim (ed.). Tierra y Exclusión. Santiago de Chile: Land Institute of Land Policy-PUCCh. Sassen, Saskia: 1991 The Global City. New York, London, Tokyo. Princeton University Press. Princeton. Sassen, Saskia (ed): 2002 Global Networks, Linked Cities. Routledge, London. Schmitz, Hubert: 2000 ¿Tiene Importancia la Cooperación Local? Experencias de Clusters Industriales en el Sur de Asia y América Latina. In: El Mercado de Valores, 9, 4-17. SEDECO: 2001 La Ciudad de México en cifras. Secretaría de Desarrollo Económico. México D.F. http://www.sedeco.df.gob.mx/indicadores/dfencifras/index.html (22.2.2002) Smith, David A./Michael Timberlake: 1995 Conceptualising and Mapping the Structure of the World System's City System. In: Urban Studies, vol. 32, no. 2, 287-302. Smith, David A./Michael Timberlake: 2002 Hierarchies of Dominance among World Cities: A Network Approach. In: Saskia Sassen (ed): Global Networks, Linked Cities. Routledge, London, 117-141. Sobrino, Jaime: 2000 Participación económica en el siglo XX. In: Gustavo Garza (eds): La Ciudad de México en el fin del segundo milenio. El Colegio de México, México DF, 162-169. Taylor, Peter J.: 2000 World Cities and Territorial States under Conditions of Contemporary Globalization. In: Political Geography, 19, 1, 5-32. Taylor, P.J./D.R.F. Walker: 2001 World Cities: A First Multivariate Analysis of their Service Complexes. In: Urban Studies, 38 (1), 23-47. Taylor, Peter J./D.R.F. Walker/J.V. Beaverstock: 2002 Firms and Their Global Service Networks. In: Saskia Sassen (ed): Global Networks, Linked Cities. Routledge, London, 93-115. Vangstrup, Ulrik: 1997 Globalization of industry in Mexico - a commodity chain approach to the analysis of linkage capabilities. Prepared for delivery at hte 1997 meeting of the Latin American Studies Association, Mexico, April 17-19. http://136.142.158.105/LASA97/vangstrup.pdf Wilhelmy, Herbert/Axel Borsdorf: 1984 Die Städte Südamerikas. Teil 1: Wesen und Wandel. Gebrüder Borntraeger. Berlin. NOTES* An earlier version of this paper was presented at the 99th Annual Meeting of the Association of American geographers, New Orleans, 4-8 March 2003. This paper draws on work funded by the Austrian Science Fund (FWF P 14883). The paper was written in co-operation with Karin Fischer and Johannes Jäger, who are responsible for the parts on Santiago de Chile. Comments are welcome: Christof.Parnreiter@oeaw.ac.at 1. "Mexico City" refers to the whole urban agglomeration or "Metropolitan Area of Mexico City" ("Zona Metropolitana de la Cd. de México"; ZMCM). It contains, on the one hand, the country's capital, the "Federal District" ("Distrito Federal"), and, on the other hand, those municipalities of the "State of Mexico" ("Estado de México"), which have grown together with the "Federal District". In 2000, nearly half of the overall population of Mexico City (17.9 million) lived in the "Federal District". 2. Considering that in 1984 Mexico City was already in plain crisis, the increase in poverty compared to the times of ISI might be even more pronounced. 3. Data available only on the national level. The author acknowledges the support of Kristina Pirker in the compilation of data. 4. The so-called AGEB ("Áreas geoestadísticas básicas") contain about 5,000– 6,000 people. In Mexico City, there are 3,195 AGEBs. 5. The author thanks Karin Fischer and Johannes Jäger both for compilation and interpretation of data. 6. The term "Santiago de Chile" refers to the Metropolitan Area (Región Metropolitana"). 7. It should be added that imports grew even faster, for what reason Dussel Peters (2000a) speaks, contrary to the official discourse, of an import driven economy. 8. Maquiladoras are export processing zones. 9. Trade with the United States amounts to 90 % of Mexican foreign trade. 10. The Federal District is the inner part of Mexico City, covering about a third of the city's surface and housing 50 % of its inhabitants. 11. Yet manufacturing remains important, especially in the case of Santiago. 12. The rationale behind the dispersion of manufacturing is that the principal market of industries is not anymore the domestic market (and hence the large urban agglomerations), but the United States. In addition to closeness to the now main market, the Northern border regions offer further advantages to manufacturers such as lower wages. Total, with the shift to export manufacturing, little incentives existed for (transnational) companies to stay in Mexico City or to establish their plants there (Parnreiter 2003). 13. It should be noted, however, that things are different in maquiladora industry. This is an enclave economy, with very small links to the "rest" of Mexico – except the exploitation of labor force. Thus, service and other links connect maquiladora cities such as Tijuana or Cd. Juárez supposedly with the United States. In fact, most of the maquiladora cities are bi-national. Edited and posted on the web on 14th March 2003 |
||||||||||||||||||||||||||||||||||||||||||||||||||||||||||||||||||||||||||||||||||||||||||||||||||||||||||||||||||||||||||||||||||||||||||||||||||||||||||||||||||||||||||||||||||||||||||||||||||||||||||||||||||||||||||||||||||||||||||||||||||||||||||||||||||||||||||||||||||||||||||||||||||||||||||||||||||||||||||||||||||||||||||||||||||||||||||||||||||||||||||||||||||||||||||||||||||||||||||||||||||||||||||||||||||||||||||||||||||||||||||||||||||||||||||||||||||||||||||||||||||||||||||||||||||||||||||||||||||||||||||||||||||||||||||||||||||||||||||||||||||||||||||||||||||||||||||||||||||||||||||||||||||||||||||||||||||||||||||||||||||||||||||||||||||||||||||||||||||||||||||||||||||||||||||||||||||||||||||||||||||||||||||||||||||||||||||||||||||||||||||||||||||||||||||||||||||||||||||||||||||||||||||||||||||||||||||||||||||||||||||||||||||||||||||||||||||||||||||||||||||||||||||||||||||||||||||||||||||||||||||||||||||||||||