Report 3 7 November – 27 November 2019
This is the third in a series of weekly reports from the Centre for Research in Communication and Culture, Loughborough University on UK wide television and print media reporting of the 2019 UK General Election. These reports are published weekly throughout the campaign.
Report authors
David Deacon, Jackie Goode, David Smith, Dominic Wring, John Downey, Cristian Vaccari
Executive summary
At the end of week three, the two main parties continue to dominate the 2019 media election. So far Labour has commanded more coverage than the incumbent Conservatives, but as the results below show, this should not be assumed to deliver a political advantage to the Opposition. Conservative coverage is far more concentrated around Boris Johnson than Labour coverage is around Jeremy Corbyn.
To what extent is this bipartisanship a unique aspect of the 2019 campaign? Comparative data provided in this report shows that the ‘two-party’ squeeze is slightly less than was the case in the 2017 General Election but appreciably greater than in the 2015 campaign.
In the week that saw the launch of all the main party manifestos, ‘electoral process’ coverage reduced further from the previous week. Brexit remains the main substantive policy issue of the campaign, but its newsworthiness has declined for a second consecutive week. Other issues have moved up the agenda in its wake: with taxation and themes related to anti-Semitism and Islamophobia becoming particularly prominent. As things currently stand, the 2019 General Election is proving to be anything but a single-issue campaign.
There is also evidence of a re-engagement with the campaign in the printed press, after coverage reduced between week 1 and 2. Coverage in the ‘red top’ tabloids reached its highest levels for the campaign so far. In contrast, the amount of time television news spent the discussing the election dropped for a second consecutive week.
In a week in which former Prime Minister Theresa May unveiled a statue celebrating the centenary of Nancy Astor’s election as the first woman MP to take her seat in the Commons, gender imbalances in election news remain starkly evident. This is most obvious in the reporting of political candidates and campaigners, but the under-representation of women extends more broadly. Our results show that women only appear more frequently than men when they are invited to participate in a personal capacity. Male voices dominate when coverage includes people speaking in their professional capacity.
The high levels of newspaper negativity towards Labour identified in the first week of the campaign were sustained into week 2 and increased marginally in week 3.
This report has 5 sections:
- Prominence of political parties and politicians
- Changes in the issue agenda of the campaign
- Media engagement with the campaign
- Gender divisions in coverage
- Press evaluations
The results in this report are drawn from a detailed content analysis of election coverage produced on the weekdays (i.e. Monday to Friday inclusive) between 7th and 27th November. The media sampled were:
Television: Channel 4 News (7pm), Channel 5 News (6.30pm), BBC1 News at 10, ITV1 News at 10, Sky News (10-10.30pm).
Press: The Guardian, The I, The Daily Telegraph, The Times, The Financial Times, The Daily Mail, The Daily Express, The Mirror, The Sun, The Star
All election-related news items in the television programmes were analysed. For the press, all election news found on the front page, the first two pages of the domestic news section, the first two pages of any specialist election section and the page containing and facing the papers’ leader editorials were coded. For more details on the methodology of the study see https://www.lboro.ac.uk/news-events/general-election/. Intercoder reliability tests were conducted on all key variables and are ongoing.
Grateful thanks to our coding team: Eleanor Beestin, Jack Joyce, Gabriel Knott-Fayle, Sarah Lewis, Han Newman, Dayei Oh, Nathan Ritchie, Louise Tompkins and Yingzi Wang.
Section 1: Prominence of political parties and politicians
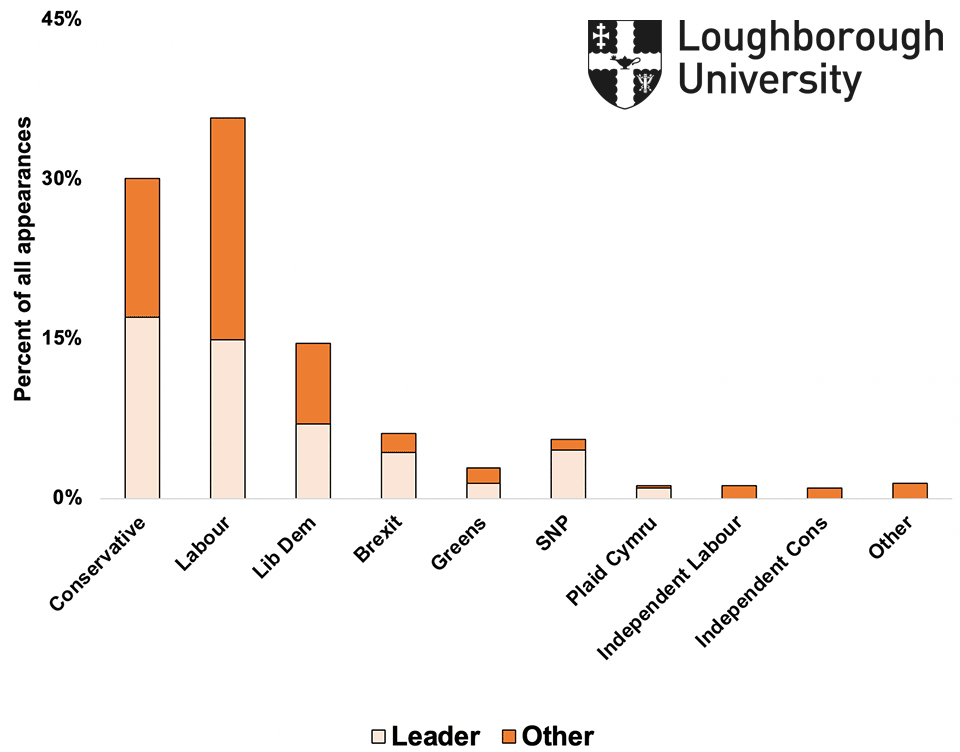
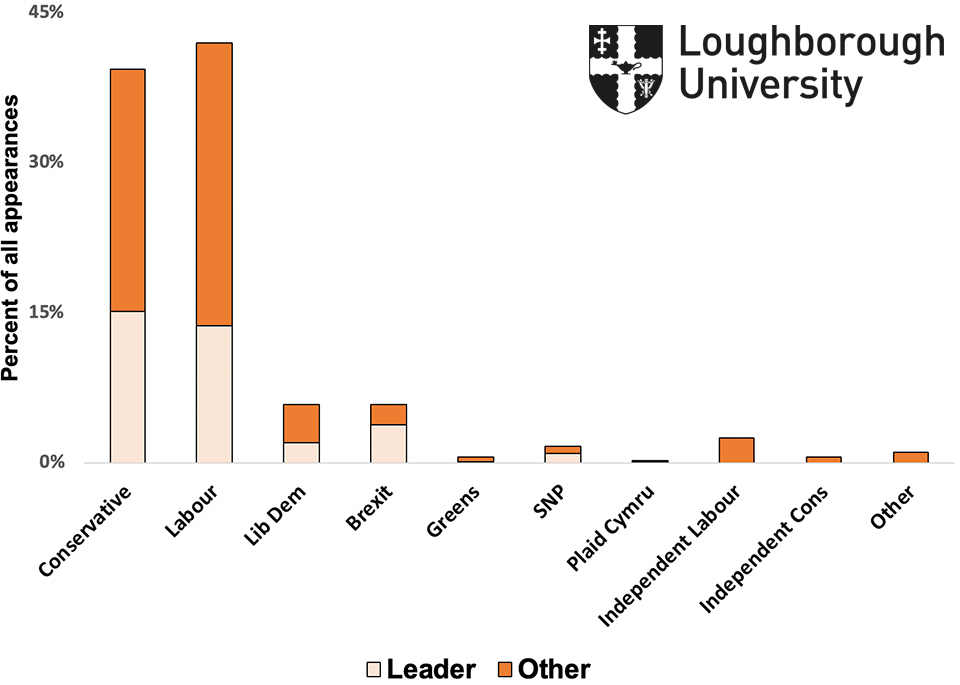
Figure 1.1 compares the levels of coverage of the political parties on TV news during the weekday coverage between 7 and 27 November inclusive1. Figure 1.2 provides the same comparison for press coverage.
Figure 1.1: Prominence of political parties in TV election coverage (7 - 27 November)
1To be coded as ‘present’ a political representative needed to have an active role within the item. They could be counted even if they were not quoted, but there had to be a clear and substantial attribution to them of a speech act or action. Up to 5 politicians could be coded per item.
Figure 1.2: Prominence of political parties in newspaper election coverage (7 - 27 November)
Key findings
- The two main political parties continue to dominate election news reporting across both sectors, but this is most evident in print. In press coverage, Conservatives and Labour account for 82 percent of all politician appearances. This falls to 65 percent in TV news.
- Labour sources overall have featured more frequently overall than Conservatives in TV and press coverage, with the widest disparity found for TV news. But Boris Johnson has cumulatively received marginally more coverage than Jeremy Corbyn in both sectors.
- Conservative party coverage is more ‘presidential’ than Labour’s in both TV and newspapers. Boris Johnson accounts for 56 percent of all Conservative appearances in TV news and 39 percent in the press. In comparison, Jeremy Corbyn accounts for 43 percent of all Labour appearances in TV and 33 percent in the press.
- In TV news, Liberal Democrats have gained 9 percent more coverage than the Brexit party (15 percent versus 6 percent). In newspaper coverage, they are both at 6 percent, with Nigel Farage gaining more mentions than Jo Swinson (4 percent versus 2 percent).
- The SNP and Plaid Cymru have barely registered in national press coverage. The SNP has established a firmer foothold in TV news (6 percent).
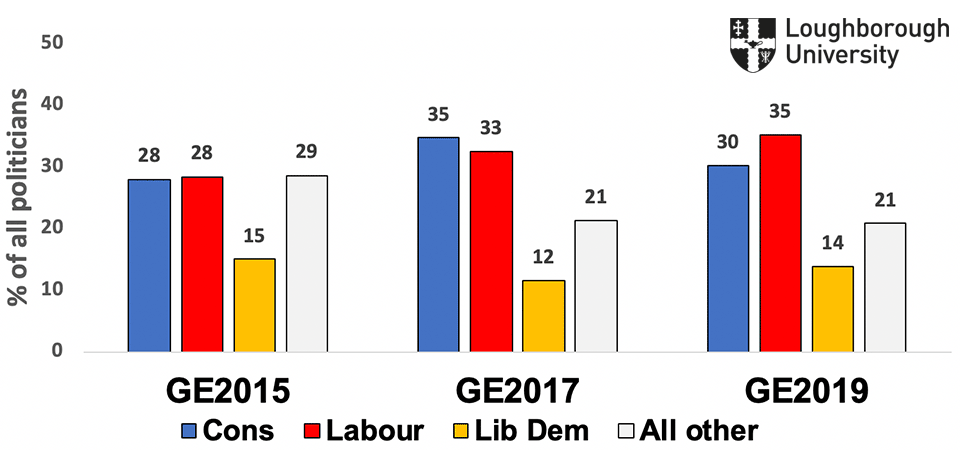
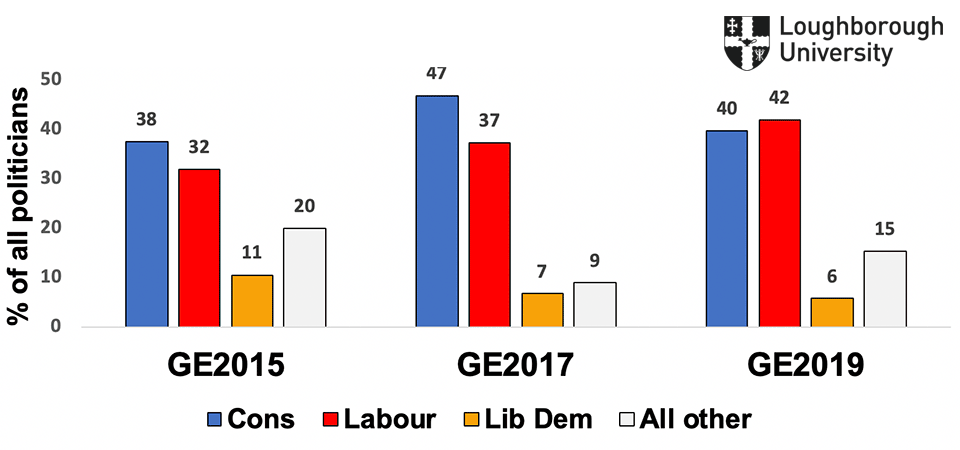
To what extent is this dominance of the two main parties an unusual feature of the 2019 General Election? Figure 1.3 compares the relative prominence of the political parties in national press coverage so far with those found in the last two General Elections (2015 and 2017)2. Figure 1.4 provides the same comparison for national TV coverage.
Figure 1.3: Party appearances in National TV news (GE2015, GE2017, GE2019)
2The CRCC conducted news audits of both previous elections, using identical sampling and coding procedures.
Figure 1.4: Party appearances in the National press (GE2015, GE2017, GE2019)
Key findings
- Overall, the dominance of the two parties in 2019 coverage so far has been slightly less than the level found in reporting of the entire 2017 UK campaign. It has, however, been substantially greater than in the 2015 General Election.
- The 2019 press coverage, the two parties account for 82 percent of all politician appearances, compared with 69 percent in 2015 and 84 percent in 2017.
- In 2019 TV news coverage, the two parties account for 66 percent of all politician appearances, compared with 56 percent in 2015 and 67 percent in 2017.
- In TV, all other minor parties share the same level of coverage achieved in 2017, which is down from 2015 levels.
- In the press, coverage of minor parties in 2019 is up on the levels found in 2017 but 5 percent behind the amounts for 2015.
Table 1.5: Top 20 Individuals by prominence
| Wk 3 | Wk 2 | ||
|---|---|---|---|
| 1 (2) | Jeremy Corbyn (Lab) | 27.7 | 31.3 |
| 2 (1) | Boris Johnson (Con) | 25.9 | 40.4 |
| 3 (3) | Jo Swinson (LibDem) | 5.4 | 7.5 |
| 4 (4) | John McDonnell (Lab) | 4.1 | 6.9 |
| 5 (8) | Nicola Sturgeon (SNP) | 3.7 | 2.5 |
| 6 (-) | Tony Blair (Lab) | 3.0 | N/A |
| 7 (7) | Priti Patel (Con) | 2.6 | 3.0 |
| =8 (5) | Nigel Farage (Brexit) | 2.3 | 6.7 |
| =8 (=11) | Matt Hancock (Con) | 2.3 | 1.7 |
| =10 (=11) | Michael Gove (Con) | 1.8 | 1.7 |
| =10 (=17) | Sajid Javid (Con) | 1.8 | 1.2 |
| 12 (6) | Jonathan Ashworth (Lab) | 1.6 | 4.2 |
| =13 (-) | John Healey (Lab) | 1.2 | N/A |
| =13 (-) | Adam Price (PC) | 1.2 | N/A |
| =13 (-) | Chuka Ummuna (LibDem) | 1.2 | N/A |
| 16 (12) | Robert Jenrick (Con) | 1.0 | 1.5 |
| =17 (-) | Dawn Butler (Lab) | 0.8 | N/A |
| =17 (-) | Barry Gardiner (Lab) | 0.8 | N/A |
| =17 (-) | Michael Heseltine (LibDem endorser) | 0.8 | N/A |
| =17 (-) | David Lammy (Lab) | 0.8 | N/A |
| =17 (14) | Brandon Lewis (Con) | 0.8 | 1.5 |
| =17 () | Wes Streeting (Lab) | 0.8 | N/A |
| =17 (-) | Emily Thornberry (Lab) | 0.8 | N/A |
Notes: percentages= individual’s appearance/ total number of items*100
Table 1.5 reviews the individual campaigners who have been most prominent in the election this week. The Top 20 also details changes in the list along with new entrants.
- The main party leaders have all commanded a lower proportion of coverage than in week 2. For example, Boris Johnson featured in 25.9 percent of items this week, compared with 40.4 percent last week. Jeremy Corbyn was the most high-profile campaigner with Jo Swinson in third place albeit a long way behind her rival leaders.
- John McDonnell, the Shadow Chancellor, continues to have a higher media profile than Sajid Javid, the Chancellor. This has been the case for all three weeks of the campaign and reflects the close journalistic scrutiny of Labour’s manifesto pledges.
- Party leaders Nicola Sturgeon and Nigel Farage remain among the most prominent campaigners for a third consecutive week. Fellow leader Adam Price of Plaid Cymru joins them in the Top 20 for the first time following the launch of his party’s manifesto.
- The return to prominence of two major politicians underscores the continuing volatility of British politics. Tony Blair takes sixth place in the list, following his call for tactical voting to prevent either the Conservatives or Labour from gaining a parliamentary majority. Former Conservative Prime Minister Michael Heseltine’s decision to campaign for the Liberal Democrats helps him to a place in the Top 20.
- Although the Top 20 is largely made up of white men, the list also contains five women, five ethnic minority and two gay politicians.
Table 1.6: Top 5 Experts by prominence
| Wk 3 only | ||
|---|---|---|
| 1 | Institute for Fiscal Studies | 10.7 |
| 2 | Confederation of British Industry | 1.7 |
| 3 | British Chamber of Commerce | 1.0 |
| 4 | Institute of Directors | 1.0 |
| 5 | Institute of Economic Affairs | 1.0 |
Week 3 has seen various experts achieving high levels of media attention (Table 1.6). The most high-profile of these authorities has been the Institute for Fiscal Studies. IFS Director Paul Johnson has been more prominent than every campaigner in the Top 20 apart from Jeremy Corbyn and Boris Johnson. The CBI’s decision to host the three main UK wide party leaders at their conference ensured spokespeople such as Director-General Carolyn Fairbairn would have been the equivalent of 10th in the list. Representatives of three other groups and think tanks with an interest in economics and business would have also made the Top 20.
Section 2: The issue-agenda of the media campaign
Table 2 compares the prominence of all issues in TV and newspaper coverage across weeks 1, 2 and 3 of the formal campaign.
Table 2: Issues in week 1 – 3
| Week 1 | Week 2 | Week 3 | |
|---|---|---|---|
| % | % | % | |
| Arts/culture/sport | 0.0 | 0.0 | 0.1 |
| Business/economy/trade | 8.7 | 10.4 | 6.5 |
| Constitutional/legal/judicial issues | 1.1 | 0.9 | 0.3 |
| Standards/corruption/scandals/sleaze | 2.9 | 3.3 | 9.0 |
| Crime/law and order | 0.4 | 2.2 | 0.5 |
| Defence/military/security/terrorism | 3.8 | 1.9 | 0.8 |
| Education | 1.4 | 0.5 | 1.3 |
| Electoral process | 40.5 | 29.5 | 26.0 |
| Employment | 1.4 | 2.0 | 0.8 |
| Environment | 2.9 | 4.1 | 2.1 |
| Brexit | 16.2 | 12.7 | 11.0 |
| Other EU | 0.1 | 0.4 | 0.0 |
| Farming/agriculture | 0.2 | 0.4 | 0.1 |
| Other foreign policy | 0.1 | 0.1 | 0.4 |
| Media policy issues | 0.2 | 1.4 | 0.3 |
| Health and health care | 4.4 | 8.5 | 5.8 |
| Housing/ property issues | 0.2 | 0.6 | 2.4 |
| Local Government in UK | 0.4 | 0.2 | 0.0 |
| Scotland/Wales/NI | 2.0 | 2.5 | 2.4 |
| Public services | 3.0 | 2.1 | 6.0 |
| Immigration/border controls | 2.3 | 4.5 | 0.7 |
| Minorities/religion/sexuality | 1.8 | 1.9 | 7.2 |
| Social Security | 1.2 | 1.2 | 3.0 |
| Taxation | 2.7 | 6.9 | 10.6 |
| Transport | 0.5 | 0.6 | 1.2 |
| Women’s issues | 1.1 | 0.6 | 0.6 |
| Other | 0.2 | 0.6 | 0.6 |
Note: percentages = (number of appearance of an issue/ all issues *100)
Key findings
- The degree of emphasis on substantive issues has increased week by week during the campaign. While Electoral Process comprised 40 percent of all coded themes in the first week, it formed only 26 percent of election news issues during the third week of the campaign. The manifesto launches of the major parties have been a factor in this change.
- The decline in Brexit as the dominant substantive policy issue in coverage continues into week 3, reducing from 12.7 percent of all issues in week 2 to 11 percent.
- Accusations concerning anti-Semitism in the Labour Party and Islamophobia in the Conservative Party have contributed to a dual increase in both the ‘Standards/corruption/scandals/sleaze’ category (up to 9 percent) and the ‘Minorities/religion/sexuality’ category (7.2 percent).
- Elsewhere, scrutiny over the public spending claims in the Labour and Conservative party manifestos has seen a rise in the focus on Public Services (6 percent) and Taxation (10.6 percent). Smaller inclines have also occurred in relation to issues such as Housing (2.4 percent) and Social Security (3.0 percent).
- Health/healthcare provision and Business/economy/trade news both receded on the news agenda between the second and third week to 5.8 percent and 6.5 percent respectively.
- Finally, coverage of Environment issues halved to 2 percent of all coded themes. This may change in the aftermath of Thursday’s Channel 4 TV debate on climate change, but so far there is no sign that this is becoming the ‘climate election’ after all.
Section 3: 3. Media engagement with the campaign
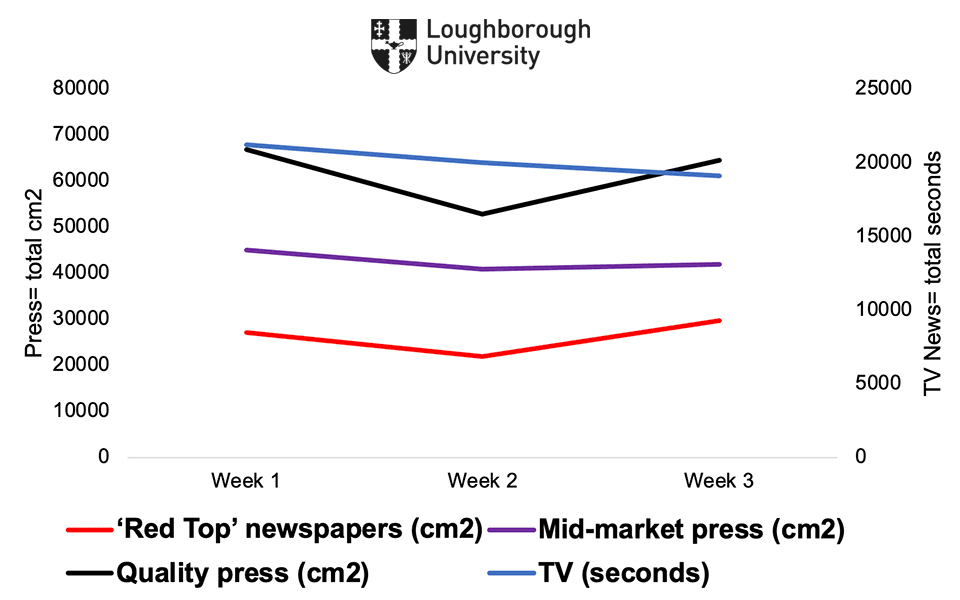
Figure 3 compares the amount of General Election coverage across the three weeks of the formal campaign. For TV news this is measured by the total number seconds of relevant coverage across all days and all channels. For the press, this is measured by the total cm2 of all written text and associated photographs in the newspaper sections sampled.
Figure 3: Media engagement with the campaign
Key findings
- The decline in the amount of newspaper coverage of the campaign noted in week 2 has reversed.
- ‘Quality’ newspaper coverage increased by 22 percent in week 3 to approach levels in the first week.
- ‘Red top’ newspaper coverage increased by 35 percent in week 3 and exceeded levels found in week 1.
- The levels of ‘mid-market’ newspaper engagement increased by 2.5 percent in week 3.
- By contrast, aggregate election coverage further reduced in TV news, reducing a further 5 percent in week 3.
Section 4: Gender divisions
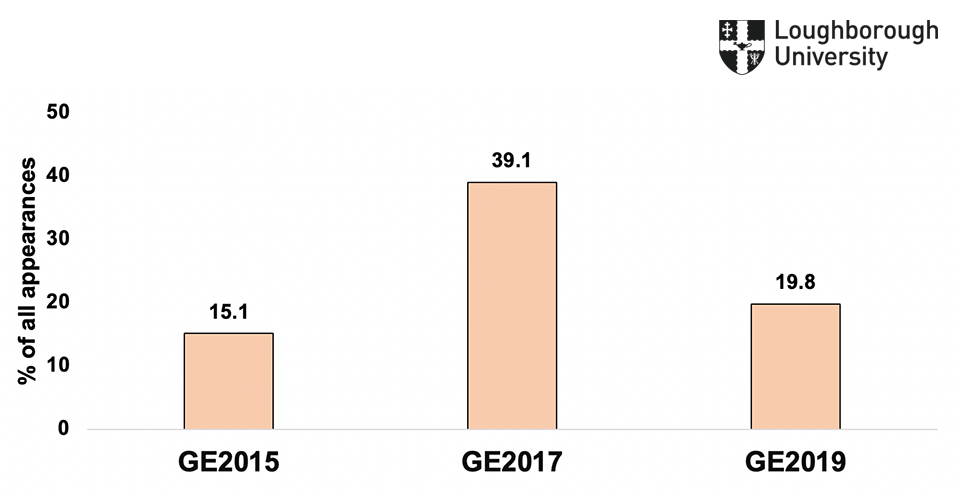
We continue to monitor gender diversity in the reporting of the campaign. Figure 4.1 compares the frequency of appearance of women political candidates and campaigners in the 2019 Election so far, with the levels identified in our previous studies of the 2015 and 2017 General Elections.
Figure 4.1: Women politicians in General Election news (2015, 2017 and 2019)
Key findings
- Women candidates/ campaigners have accounted for less than 1 in 5 of all politician appearances in the 2019 campaign so far.
- This presence is half of the levels achieved in the 2017 General Election.
- Current levels of female representation in 2019 amount to a 4.5 percent increase in the prominence of women campaigners in the 2015 General Election.
- The sharp reduction between 2017 and 2019 is explained entirely by the replacement of Theresa May as Prime Minister by Boris Johnson in the interim period. In 2017, Theresa May accounted for 18.6 percent of all politician appearances across the campaign.
- This demonstrates an important effect of the dominance of party leaders and their senior colleagues and the marginalisation of the smaller parties in Election news reporting (see sections 1 and 3). Improved gender equality in the composition of cabinets/ shadow cabinets and increases in the number of female candidates standing for election have little impact when coverage is so strongly ‘presidentialised’.
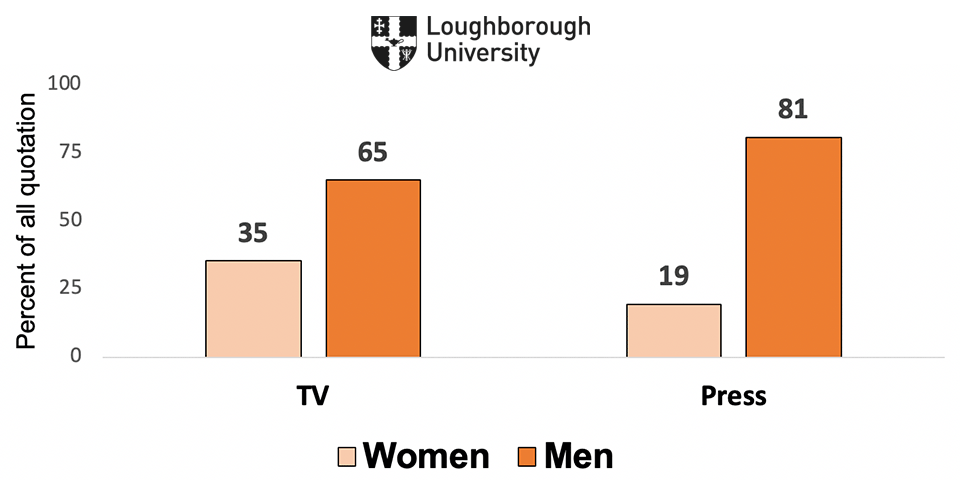
Figure 4.2 compares the ‘voice’ of women and men in the campaign by quantifying their direct quotation3 and the results extend beyond the party-political domain and include quotation of all accessed voices in coverage (e.g. citizens, academics, business representatives, trade unions, and so on).
Figure 4.2: Quotation given to women and men in 2019 Election news reporting
Key findings
- Men have been quoted 3 times as much as women in TV news to date.
- Men have quoted 5 times as much as women in newspaper coverage to date.
3Measured in words for newspapers and seconds for TV coverage.
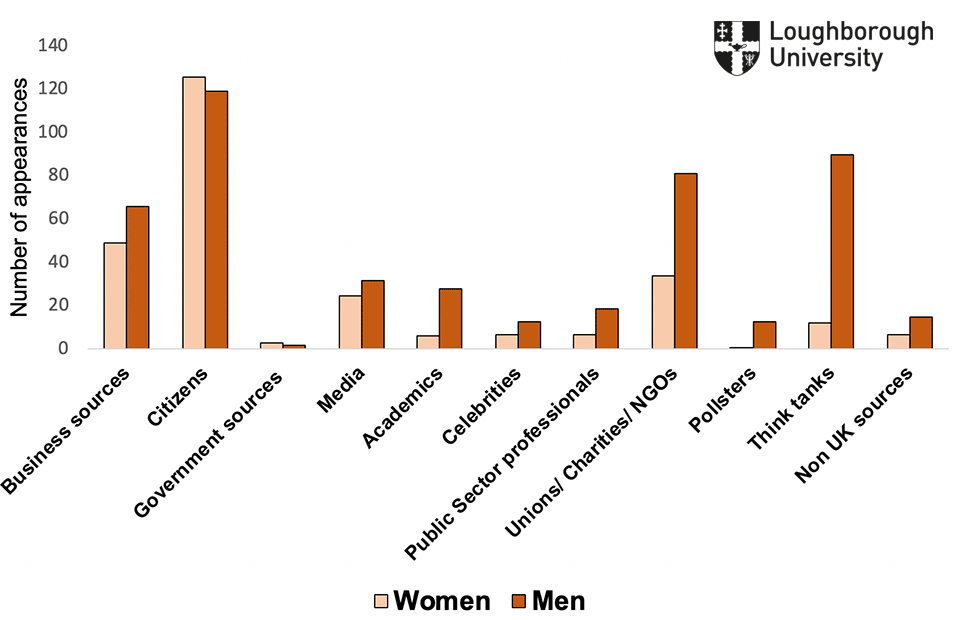
Figure 4.3 compares the frequency with which people outside of the party-political sphere were either featured as citizens or in a professional capacity.
Figure 4.3: non-party news sources and gender differences
Key findings
- Women featured slightly more frequently than men in the citizen category.
- In 10 out of the remaining 11 categories, male appearances exceeded female appearances. All of these relate to professional rather than personal roles.
- The one exception (‘government sources’) can be discounted as these sources have rarely featured.
- The gender disparity was greatest for ‘Think Tanks’, ‘Unions/ charities/NGOs’, ‘Public sector professionals’ ‘Academics’ and ‘Pollsters’.
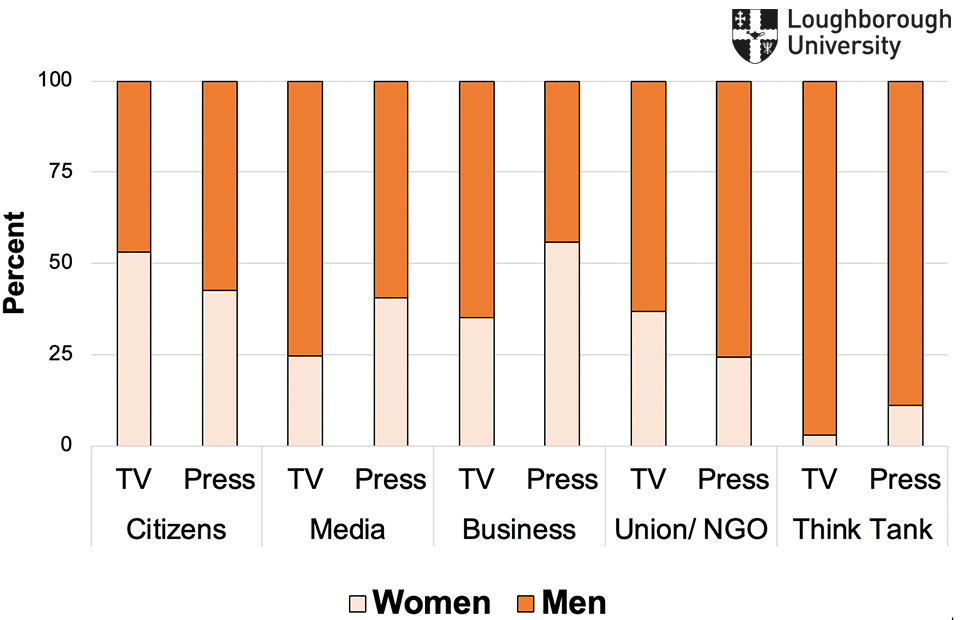
Figure 4.4 assesses the gender distribution of quotation within the four most prominent non-party political categories, differentiating between TV and newspaper coverage.
Figure 4.4: Direct quotation by gender and source type (%)
Key findings
- Women have been quoted more than men in only two categories (TV quotation of ‘Citizens’ and newspaper quotation of ‘Business’).
- The main reason for the female majority in press quotation of Business sources was the lengthy interview published in the Financial Times on 11 November with Carolyn Fairbairn, Director General of the Confederation of British Industries.
Section 5: Press evaluations
In this section we discuss the overall positivity or negativity of newspaper coverage. For each item we assessed whether the information or commentary contained within it had positive or negative implications for each political party4 .
Scoring
- Each party was separate rated in each election item.
- If an item mainly or solely focused on positive matters for a party, it was given a value of +1.
- If it mainly/ solely focused on negative matters for a party, it was assigned a value of -1.
- Items where there was (a) no clear evaluation, (b) contained positive and negative issues in broadly equal measure or (c) no mention of the party was made, were coded as zero.
- Items where no reference was made to the party were excluded from the calculation.
The scores in Figure 5.1 are calculated by subtracting the total number of negative stories from the total of positive stories for the 5 main parties for each of the three weeks of the campaign.
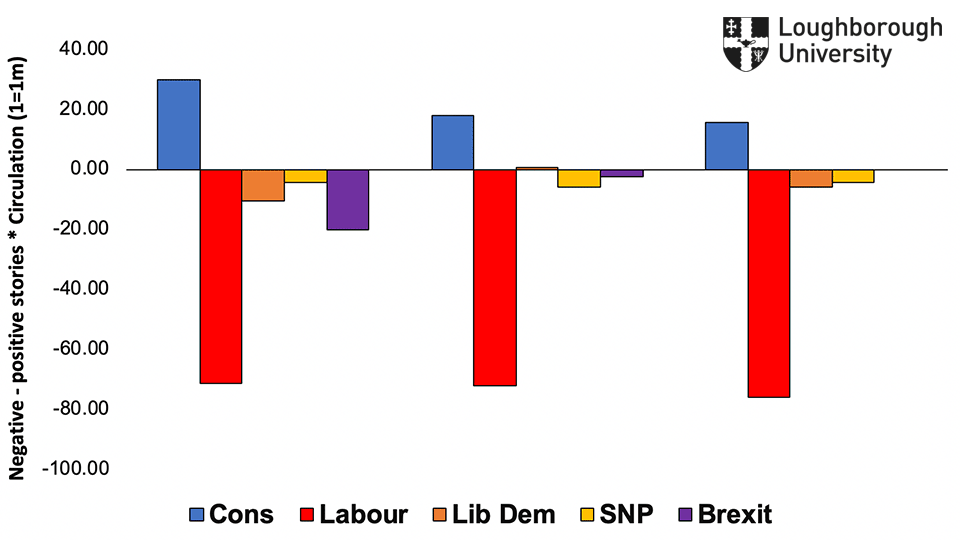
The scores in Figure 5.2 weight these figures by press circulations (where 1=1 million), using the same weekly division.
4This is not solely a measure of overt support or criticism by a journalist of a party (although these instances would be included in the count). It is a broader measure of the extent to which newspapers report on issues/ comments/ developments that have positive or negative implications for parties. We only coded these instances where these were overtly referred to in the piece.
Figure 5.1: Overall newspaper evaluations Weeks 1 - 3 (unweighted)
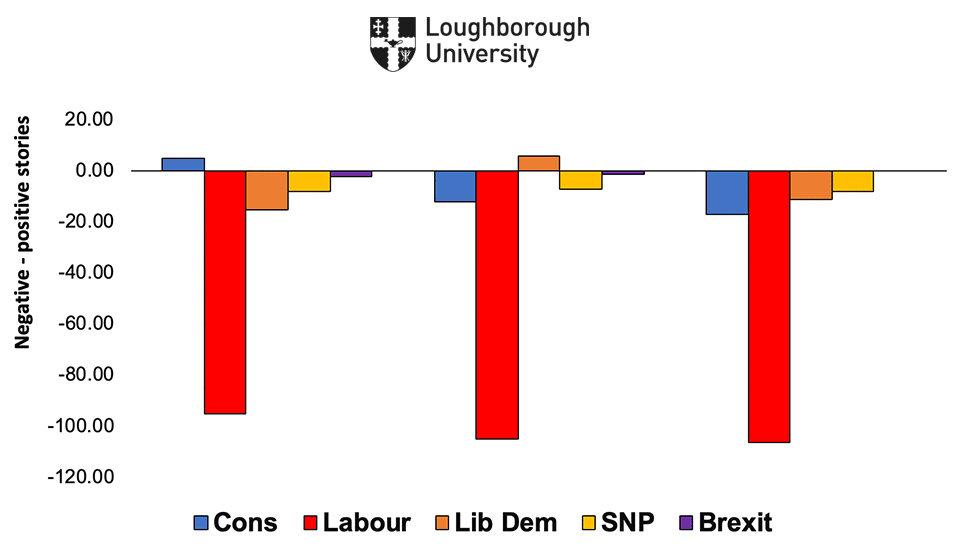
Figure 5.2: Overall newspaper evaluations Weeks 1 - 3 (weighted by circulation)
Key Findings
- The very negative initial press treatment of Labour identified in week 1 was sustained in week 2 and increased in week 3.
- Press evaluations of the Conservatives have become slightly less positive, producing a negative result overall in weeks 2 and 3 when coverage is unweighted.
- When coverage is weighted by circulation, the Conservatives’ overall evaluations move into the positive for all 3 weeks. However, levels of positivity are at lower levels in later weeks.
- All the minor parties fluctuate at or just below the ‘break even’ line. These results need to be interpreted in the light of the distributions outlined in Section 1, which show the two main parties have squeezed coverage of the minor parties. They are not being evaluated because they are increasingly struggling to gain coverage.