Report 1 7 November – 13 November 2019
This is the first in a series of weekly reports from the Centre for Research in Communication and Culture, Loughborough University on UK wide television and print media reporting of the 2019 UK General Election. These reports will be published weekly throughout the campaign.
Report authors
David Deacon, Jackie Goode, David Smith, Dominic Wring, John Downey, Cristian Vaccari
This report examines:
- The visibility and speaking time of political parties and other organizations and individuals involved in the election
- The most frequently reported campaigners
- The gender balance of coverage
- The dominant issues during the first week of the formal campaign
- The positivity and negativity of press reporting of the main parties
The results in this report are drawn from a detailed content analysis of election coverage produced on the weekdays (i.e. Monday to Friday inclusive) between 7th and 13th November. The media sampled were:
- Television: Channel 4 News (7pm), Channel 5 News (6.30pm), BBC1 News at 10, ITV1 News at 10, Sky News (10pm)
- Press: The Guardian, The I, The Daily Telegraph, The Times, The Financial Times, The Daily Mail, The Daily Express, The Mirror, The Sun, The Star
All election-related news items in the television programmes were analysed. For the press, all election news found on the front page, the first two pages of the domestic news section, the first two pages of any specialist election section and the page containing and facing the papers’ leader editorials were coded. Read about the methodology of the study. Intercoder reliability tests were conducted on all key variables and are ongoing.
Grateful thanks to our coding team: Eleanor Beestin, Jack Joyce, Gabriel Knott-Fayle Sarah Lewis, Han Newman, Dayei Oh, Nathan Ritchie, Louise Tompkins and Yingzi Wang.
Executive summary
The Conservatives and Labour are the clear and only major parties in media terms. Leaders Boris Johnson and Jeremy Corbyn were the two most prominent campaigners overall, the Prime Minister achieving a particularly high profile on television.
Both their parties’ each received approximately a third of TV coverage although Labour spokespeople were more likely to be quoted on air. The two parties were also prominent in print reporting with Labour attracting two-fifths of press coverage. There was parity in the amount of newspaper quotations from spokespeople belonging to both parties. Particularly prominent here were Sajid Javid and John McDonnell, reflecting the prominence of the economy as the third-place issue in the campaign. Coverage levels of McDonnell exceeded that of Javid in press and TV.
The Liberal Democrats were a clear third in respect of their share of approximately an eighth of all TV reporting. The party and Jo Swinson’s newspaper presence coverage was far less, failing to match the news presence of the Brexit Party. The latter, and its ‘pact’ with Boris Johnson, ensured it also received more coverage than the SNP in both TV and in the print media. Brexit Party spokespeople were more likely to be quoted in print than on television. The SNP received some TV attention but gained little print coverage and if a representative was quoted it was almost certain to be leader Nicola Sturgeon. This helped make the Scottish First Minister the most prominent women campaigner although she was one of only 5 female representatives in the Top 20 overall. The Greens, Plaid Cymru, DUP and other parties were negligible be it on TV or in print.
Disaffected former Labour and, to a lesser extent, Conservative politicians received some news prominence. Comments from the ex-Labour ministers Ian Austin and John Woodcock that urged voters to support Boris Johnson were quoted in the press almost as frequently as those from spokespeople belonging to a Brexit Party preoccupied with whether and how their candidates would intervene in the election. This scenario together with their core rationale of wanting to leave the European Union helped ensure that Electoral Process and Brexit were respectively the first and second most prominent issues. The significance of the former was also boosted following the unexpected resignations of Alun Cairns from the Cabinet and Tom Watson as Deputy Labour Leader, which helped ensure they both made the Top 20 campaigners. Jacob Rees-Mogg’s presence in the top 20 was largely a result of his controversial comments about Grenfell. He may well fall out of the chart in the coming weeks.
The marginalisation of Jo Swinson and Nicola Sturgeon was emblematic of a wider gender inequality across all coverage. When considering all participants in election news coverage (i.e. including citizens, businesspeople, experts, public professionals, etc.) women’s voices accounted for just a third of all quotation in TV news and a fifth of quotation in the national press.
Recent and potential changes in the ownership and editorship of several national newspapers invites speculation as to their impact on the strength of press partisanship in this campaign. The results from the first formal week of the campaign suggest that it is ‘business as usual’. Only the Conservative party attracted more positive than negative press coverage, which is boosted when weighted for circulation. Labour have had a higher newspaper presence than the Conservatives over this period, but a substantial element of this involved negative reporting of the party and its policies.
Section 1: News presence and news access of political parties
Figure 1.1 compares the news presence1 of the political parties on TV news during the weekday coverage between 7 and 13 November inclusive. Figure 1.2 provides the same comparison for press coverage.
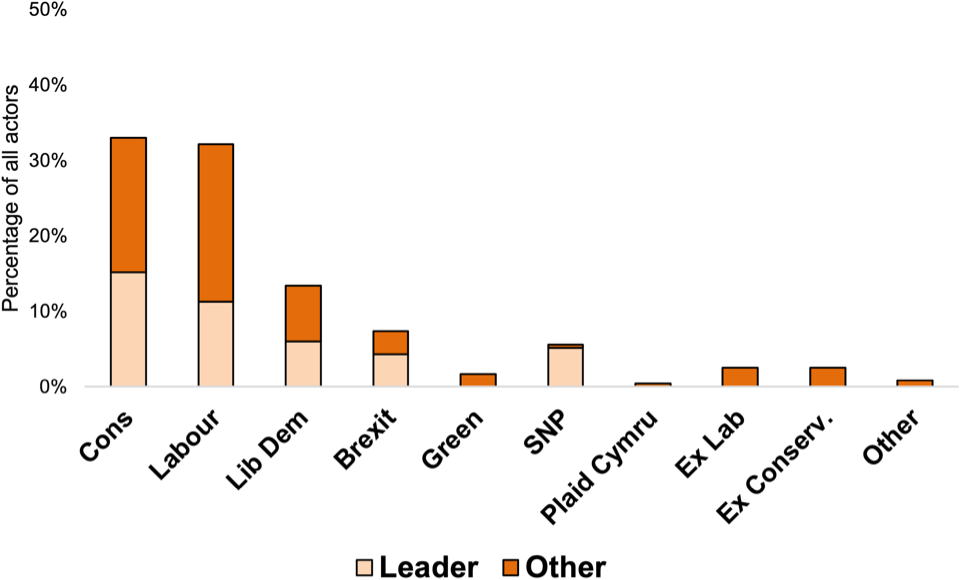
Figure 1.1: News presence of parties in TV news (7 - 13 November)
1 To be coded as ‘present’ a political representative needed to have an active role within the item. They could be counted even if they were not quoted, but there had to be a clear and substantial attribution to them of a speech act or action. Up to 5 politicians could be coded per item.
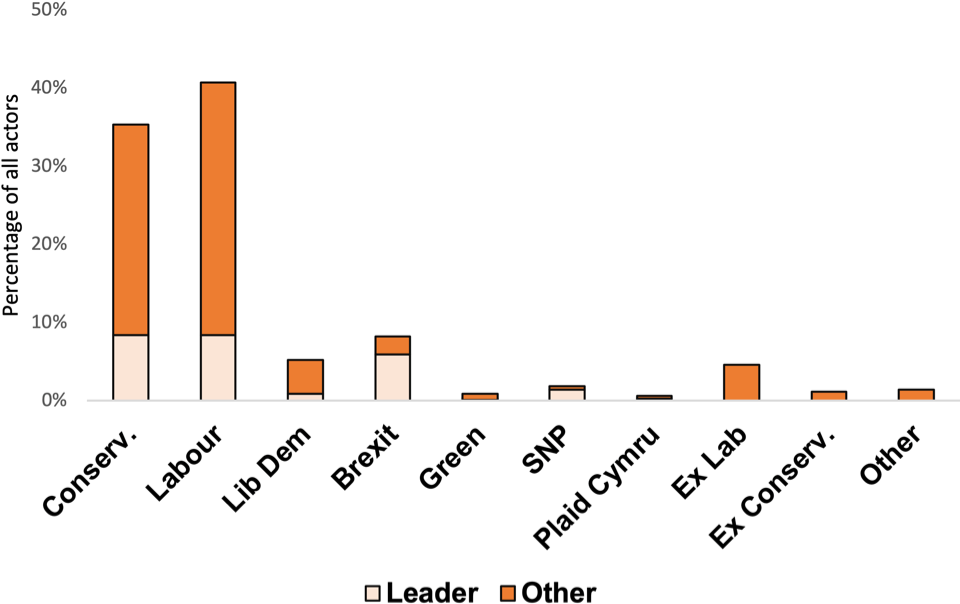
Figure 1.2: News presence of parties in national newspapers (7 - 13 November)
Key findings
- TV coverage of the Conservative party and Labour was close to parity (33 percent versus 32 percent). The Liberal Democrats were a prominent third presence, accounting for 13 percent of all appearances. The Brexit party and SNP also established footholds (7 percent and 5 percent, respectively). Ex-Labour and ex-Conservative MPs also featured at the margins (3 percent of cases each).
- The two main parties dominated newspaper coverage, with Labour accounting for 40 percent of appearances and the Conservatives 35 percent. As later findings show, the greater prominence of Labour sources cannot be construed as a positive advantage for the party (see Figure 5.1).
- The Brexit party was the third most prominently featured party in the press (8 percent of all appearances). Nigel Farage accounted for most of these appearances.
- The Liberal Democrats accounted for 5 percent of all appearances, with Jo Swinson barely registering in the press (see also Table 2.2).
- Ex-Labour politicians received more press coverage than ex-Conservative politicians (5 percent to 1 percent).
- Other national and minor parties gained negligible press coverage in the first week of the campaign.
- Conservative party sources gained greatest prominence in TV and press coverage in terms of the frequency of their appearances.
- The two main political parties dominated press coverage to a greater extent than in TV news. In the press, Conservative and Labour sources accounted for 84 percent of all politicians reported. On TV news they accounted for 67 percent of all political appearances.
- No representatives from the Democratic Union Party gained sufficient prominence in coverage to be included in this account.
Figure 1.3 and Figure 1.4 compare the news access of the political parties and their leaders by measuring the amount of direct quotation of politicians in coverage (for TV this was measured in seconds, for newspaper coverage this was measured in words).
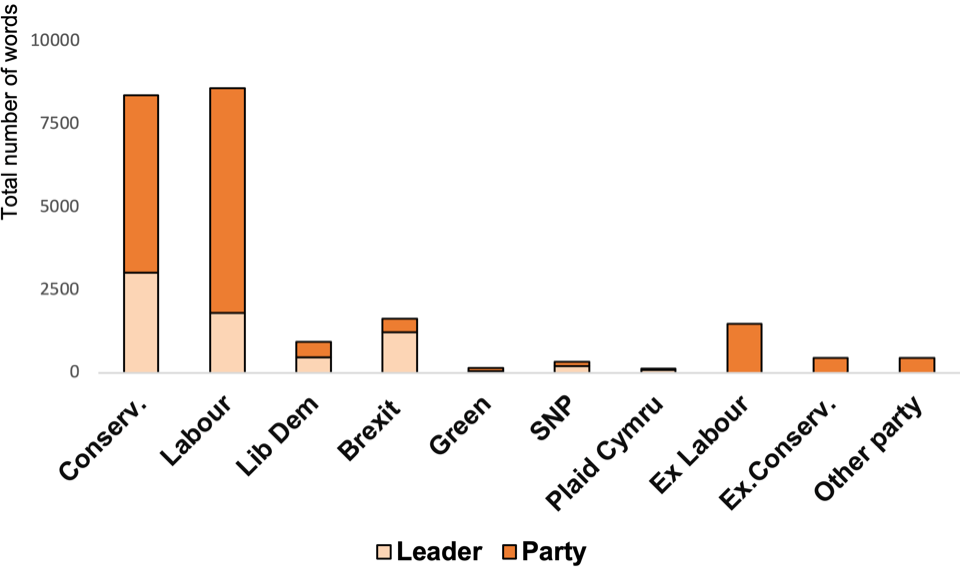
Figure 1.3: News access of parties measured by direct quotation (TV News: 7 - 13 November)

Figure 1.4: News access of parties measured by direct quotation (National press: 7 -13 November)
Key findings
- Labour received more direct access in TV news than the Conservatives but both parties were nearly equivalent in direct press quotation.
- The two main parties accounted for 60 percent of all direct quotation in TV news and 75 percent of all quotation in newspaper coverage.
- Smaller parties received little direct quotation in newspaper coverage. Of these, Nigel Farage and the Brexit Party received most direct quotation in the press (1629 words), but ex-Labour MPs nearly matched this figure (1469 words).
- Ex-Conservative MPs received slightly more quotation time in TV news than Ex-Labour MPs (413 seconds compared to 236 seconds).
- Nicola Sturgeon accounted for 98 percent of all SNP direct quotation in TV news.
Section 2: Most prominent political figures in the media campaign
Table 2.1: Top 20 Individuals in TV and Newspapers
Lists the most prominent individuals in the reporting of the first week of the formal campaign.
| TV | Press | Total | ||
|---|---|---|---|---|
| % | % | % | ||
| 1 | Boris Johnson | 30.4 | 17.4 | 20.8 |
| 2 | Jeremy Corbyn | 22.6 | 17.4 | 18.8 |
| 3 | John McDonnell | 13.9 | 13.5 | 13.6 |
| 4 | Nigel Farage | 8.7 | 12.3 | 11.4 |
| 5 | Sajid Javid | 8.7 | 9.0 | 8.9 |
| 6 | Ian Austin | 4.3 | 6.0 | 5.6 |
| 7 | Nicola Sturgeon | 10.4 | 3.0 | 4.9 |
| 8 | Jo Swinson | 12.2 | 1.8 | 4.5 |
| 9 | Tom Watson | 1.7 | 3.0 | 2.7 |
| 10 | Arron Banks | - | 3.6 | 2.7 |
| 11 | Jonathan Ashworth | 3.5 | 2.1 | 2.5 |
| 12 | Andrew Gwynne | - | 3.3 | 2.5 |
| 13 | Jacob Rees-Mogg | 0.9 | 2.7 | 2.2 |
| 14 | John Woodcock | 0.9 | 2.7 | 2.2 |
| 15 | Angela Rayner | - | 2.7 | 2.0 |
| 16 | Alun Cairns | - | 2.4 | 1.8 |
| 17 | Keir Starmer | 3.5 | 1.2 | 1.8 |
| 18 | Emily Thornberry | 0.9 | 2.1 | 1.8 |
| 19 | James Cleverly | - | 2.1 | 1.6 |
| 20 | Priti Patel | 0.9 | 1.8 | 1.6 |
Notes: Percentages = individual's appearance / total number of items * 100.
Key findings
- Boris Johnson and Jeremy Corbyn were the most prominent politicians during the opening stage of the campaign.
- Coverage of John McDonnell, the Shadow Chancellor exceeded that of Sajid Javid, the incumbent Chancellor, in both TV and newspaper coverage. The presence of both in the Top 5 reflected the significance of the economic debate in the first week of the formal campaign.
- Nigel Farage received notable coverage due to the speculation over whether and where he and his Brexit Party colleagues would stand in the election. The nature of his subsequent ‘pact’ with Boris Johnson generated further publicity, notably in a Tory press that echoed further calls by Mr Farage’s pro-Leave ally Aaron Banks (another Top 10 figure) for him not to contest key marginal seats that the Conservatives might win.
- Former Labour minister and MP Ian Austin was the 6th most prominent campaigner following his criticism of Jeremy Corbyn over his leadership and antisemitism. Supporting Mr Austin’s comments, his close ally John Woodcock made the Top 20.
- Although leaders such as Nicola Sturgeon and Jo Swinson are in 7th and 8th place respectively there were only 5 female campaigners in the Top 20 most prominent figures. Nicola Sturgeon and Jo Swinson were conspicuously marginalised in newspaper coverage.
- The sudden resignations of Tom Watson and Alun Cairns from the Shadow Cabinet and Cabinet respectively afforded them places in the Top 20
- Several campaigners appeared in the Top 20 because of the controversy that followed widely publicised comments. A notable example of this was the coverage devoted to Jacob Rees-Mogg over his comments about the Grenfell disaster.
Section 3: The Gender Balance in news coverage
Tables 3.1 and 3.2 show the prominence of women and men in coverage. These measures extend beyond the party-political domain to include other participants in election news (e.g. citizens, experts, pollsters, business-people, trades union representatives etc).
Table 3.1: News Presence of women and men in coverage
| TV | Press |
Overall | |
|---|---|---|---|
| Women | 32.5% | 20.1% | 23.9% |
| Men | 67.5% | 79.9% | 76.1% |
Percentage is calculated as the sum of all female/male actor appearances in each media sector category (TV vs Press), divided by the total number of actor appearances of both combined. Up to five actors could be coded per item.
Table 3.2: News Access of women and men in coverage
| TV | Press | Overall | |
|---|---|---|---|
| Women | 32.9% | 18.1% | 21.4% |
| Men | 67.1% | 81.9% | 78.6% |
For TV, news access is measured in seconds of direct quotation. For Press, news access is measured in words of direct quotation.
Key findings
- The data show that female actors are marginalised in cumulative terms in comparison with their male counterparts during the election campaign so far.
- This gender imbalance is evident in both news presence and news access.
- Men spoke three times as much as women in TV news and 5 times as much in newspaper coverage.
Section 4: The top issues in the media campaign
Table 4.1: Top issues
Table 4.1 outlines the main issues of the campaign so far across TV and press outlets, as well as overall.
| TV | Press | Overall | ||
|---|---|---|---|---|
| % | % | % | ||
| 1 | Electoral process | 35.0 | 42.2 | 40.4 |
| 2 | Brexit | 22.4 | 14.2 | 16.3 |
| 3 | Economy / business / trade | 6.5 | 9.4 | 8.7 |
| 4 | Health and health care provision | 4.7 | 4.7 | 4.7 |
| 5 | Defence/Military/Security | 1.4 | 4.4 | 3.6 |
| 6 | Environment | 6.5 | 1.9 | 3.1 |
| 7 | Public services | 3.7 | 2.8 | 3.0 |
| 8 | Standards | 1.9 | 3.2 | 2.9 |
| 9 | Taxation | 0.5 | 3.4 | 2.6 |
| 10 | Immigration | 1.4 | 2.6 | 2.3 |
| 11 | Devolution | 6.1 | 0.8 | 2.2 |
| 12 | Minorities / religion / sexuality | 2.8 | 1.5 | 1.8 |
| 13 | Employment | 1.4 | 1.5 | 1.4 |
| 14 | Education | 0.9 | 1.5 | 1.3 |
| Other issues | 4.7 | 6.0 | 5.6 |
Notes: Percentages=(frequency of issue/total number of issues coded)*100. A maximum of 3 issue responses could be coded per item. To be coded, an issue needed to occupy more than 10 seconds of TV coverage or 2 sentences. The most prominent issues were coded when more than three were present.
Key findings
- Discussion of the drama, rituals and uncertainties of the election itself dominated the campaign in the first week, particularly in the press (see ‘Electoral process’). This is consistent with patterns found in previous UK election coverage and is commensurate with overall figures of 38.1 percent and 40.6 percent of process coverage at this point of the 2017 and 2015 campaigns respectively.
- Brexit was the most prominent policy-oriented issue of the campaign during the first week. We disaggregate this category in the discussion below.
- News concerning the Economy, Business and Trade was the second most prominent substantive issue category. The other major issue of the 2016 Brexit referendum campaign, Immigration, was less prominent in these early stages.
- Coverage focusing on the Environment was far more prominent in TV news than press coverage. This has been largely driven by serious incidences of flooding across the country, which stimulated wider discussion of the adequacy of politicians’ responses to the crisis.
- Devolution was relatively prominent in TV coverage, almost matching Economy/Business/Trade and Environment, but was largely neglected in the press.
Table 4.2: Electoral process issues
Table 4.2 breaks the electoral process issue down into sub-categories.
| TV | Press | Overall | |
|---|---|---|---|
| % | % | % | |
| Tactical voting / party pacts | 30.7 | 25.7 | 26.8 |
| Internal party divisions | 10.7 | 17.2 | 15.8 |
| Manipulation, disinformation, and other threats to electoral integrity | 6.7 | 8.4 | 8.0 |
| Role of social media | 5.3 | 2.3 | 3.0 |
| Toxicity/incivility/tone of political debate | 1.3 | 2.3 | 2.1 |
| Role of mainstream media | 1.3 | 1.9 | 1.8 |
| All other process issues | 44.0 | 42.1 | 42.6 |
Notes: Only one process theme could be coded per item.
Key findings
- The largest single category of electoral process sub-themes is ‘tactical voting/party pacts’, which reflects the announcement of various alliances between political parties during the week and speculation about the potential tactical behaviour of voters.
- Intra-party divisions are also relatively prominent, particularly in the press.
- Discussion about ‘manipulation, disinformation, and other threats to electoral integrity’ received some prominence in press and TV coverage, stimulated in the main by the decision to delay publication of the report by Parliament's Intelligence and Security Committee on Russian activity in UK democracy until after the election.
Table 4.3: Brexit issues
Table 4.3 breaks the Brexit theme down into a variety of sub-issues.
| TV | Press | Overall | |
|---|---|---|---|
| Brexit strategies and alternatives | 58.3 | 71.6 | 66.9 |
| Brexit and public opinion | 18.8 | 11.4 | 14.0 |
| Actual or likely impact of Brexit | 22.9 | 5.7 | 11.8 |
| History of Brexit | 0.0 | 10.2 | 6.6 |
| Brexit other | 0.0 | 1.1 | 0.7 |
Notes: Only one Brexit theme could be coded per item.
Key findings
- By far the biggest Brexit sub-issue relates to ‘party strategies and alternatives’ related to Brexit, at well over half in TV news and almost three-quarters of Brexit coverage in the press.
- In contrast, discussion of public opinion concerning Brexit has been relatively low.
- The potential impact of Brexit has received more prominent discuss in TV news than in the press.
Section 5: Positive and negative treatment of the political parties in the press
In this section we discuss the overall positivity or negativity of newspaper coverage. For each item we assessed whether the information or commentary contained within it had positive or negative implications for each political party2.
Scoring
- If an item mainly or solely focused on positive matters for a party, it was given a value of +1.
- If it mainly/ solely focused on negative matters for a party, it was assigned a value of -1.
- Items where there was (a) no clear evaluation, (b) contained positive and negative issues in broadly equal measure or (c) no mention of the party was made, were coded as zero.
- Items where no reference was made to the party were excluded from the calculation.
The scores in Figure 5.1 are calculated by subtracting the total number of negative stories from the total of positive stories for the 5 main parties.
The scores in Figure 5.2 weight these figures by press circulations (where 1=1 million).
2 This is not solely a measure of overt support or criticism by a journalist of a party (although these instances would be included in the count). It is a broader measure of the extent to which newspapers report on issues/ comments/ developments that have positive or negative implications for parties. We only coded these instances where these were overtly referred to in the piece.
Figure 5.1: Overall evaluations in newspapers (unweighted)
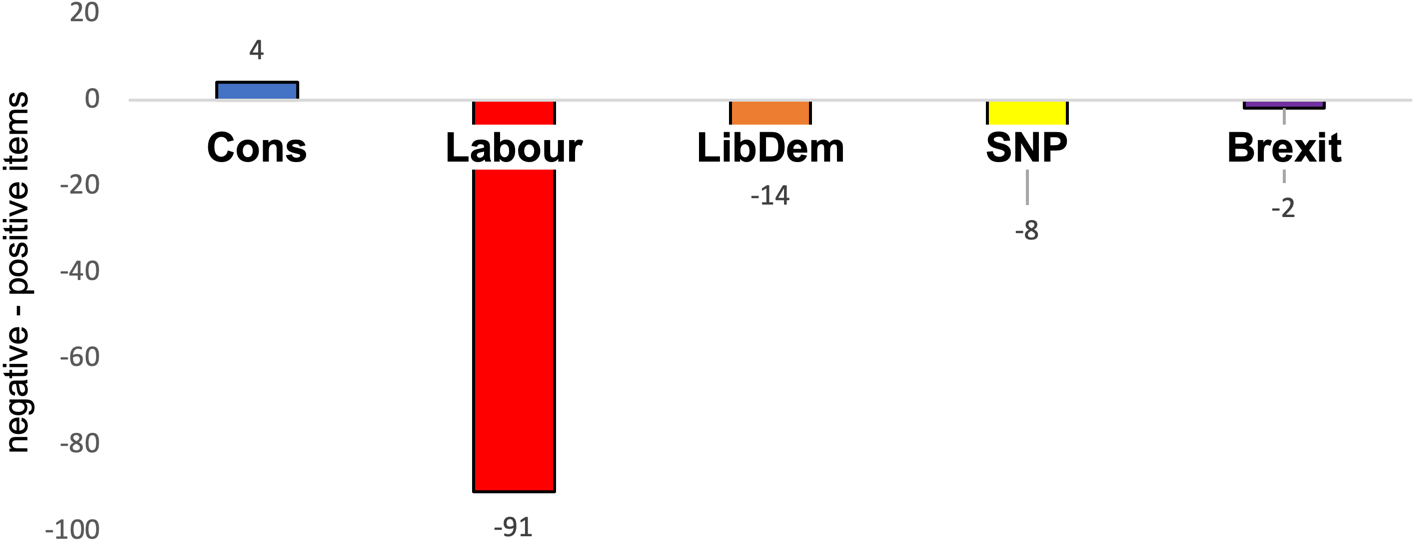
Figure 5.2: Overall evaluations in newspapers (weighted by circulation)
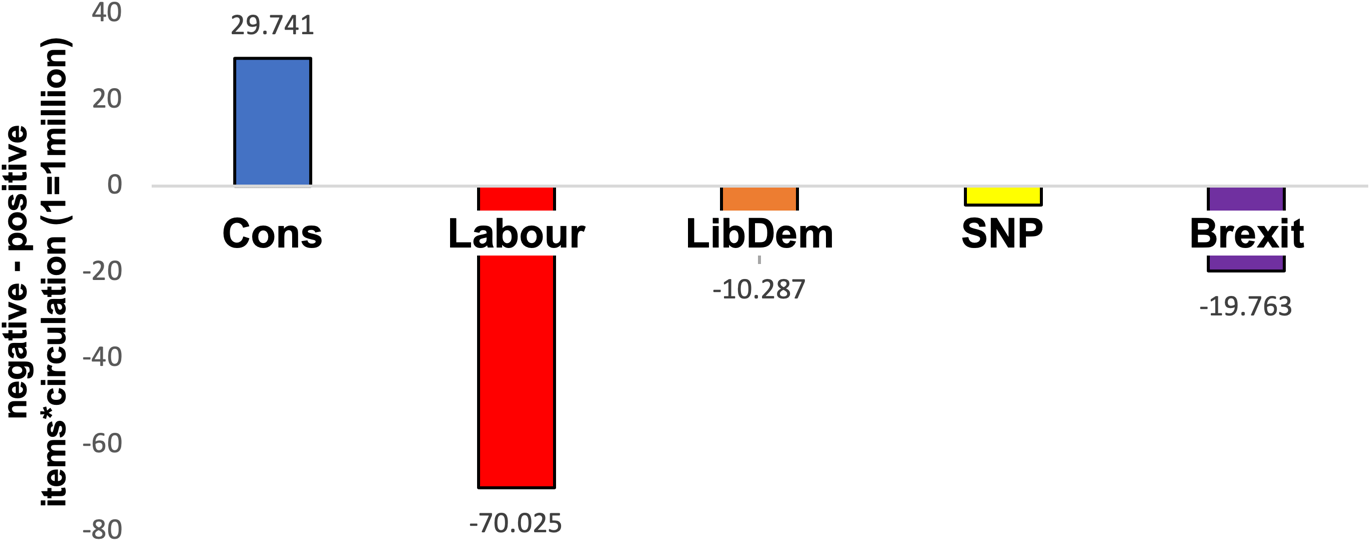
Key findings
- The unweighted results show that only the Conservative party received more positive than negative coverage across all newspapers.
- The increase in positive Conservative evaluation in the weighted data (Figure 5.2) reflects the strong editorial support provided by the newspapers with the largest circulation (the Daily Mail and the Sun).
- In contrast, Labour had a substantial deficit of positive to negative news reports in the first formal week of the campaign. This offers important context to the findings presented in Figure 1.2. Labour politicians may have had more coverage in the national press than the Conservatives, but a large proportion of this was negative.
- The minimal deficits for the Liberal Democrats and SNP largely reflected their marginality in newspaper coverage (see Figure 1.2).
- The increased deficit in negative coverage of the Brexit party in the weighted data reflects the impact of negative coverage in the Daily Mail and The Sun.