GaWC Research Bulletin 76 |
|
|
|
This Research Bulletin has been published in The Professional Geographer, 56 (2), (2004), 295-302.
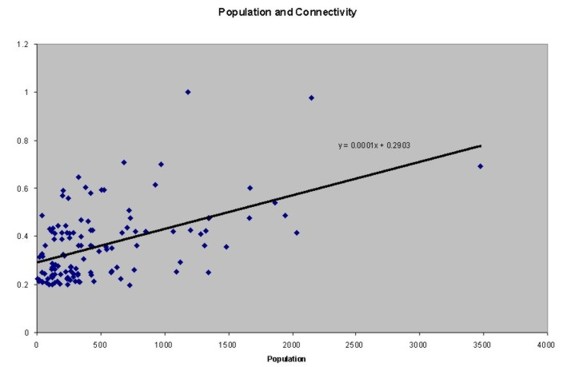
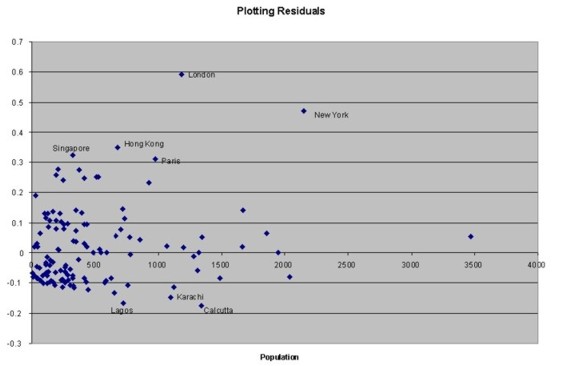
INTRODUCTIONGlobalization is an uneven process. Places are connected in different ways at varying rates. While much of the recent literature has focussed on measuring the converging points of globalization, I want to flip the viewpoint and focus on identifying places that seem to be bypassed by at least some of the more advanced forms of economic globalization. Following on from the early work of Hall (1984) and Sassen (1991), there has been substantial work on the notion of world cities. They have been theorized as the command centers of the global economy, vital hubs in the flows of goods, people and ideas. However, there are three problem areas in this research area. The first is that work is limited by what Short et al (1996) refer to as the dirty little secret of world cities research, which is the lack of good quality, comparable, international urban data. The data deficiencies inhibit sound theorizing. Second, the search for world cityness in a range of cities has bent the research work towards the top end of the urban hierarchy and often limited the discussion of the connections between cities and globalization to a search for only a narrow range of world city functions. Our understanding of the connections between globalization and the city has become biased towards only looking for the urban impacts of globalization in the big world cities. Short et al (2000) have suggested looking at the role of all cities as gateways for globalization rather than restricting the analysis to the search for world cities. A city can still be actively involved in global flows yet not be designated as a world city. The designation, in effect, refers only to the command and control functions of the global economy. Yet, a city can still be an integral part of the global system as a producer of global goods and services, as a marketplace for global good and services and as a hub in the flow of people, remittances, finance and ideas. Because a city is not designated as a world city, does not imply a lack of global connections. Third, the research has concentrated on searching for evidence of global connectivity. But, while it is important to identify world cities, it is also important to identify the lack of connectivity. Silences are as interesting as utterances. They tell us much about the process of globalization. In this paper, preliminary data analysis is presented to identify the black holes and loose connections of the global urban hierarchy. BLACK HOLESThe very largest cities in the world are also some of the most globalized. However, not all large cities are world cities (Taylor 1999). To identify very large, non-world cities two data sets were combined. The first is the population figures for major agglomerations made available in Brinkhoff (2001) who provides the most accessible and up to date population figures for urban agglomerations around the world ranked by population size. The largest is Tokyo with a population of 34 million, followed by New York at 21.5 million and Seoul at 20. 4 million. Population figures for metropolitan areas are notoriously suspect. Identifying the functioning urban region, as opposed to the formal jurisdiction, is a difficult matter. Moreover, national differences in definition make it difficult to compare population figures for cities in different countries. The fact that the 'Brinkhoff' population figures are all round numbers, the figures for Los Angeles, USA and Mumbai, India, for example, are rounded to 16, 700, 000 and 16, 650, 000 respectively, also give pause for thought. Aesthetically pleasing perhaps, but not indicative of refined precision. The figures should be used cautiously; not ideal, but the best we have. This population data for individual cities was compared to the data on cities produced by the Globalization and World Cities (GAWC) Research group (GAWC, 2002). To identify a world city network they looked at the distribution of advanced producer services across a range of cities (Taylor, 2001). They generated a data matrix of 316 cities and 100 firms in accountancy, advertising, banking/insurance, law, and management consultancy. They identified firms with at least 15 identifiable separate offices. They identified connectivity between the 316 cities. Those that had at least one fifth of the connectivity of the most connected city, which was London, were identified as world cities. A total of 123 world cities were identified (see Taylor et al, 2001 who build upon the earlier 55 city network used in Beaverstock et al, 1999). Again, the data are not ideal, they rarely are in the messy world of social observation and social processes, but they provide us with one of the most sophisticated world city networks produced to date. There is clearly an overlap between big cities and the GAWC world cities. The 20 largest cities cited by Brinkoff also make the GAWC listing. Tokyo, New York, Seoul, Mexico City, Osaka and Los Angeles, to name just the largest seven cities, are also world cities. Some cities are not world cities because they are too small. Advanced producer services require a significant threshold population size. Clearly then, some cities do not make the GAWC list simply because they are too small. To reduce this size effect, Table 1 lists only those cities that fulfilled two criteria; they had a population of more than 3 million and are not on the GAWC list. The population figure is arbitrary and different results would be produced if a different threshold were used. But, for the moment, it provides a significantly large threshold for a reasonable definition of big cities. Table 1 lists 35 cities that meet the population threshold figure and are not GAWC world cities. In large measure they represent what we can term third world urbanization: All of the cities are located in low and low- middle-income economies, as defined by the World Bank (2002). A large city may not be a world city because it is sharing a national space with one or more cities that do act as a gateway point to global connections. Nagoya and Alexandria are large cities without world city status that are in a national urban system that do, respectively, Tokyo and Cairo. The data in Table 1 were filtered by removing those cities that were in national urban systems where at least one other city was identified as a world city in the GAWC study. Table 2 is the result. Eleven cities were identified which met three criteria: they had a population of over 3 million, were not identified by GAWC as a world city and did not share their national territory with a world city. They ranged from Tehran with a population of 10.7 million to Chittagong with a population of 3.1 million. There are a number of reasons behind these very large cities' non-world status. I will posit four: poverty, collapse, exclusion and resistance, see Table 3. In large measure non-world status reflects poverty. Some cities, despite their size are so poor that they do not represent a market for advanced producer services. They are the black holes of advanced global capitalism with many people but not enough affluent consumers or sophisticated industries to support sophisticated producer services. Approximately 8 of the 11 cities in Table 2 are located in low-income countries, and 3 (Tehran, Baghdad and Algiers) are in the low medium category as defined by the World Bank. These cities are in some of the poorest countries in the world. Dhaka and Chittagong are in Bangladesh, a country where the gross national income per capita was $370 in 2000; the world average is $5,240. Many of the city's population are poor, living on the margins. These cities lack a significant (consuming) middle class and an advanced urban economy. Not requiring the services of global producer service firms they are excluded from world city status. It is not legitimate to write of urbanization without globalization, since all cities partake in some form of global connections. Urbanization with only basic economic globalization is perhaps a more accurate term. There are cases of not only endemic poverty but also cases of catastrophic decline where there has been an almost complete collapse of civil society. In recent years, Khartoum and Kinshasa, for example have witnessed the decline of the rule of law and social anarchy. War and social unrest have been the norm rather than the exception. These two cities represent cities that have internally collapsed for all intents and purposes and have been abandoned or bypassed by global capitalism. Sustained social disruption reinforces the global disconnect. Poverty and social anarchy do not explain all the cases. Some cities are bypassed. Such global exclusion is partly a function of national ideologies. Tehran and Pyongyang, for example are cities where national ideologies have not encouraged global economic connections to the advanced capitalist economies. Fundamentalist beliefs, of a religious and political nature, have sought to resist the encroachment of a global capitalist, because of the fear of secular beliefs in the case of Iran and capitalist hegemony in the case of North Korea. However, cities that have severed themselves from economic globalization often find it difficult to resist the pervasive influence of cultural globalization, especially amongst the young. In the summer of 2001 it was possible to see graffiti on the walls of public buildings in Tehran, in English, lauding Madonna. Baghdad is an example of direct exclusion from the global economy. The city and the country have been subject to economic sanctions by much of the world since the 1990s. Although the sanctions are widely breached in the primary sector of oil exports, at the tertiary and quaternary sector they are having a marked effect on global connections. Theorisation of the black holes is only at a primitive stage. Table 3 lists four ideal types of large, non-world cities: the poor city, the collapsed city, the excluded city and the resisting city. The table lists some exemplars. There are clearly connections between these four types and in reality most of the cities listed in Table 3 have elements of all four in differing proportions. Social collapse tends to occur more easily in very poor cities, collapse can often induce anti-capitalist ideologies that not so much inhibit global connections as justify the lack of them. The interconnections between the four types are indicated in the table by the repetition of certain cities. Thus Kinshasa and Khartoum appears as both a poor and collapsed city, while Baghdad is listed as both an excluded and a resisting city. Most of the cities exhibit characteristics of each of the ideal types. LOOSE CONNECTIONSCities are connected in varying degrees to the rest of the global urban network. We can use the GAWC connectivity data along with population data to measure a city's degree of connectivity. Taylor et al (2001) calculated a connectivity value for each of their 123 world cities based on their producer services data. The values ranged from 0.196 to 1. The most connected city, London had a value of 1, the next was New York with a value of 0.976 all the way to Lagos with a connectivity value of 0.196. Figure 1 plots the GAWC connectivity value of each of the 123 world cities against their population. The population figures were derived from Brinkoff (2001) who gave the figures for all cities with more than 1 million. For cities with less than 1 million, and this included 16 cities, the latest population figures were taken from the respective recent national census1. Connectivity was conceptualised as a function of population size, a regression line was fitted through the data and the resulting linear regression is presented in Figure 1. The linear regression model allows us to identify the position of individual cities compared to the aggregate pattern. The value of individual cities varies from this equation; the difference is referred to as a residual. Those with a connectivity greater than that predicted by the equation have positive residuals, and conversely, those with a connectivity less than that predicted by the equation have negative residuals. The residuals are revealing since they indicate connectivity greater or lesser than that predicted by population size alone. The residuals are plotted in Figure 2 and the cities with the very largest residuals are noted. Tables 4 and 5 list the ten cities with the largest negative and positive residuals respectively. The cities listed in Table 4 are world cities that have a degree of connectivity less than that predicted by their population. This is a crude measure, but nevertheless provides a provisional look at loose connections. The least connected city is Calcutta, followed by Lagos and Karachi. From the previous discussion we would expect this pattern. The less connected cities tend to be very large cities in poor countries. Their weight of population is not matched by the corresponding amount of producer service activity found in the rest of the world. Further down the table are found Kiev and Pittsburgh. The economy of Ukraine has collapsed in recent years while Pittsburgh has witnessed severe deindustrialization whilst many of the producer service functions can easily be handled by large cities close by such as New York and Philadelphia. The more connected cities, shown in Table 5 include London, New York, Hong Kong and Singapore and a strong representation of European cities as well as Toronto. London and New York, despite their huge populations are more connected than any other cities, a function of the centrality in the global urban network. The remaining cities are much smaller but have significant connectivity. The results are more suggestive than definitive but they suggest cities differentially connected to the global urban hierarchy in which broad patterns of national wealth and the size of the local economy play a significant role. It is important to note in passing that the largest positive residuals are substantially larger than the largest negative residuals, which suggests that the network is dominated by a small number of exceedingly well-connected cities. The residual value for London is almost six times the size of the value for Pittsburgh for example. The results suggest a global urban network dominated by a few key cities with London, New York, Hong Kong and Singapore providing global coverage. CONCLUSIONSThis paper has been a rudimentary exploratory empirical analysis that focussed attention on the missing gaps rather than the connected nodes of the global urban network. The data sets were not ideal and the analysis was relatively crude. It did not discuss the issue of scale. For example, global cities have marginalized populations while black holes also have transnational elites. The analysis has been pitched at an aggregate scale. However, despite the obvious failings, the most startling point is to what extent this simple analysis managed to pick up some obvious examples of global disconnect. Poverty, economic and social collapse, exclusion and resistance were posited as reasons for the existence of very large cities with few global economic connections. Four ideal types were suggested: poor city, collapsed city, excluded city and resisting city. These cities were either ignored, abandoned, or excluded by global capital or were sites of resistance against capitalist incorporation. The picture of loose connections presents a similar picture of large poor cities in Asia and Africa much less connected than London, New York, Hong Kong and Singapore. The absolute values suggest a network dominated by a few very well connected cities. The study has been exploratory. Clearly, further work is desirable. However, the paper has provided the empirical beginnings for a debate on the uneven nature of globalization. Theorized case studies of less-connected cities present an intriguing opportunity to understand and explore the underside of globalization. Silences and voids are also part of globalization. It is just as important to identify the black holes and loose connections as well as the important nodes of the global urban network. REFERENCESBeaverstock, J.V., Smith, R.G. and Taylor, P. G. (1999) A roster of world cities. Cities,16, pp 445-451. Brinkhoff, T. (2001) The principal agglomerations of the world, http://www.citypopulation.de, 14.10.2001. GAWC (Globalization and World Cities) (2002) http://www.lboro.ac.uk/gawc/publicat.html Hall. P. (1984) The World Cities. London: Weidenfeld and Nicholson. Sassen, S. (1991; 2ed 2001) The Global City. Princeton: Princeton University Press. Short, J. R. Kim, Y., Kuus, M., and Wells. H. (1996) The dirty little secret of world cities research. International Journal of Urban and Regional Research, 20, pp 697-715. Short, J. R., Breitbach, C., Buckman, S. and Essex, J. (2000) From world cities to gateway cities. City, 4, pp 317-340. Taylor, P.J. (1999) Worlds of large cities; pondering Castells' space of flows. Third World Planning Review, 21 (3), pp iii-x. Taylor, P. J. (2001) Specification of the world city network. Geographical Analysis, 33(2), pp 181-194. Taylor, P. J., Catalano, G. and Walker, D.R. (2001) Measurement of the world city network. Research Bulletin 43. (http://www.lboro.ac.uk/gawc/rb/rb43.html). WorldBank (2001) http://www.worldbank.org/data/countrydata/countrydata.html NOTES* John Rennie Short, Department of Geography, Maxwell School, Syracuse University, Syracuse, NY 13244, USA 1.These cities were: Abu Dubai, Bratislava, Calgary, Dubai, Geneva, Hamilton, Luxembourg, Manama, Nassau, Nicosia, Port Louis, Oslo, Quito, Wellington, Zagreb, Zurich. Table 1: Large Non-world Cities
Table 2: Black Holes?
Table 3: A Typology of Non-world Cities
Table 4: Loose Connections
Table 5: The Well Connected Cities
Edited and posted on the web on 27th February 2002 Note: This Research Bulletin has been published in The Professional Geographer, 56 (2), (2004), 295-302 |
|||||||||||||||||||||||||||||||||||||||||||||||||||||||||||||||||||||||||||||||||||||||||||||||||||||||||||||||||||||||||||||||||||||||||||||||||||||||||||||||||||||||||||||||||||||||||||||||||||||