GaWC Research Bulletin 58 |
|
|
|
This Research Bulletin has been published in The Arab World Geographer, 4 (3), (2001), 146-159.
This paper derives from a research project that has developed an original global urban analysis. The prime output is a description of the configuration of the contemporary world city network. Here we focus upon the cities of West Asia/North Africa (WA/NA): 29 are initially assessed but most of the paper focuses upon the 12 most important cities of the region. I am not a regional specialist and therefore I intend results from this global urban research exercise to be 'food for thought' for those with a deeper regional understanding. Hence the merit of the paper is necessarily in the uniqueness of the empirical findings The global urban analysis is based upon two initial research exercises. First, there is a specification of the world city network which builds upon the world/global city literature. Second, this specification is used to guide measurement of the world city network through the study of financial and business service firms. The first part of the paper summarises this basic research and describes the global network connectivity of WA/NA cities. In the second part, previous global analyses are reviewed and the position of WA/NA cities within the world city network is assessed. In the third part completely new analyses of WA/NA cities are presented illustrating their diversity and the geographical patterns of their service connections. This is primarily a theoretically-informed empirical paper but in a short conclusion some policy and political implications of the findings are discussed. AN INTERLOCKING NETWORK: SPECIFICATION AND MEASUREMENTThe specification and measurement of the world city network have been described in some detail elsewhere (Taylor, 2001; Taylor et al. 2001a). Here only a summary of the arguments is given so that this paper can be free-standing. Specification: Business Service Office Networks
Measurement: Global Network Connectivity
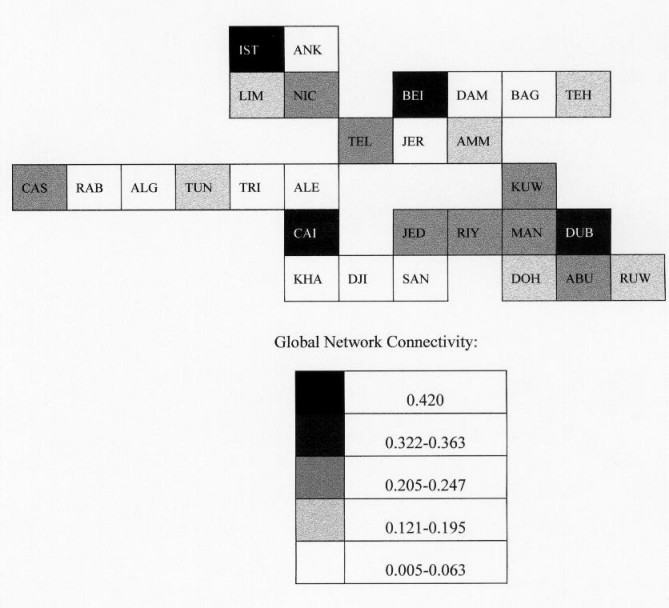
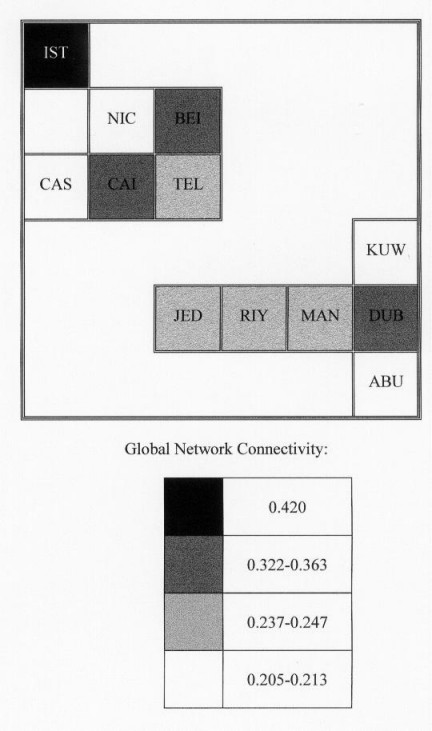
The Global Network Connectivity of WA/NA CitiesThere are 29 cities from WA/NA in this data and their global network connectivities are shown in Table 1 and Figure 1. The first point to make, although this is hardly a revelation, is that the region has no major world cities. The key point is, of course, that we now have a measure of this regional deficiency. The highest ranked city is Istanbul at 35th but this is right on the edge of the region. Otherwise the region does not feature in the top 50 of world cities in terms of contemporary network connectivity. This is a remarkable demise for a region that historically has been at the centre of global urban development. Having relatively low connectivities does not mean being unconnected, of course, and the listing in Table 1 remains of great interest as the first comparative analysis of WA/NA cities in terms of their global inter-city relations. After Istanbul there is a group of three cities with 'medium' connectivities, Dubai, Cairo and Beirut which are respectively the new Gulf Arab world city, the traditional Mediterranean Arab world city, and the historical urban linch-pin of the region. Again, nothing surprising here but we can see these cities in a new relative global perspective. It is as we move down the list that comparisons provide completely new insights (Figure 1). Thus in the next group of cities the two chief Saudi cities, Jeddah and Riyadh, are shown to have approximately the same level of connectiveness as Manama and Tel Aviv. Following this there is another group of cities not usually grouped together but here shown to be similar in their network importance - Casablanca, Abu Dhabi, Kuwait and Nicosia. The remaining cities have very low levels of network connectivity and as we reach the bottom of the list there are less surprises once again. In the global study from which these results have been drawn, the data matrix has been reduced to just 123 cities for detailed analysis. The focus has been on cities with over one fifth of London's connectivity which means that the remainder of this paper will deal with only the 12 cities mentioned in the last paragraph. These are shown in Figure 2 where they divide into two groups which we might call, geographically, 'Mediterranean' and 'Peninsular' or, economically, 'non-oil' and 'oil' groups. However this economic geography divide is not particularly salient to the sort of inter-city relations being studied and it is not found to be relevant in the analyses reported below. WA/NA CITIES IN GLOBAL ANALYSESIn this section previously published analyses of world cities using this unique data are reported taking special account of the 12 WA/NA cities. As might be expected these cities do not generally feature prominently in these analyses but this work does provide an introduction for taking the argument beyond simple measurement of connectivity. Clusters of CitiesEven the reduced 100 (firms) x 123 (cities) data matrix is an immense amount of information and therefore the first step in analysis is to search for parsimony. The factor analysis family of techniques provide the standard tools for this job and we use the simplest model, principal components analysis (using principal axes extraction, varimax rotation). An R-mode analysis clusters together firms with similar distributions of service values and the resulting component scores show such aggregate office distributions across cities. Analysing this data produces 6 components but WA/NA cities are largely conspicuous by their absence (Taylor et al., 2001b). This means that cities from this region are not important considerations for most global service strategies. There are just two exceptions. Manama appears in component III which describes banking and financial services focussed upon Pacific Asia and articulated through Tokyo. Istanbul features in component IV which describes advertising services in medium-sized markets articulated through New York. These two results show important individual city connections into service clusters but the main finding remains the dearth of such important sector linkages within this region. In a Q-mode analysis it is cities that are clustered together on the basis of the similarities of their service profile and the resulting component loadings show cluster membership. Analysing this data shows a 'prime structure' of 5 components (Taylor et al., 2001c). Unlike the R-mode analysis, WA/NA cities do feature prominently in this city-focussed analysis. This is because the first component is a cluster of relatively unimportant cities from the outer regions of the world economy, that is to say from outside the main globalization arenas. This includes 10 of the 12 WA/NA cities with Tel Aviv, Kuwait, Beirut and Casablanca loading particularly high. The two missing cities are Abu Dhabi and Manama. Thus for the most part, WA/NA cities join with other African, Latin American, South Asian and eastern European cities (plus four Scandinavian cities as 'peripheral Europe') in a large cluster of 'wannabe world cities'. All major world cities are conspicuous by their absence from this cluster. The latter load variously on the other four components delineating USA, Pacific Asia, Europe and 'Old Commonwealth' clusters of cities. There are no WA/NA cities loading significantly with USA or European city clusters. Istanbul and Manama have low loadings with Pacific Asian cities and Nicosia, Abu Dhabi and Dubai are similarly loaded with Old Commonwealth cities. But the main finding of this analysis for here is that there is no WA/NA cluster of cities, this region's cities are in the 'rump' cluster of 'outer cities'. More sensitive analysis does bring out Latin American and Indian city clusters but a WA/NA cluster remains elusive in this analysis (Taylor et al. 2001b). Conclusion on clusters: these analyses suggest that there is no WA/NA 'sub-network' of cities nor are cities from this region well connected into the main globalization arenas. Power in the NetworkIn the most common way of conceptualising power as a command or hierarchical function - 'power over' - it is clear that WA/NA cities are not among the most powerful in the world city network. However, in a network structure power is not this simple because of the mutuality of inter-connectedness in the system. This means that there is an incipient power in all nodes - sometimes distinguished as a 'power to' action or potential. In exploring configurations of power within the data, initial failure to register command power in WA/NA cities is confirmed (Taylor et al., 2001d). The only exception is Manama which has the lowest level of 'regional command' (regional headquarter offices) in the analysis; for the most part this region is 'commanded' extra-regionally from London, sometimes as part of EMEA (Europe-Middle East-Africa). But there is a slight change when we search out more subtle intimations of power. All the global command power in the data is to be found in the USA, western Europe and Tokyo. But there are still places where firms have to be in order to provide their seamless service. For instance, Hong Kong has no global command functions but is, nonetheless, the 3rd most connected city in the data. Clearly this is a city many firms feel they have to locate in order to have a working global strategy. Thus this city may have no headquarter offices but it is still powerful - here is the power necessary to enter Pacific Asian, especially Chinese, markets. This is a node where knowledge and information in the world city network intersects with regional knowledge and information to create an indispensable city within the network. Defining these 'gateway cities' as those with no global command functions but with relatively high connectivity, 33 such cities are identified and Istanbul qualifies in the lowest category. However, this city is on the border of WA/NA and, as will be shown in the next section, its links are more with eastern Europe than WA/NA. An alternative approach searches out cities with particularly high levels of 'subordinate' connections (i.e. an inter-city link where a city's service level is lower than the service level of another city). In most analyses such links are seen as weakness - 'dependence' - but in a network this need not be necessarily so. Rather than dependence on the outside this can be represented as the outside's the need for firms to be in emerging markets where, almost by definition, not many command functions or even extra large offices, will have developed for conducting global business. There are 31 such 'emerging centres' identified in the data and most relate to cities as 'national articulators'. WA/NA has three of these cities - Cairo, Beirut and Dubai. Cairo might be a typical national articulator of a small national economy into the world economy but Beirut and Dubai are from smaller countries and will be articulating a more regional insertion into the world economy. In conclusion on power: although WA/NA largely lacks any command power, there is some notable 'network power' with Istanbul identified as a gateway city and with three other cities deemed to be emerging centres. GLOBAL ANALYSES OF WA/NA CITIESIn this section there is new analysis of the 12 WA/NA cities from two very different perspectives. Both deal with diversity among the cities. The first produces a typology of the cities in terms of their services mixes, that is to say, it answers the question 'what sort of service centre is this city?'. The second produces a typology of cities in terms of the nature and pattern of their external links. Decomposition of Connectivity: City Service Centre TypesThe global network connectivity of cities is derived from the service values distributions of 100 firms. As we have already noted, these firms are from 6 different service sectors. Therefore for each city, its global network connectivity can be divided into 6 parts by computing connectivity sector by sector. For example, using just the 18 accountancy firms, an accountancy connectivity measure can be computed for a city. In this way the global network connectivity measure of a city can be decomposed into 6 sector connectivities. For each city, the sector connectivity measures can be computed as proportions of their overall global network connectivity. In this way, sector connectivity measures can be used to compare cities in terms of their relative service mixes. To ease interpretation, average proportions for each sector across all 123 cities have been computed. Sectors where WA/NA cities have above average proportions making up their global network connectivity are shown in Table 2. In addition the figures in Map Portfolio A show also cities that appear in the top 30 of the 123 world cities with respect to different sector relative connectivities. The first point to make from the table and the portfolio is the dominance of accountancy and advertising in the make up of WA/NA global network connectivities. Ten cities have above average connectivity for accountancy and 9 for advertising. This does not, of course, mean that WA/NA is some sort of 'accountancy region' for these a relative measures on a city by city basis. Rather it indicates support for previous analyses that show WA/NA cities to be relatively unimportant in the network. Accountancy and advertising have the most widespread distribution of services across the network and therefore a city's relative concentration on these services indicates, not a positive feature, but rather a relative deficiency in other services that are more concentrated, that is to say services more selective in their city locations Table 2 is organised in the form of a simple typology. Type A includes four cities that are above average for only accountancy and advertising. We can term these 'basic outer cities' with only the most dispersed services featured. One of the region's 'medium-sized' world cities, Beirut, has this type of service pattern. Type B includes another four cities that are above average for accountancy, advertising and one or more other service. These are 'basic outer cities with something extra'. The other two 'medium-sized' world cities are in this type: Cairo is above average in banking/finance and Dubai in both Insurance and law. Type C includes two cities that have above average accountancy but not advertising. The latter service is national-market orientated and usually firms have offices in just one city per country. United Arab Emirates and Saudi Arabia are the only countries represented here with two cities and their respective 'second cities' (from an advertising perspective) constitute this type. In Type D there are the two cities with the most distinctive patterns of sector connectivities, not least because of their below average accountancy connectivity. This confirms Istanbul's status as the leading WA/NA city with above average connectivities in advertising (for the relatively large Turkish market) and in banking/finance. Manama is the most distinctive city having above average connectivity in just one service, banking/finance. In fact, Manama's banking/finance ranks number one among all 123 world cities in terms of the relative contribution of banking/finance to its overall global network connectivity. In other words, it is the most specialised of all world cities that are international financial centres. In conclusion on diversity of service mixes: WA/NA cities are largely minor outer cities relatively over reliant of the widely dispersed accountancy and advertising sectors. Only two cities have below average accountancy connectivity: Istanbul confirms its importance, Manama its specialization. Mapping External Connections: City 'Hinterworld' TypesHow are WA/NA cities linked to the rest of the world city network? To answer such a question it is necessary to map the 'hinterworlds' of the cities. The term hinterworld has been coined as a global replacement for hinterland under conditions of contemporary globalization (Taylor, 2001b). It is not that local global hinterlands disappear, but the development of a world city network has created a new scale of linkages requiring a new concept. Unlike hinterlands, hinterworlds are not demarcated by boundaries since in the interlocking world city network every city is linked to every other city. The key feature of hinterworlds, therefore, is the unevenness in the pattern of links. Every city has its own hinterworld of cities where it has intense links and other cities where there is little linkage. The unique data we have assembled allows for the comprehensive mapping of hinterworlds for the first time. To measure the level of service provided in city y to city x is computed as follows. Let the number of firms in city x be nx. Compute the maximum service level in another city as 5nx - this is the hypothetical case where the other city has the highest service values (i.e. 5) for every firm located in city x. Now sum the actual service values of all firms in city y that have a presence in city x. This sum is divided by the maximum to provide a measure of service in city y available to firms in city x. Obviously for every city service linkage is very closely related to global network connectivity. For instance, starting in Cairo it is expected that very high service linkage will be obtained with London and New York compared to Casablanca and Kuwait because the former pair have large numbers of high service values (4s and 5s). Thus all patterns of gross linkage will be very similar since they reflect the global network connectivities. To measure the distinctiveness of each hinterworld, the gross linkages are regressed against global network connectivity and the residuals computed. A large positive residual indicates where are city provides a service to another city at a level much greater than would be expected from its global network connectivity. These are termed 'high relative linkages'. Maps for all 12 cities are presented in Map Portfolio B. These are unique diagrams: hinterworlds have not been illustrated for all main cities in a region before. The distinctiveness of WA/NA cities is shown by their high relative linkages. To ease map comparison each diagram shows the largest 30 positive residuals ordered into three groups of 10. In Table 3 these residuals are distributed across 10 world regions from which a simple typology has been constructed. The regions are divided into two zones based upon the results from the principal components analysis reported above. Thus WA/NA is allocated to the 'outer regions' zone along with 5 other regions that are beyond the main globalization arenas. There are 4 other regions designated as service core regions. Before considering the typology it is instructive to look at the overall pattern represented by the sums in the final row. The first point to make is that, overall, there is a definite intra-regional concentration tendency with WA/NA cities featuring the most. In addition, outer cities far outnumber service core cities despite the latter housing many more cities in the data. In both zones European cities are well represented. Northern America is particularly under-represented especially given that is has the highest total of cities in the data. In the typology, type A includes a majority of the hinterworlds exhibiting a pattern of WA/NA and general outer zone dominance. This is the typical hinterworld for cities of this region, types B and C represent slight modifications of this pattern. In type B, Nicosia and Dubai have a western European addition to the pattern. In type C, Manama and Istanbul have a Pacific Asian bias in their hinterworlds. In the case of Manama, in particular, this is a consequence of its international financial centre role with very high linkage to this 'banking/finance' globalization arena, and to western European finance centres such as Geneva and Zurich (see Map Portfolio B). Note also the low number of WA/NA cities in Istanbul's hinterworld. This suggests that this most connected city from the region does not act like the leading city of the region. This is perhaps not surprising given its eccentric regional location: it appears more eastern European in its pattern of linkages than WA/NA (see Map Portfolio B). Finally, Abu Dhabi has a hinterworld like no other in the region. The outer zone, including WA/NA, is hardly featured at all: this is a hinterworld showing the city linked into all the service core zone regions. In conclusion on hinterworlds: WA/NA cities have quite predictable patterns of high relative high service linkages featuring neighbouring regional cities plus cities from other outer regions. Manama has an international financial centre's hinterworld and Abu Dhabi has a totally distinctive 'service core' hinterworld. CONCLUSION: BEGINNING A REGIONAL AUDIT OF WORLD CITIESThis paper may be considered an empirical accompaniment to Stanley's (2001) call to begin rethinking economic development in the region from a city-centred perspective. However, to say that these results are only the tip of an iceberg in understanding how WA/NA cities connect the region into the world economy is a very optimistic overstatement. With the world cities literature neglecting both this region (Abu-Lughod, 1996) and inter-city relations in general (Taylor, 1999), this first attempt to use methods that focus on connectivities within the world city network has no yardstick against which to judge the results. They look broadly reasonable but they must be treated with caution. And there is an important caveat that needs to be remembered. In the process of producing measures we have inevitably narrowed the range of activities considered. All world cities are much more than just service centres for global business. Many other economic links plus cultural and political links are not included. Missing the latter in a region that political geographers traditionally identify as a 'shatter belt' may be viewed foolhardy. But these analyses are about the region as it exists within an economic global space of flows that either use or by-pass the confrontational politics. Thus in all the analyses, Tel Aviv appears as an archetypal WA/NA city and it is two Arab cities, Manama and Abu Dhabi, that have the western connections of global service firms. What this means is that global service firms, by and large, treat Tel Aviv not as a 'Middle East outlier' but as one of several relatively minor world cities in the region that articulate relatively small national markets into the world economy. (See Kipnis (2001) for the particular nature of Tel Aviv as a world city). Eschewing the shatter belt model and treating the region as a collection of nodes in a world city network leads to alternative policy and political themes. Using cities in development programmes is to be found across the region (Stanley, 2001) and some success stories are reflected in the results reported above. Two stand out: first, Bahrain's promotion of Manama as an international financial centre after oil, and second, the United Arab Emirates promoting two world cities - it is by far the smallest (population) state in the world to have two cities in the top 123 cities in the world city network. The basic advantage of such policy is that the result is not necessarily more of the traditional 'modern' dependent development, network development is much more subtle than the old hierarchies and is integrating the world economy in new ways we do not yet understand. I have one final thought in network thinking in relation to WA/NA. Developing nodes in the world city network is obvious difficult from a poorly connected starting position. Politics is usually required to give it a kick start (cf. Kuala Lumpur (Sirat and Ghazali, 1999)). Global service firms will only locate in a city if there is a locus of activity that they can service. World cities require a critical mass of international activity around which to grow knowledge communities and become a meaningful node in the world city network. Which brings us to Palestine. Lobbying should start now to persuade OPEC to leave its headquarters in Vienna and relocate in, say, Gaza City. If West Asia is ever to match East Asia in growing development and wealth it will need to emulate some of the 'development corridors' and 'growth triangles' at the other end of the continent. A Gaza City-Jerusalem- Tel Aviv triangle in which Gaza City integrates Mediterranean and 'oil' Arab states, Jerusalem as a joint capital city generates new services for government, and Tel Aviv begins to exploit its potential 'western' economic links, might just be an irresistible global urban region generating a level of network power the region currently lacks. In addition, of course, moving OPEC to Palestine would change the current geopolitical situation somewhat. ACKNOWLEDGEMENTThis paper is based upon research supported by the ESRC. The full project is entitled: "World city network formation in a space of flows" REFERENCESAbu-Lughod, J (1996) 'Urbanization in the Arab world and the international system' in J Gugler (ed) The Urban Transformation in the Developing World. Oxford: Oxford University Press Kipnis, B A (2001) 'Tel Aviv, Israel - a world city in evolution: urban development at a deadend of the global economy' GaWC Research Bulletin 57 Sassen, S (1991) The Global City. Princeton, NJ: Princeton University Press Sirat, M and Ghazali, S (1999) Globalisation of Economic Activity and Third World Cities: a Case Study of Kuala Lumpur. Kuala Lumpur: Utusan Stanley, B (2001) '"Going global" and wannabe world cities: (re)conceptualizing regionalism in the Middle East', GaWC Research Bulletin 45 Taylor, P J (1999) '"So-called world cities": the evidential structure within a literature" Environment and Planning A 31, 1901-4 Taylor, P J (2001a) 'Specification of the world city network' Geographical Analysis 33, 181-94 Taylor, P J (2001b) 'Urban hinterworlds: geographies of corporate service provision under conditions of contemporary globalization' Geography 86, 51-60 Taylor, P J, Catalano, G, and Walker D R F (2001a) 'Measurement of the world city network' GaWC Research Bulletin 43 Taylor, P J, Catalano, G, and Walker D R F (2001b) 'Multiple globalizations: regional, hierarchical and sector articulations of global business services through world cities' GaWC Research Bulletin 55 Taylor, P J, Catalano, G, and Walker D R F (2001c) 'Exploratory analysis of the world city network' GaWC Research Bulletin 50 Taylor, P J, Walker D R F, Catalano, G, and Hoyler, M (2001d) Diversity and power in the world city network' GaWC Research Bulletin 56
Table 1: The Global Network Connectivity of WA/NA Cities
Table 2: Four Types of Service Centres
X indicates above average contribution of a sector to a city's global network connectivity
Table 3: Four Types of Hinterworlds
Regions: WA/NA West Asia/North Africa; L.AM Latin America; SCAN Scandinavia; E.EU Eastern Europe (former Soviet bloc); SSAF Sub-Saharan Africa; S.AS South Asia; N.AM Northern America; W.EU Western Europe (not including Scandinavia); P.AS Pacific Asia; AUS Australasia.
Figure 1: Global Network Connectivity of WA-NA Cities
Figure 2: Global Network Connectivity of WA-NA Cities
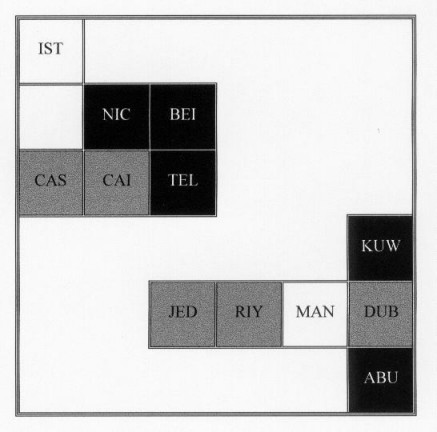
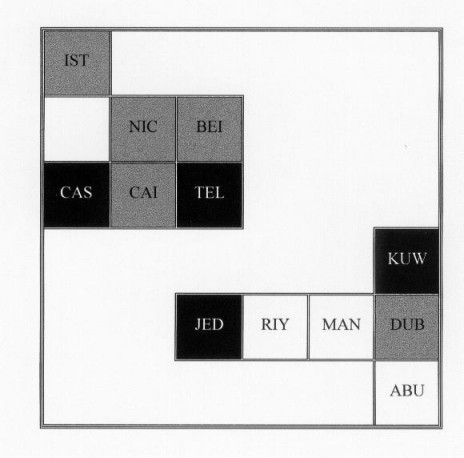
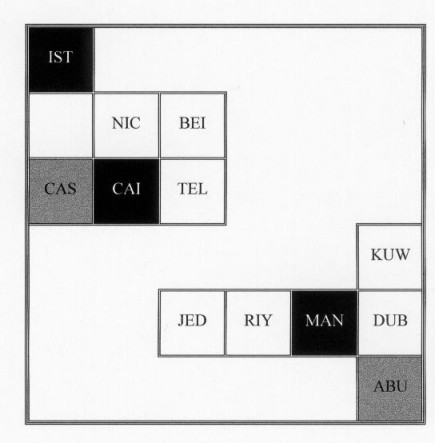
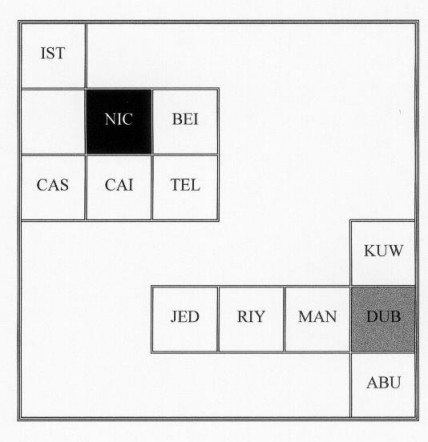
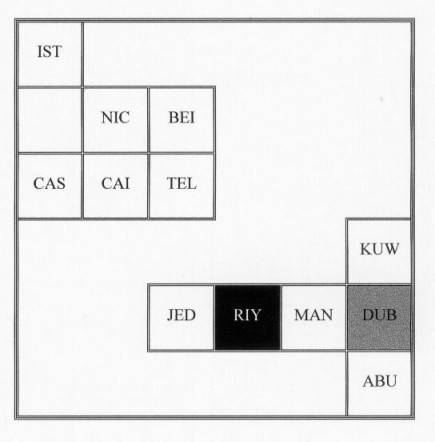
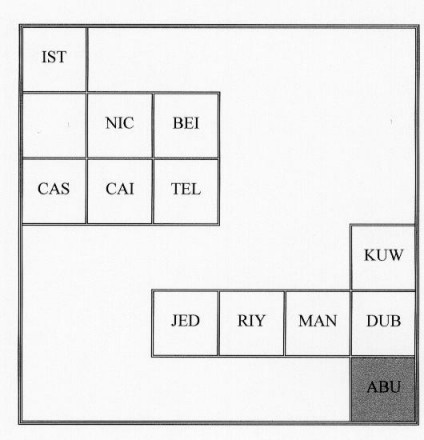
Map Portfolio A: Decomposition of Global Network Connectivity by Service Sectors The cartogram used below places cities in their approximate relative geographical positions. The codes for cities are: ABU = Abu Dhabi; BEI = Beirut; CAS = Casablanca; CAI = Cairo; DUB = Dubai; IST = Istanbul; JED = Jeddah; KUW = Kuwait City; MAN = Manama; NIC = Nicosia; RIY = Riyadh; TEL = Tel Aviv.
(Shaded cities are above average, black indicates a city in the top 30)
(Shaded cities are above average, black indicates a city in the top 30)
(Shaded cities are above average, black indicates a city in the top 30)
(Shaded cities are above average, black indicates a city in the top 30)
(Shaded cities are above average, black indicates a city in the top 30)
(Shaded cities are above average, black indicates a city in the top 30)
Map Portfolio B: City Hinterworlds Cities are in the same order as Table 3 so that like hinterworlds are together. The cartogram used below places cities in their approximate relative geographical positions. The codes for cities are: AB Abu Dhabi; AD Adelaide; AK Auckland; AM Amsterdam; AS Athens; AT Atlanta; AN Antwerp; BA Buenos Aires; BB Brisbane; BC Barcelona; BD Budapest; BG Bogota; BJ Beijing; BK Bangkok; BL Berlin; BM Birmingham; BN Bangalore; BR Brussels; BS Boston; BT Beirut; BU Bucharest; BV Bratislava; CA Cairo; CC Calcutta; CG Calgary; CH Chicago; CL Charlotte; CN Chennai; CO Cologne; CP Copenhagen; CR Caracas; CS Casablanca; CT Cape Town; CV Cleveland; DA Dallas; DB Dublin; DS Dusseldorf; DT Detroit; DU Dubai; DV Denver; FR Frankfurt; GN Geneva; GZ Guangzhou; HB Hamburg; HC Ho Chi Minh City; HK Hong Kong; HL Helsinki; HM Hamilton(Bermuda); HS Houston; IN Indianapolis; IS Istanbul; JB Johannesburg; JD Jeddah; JK Jakarta; KC Kansas City; KL Kuala Lumpur; KR Karachi; KU Kuwait; KV Kiev; LA Los Angeles; LB Lisbon; LG Lagos; LM Lima; LN London; LX Luxembourg; LY Lyons; MB Mumbai; MC Manchester; MD Madrid; ME Melbourne; MI Miami; ML Milan; MM Manama; MN Manila; MP Minneapolis; MS Moscow; MT Montreal; MU Munich; MV Montevideo; MX Mexico City; NC Nicosia; ND New Delhi; NR Nairobi; NS Nassau; NY New York; OS Oslo; PA Paris; PB Pittsburg; PD Portland; PE Perth; PH Philadelphia; PN Panama City; PR Prague; QU Quito; RJ Rio de Janeiro; RM Rome; RT Rotterdam; RY Riyadh; SA Santiago; SD San Diego; SE Seattle; SF San Francisco; SG Singapore; SH Shanghai; SK Stockholm; SL St Louis; SO Sofia; SP Sao Paulo; ST Stuttgart; SU Seoul; SY Sydney; TA Tel Aviv; TP Taipei; TR Toronto; VI Vienna; VN Vancouver; WC Washington DC; WL Wellington; WS Warsaw; ZG Zagreb; ZU Zurich
Edited and posted on the web on 15th October 2001 Note: This Research Bulletin has been published in The Arab World Geographer, 4 (3), (2001), 146-159 |
||||||||||||||||||||||||||||||||||||||||||||||||||||||||||||||||||||||||||||||||||||||||||||||||||||||||||||||||||||||||||||||||||||||||||||||||||||||||||||