GaWC Research Bulletin 460 |
|
|
|
This Research Bulletin has been published in Growth and Change, (2017), OnlineFirst. Please refer to the published version when quoting the paper
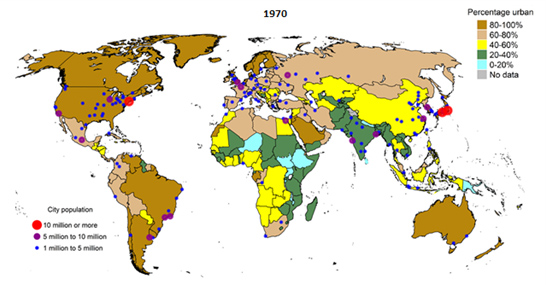
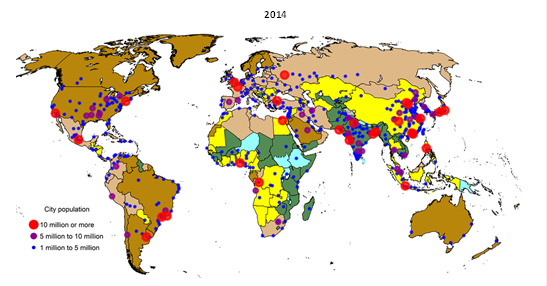
IntroductionFor a long time in world history, building an empire around a city or having a large city within a country was crucial for economic success and/or political dominance: Alexandria around 200BC, Rome in 1AD or Chang’an in China in 800AD are clear examples of this (Chandler 1987): big cities brought about development and prosperity; and development, in turn, made the growth of big cities possible. This rule was still very much in evidence in the 1950s. At that time, the majority of the world’s biggest cities – 20 out of 30 – were located in high-income countries (United Nations 2014). The few exceptions to the rule were cities in large developing countries, such as China, Mexico, and Brazil. The poorest countries in the world at the time lacked, in general, very large cities. Partially inspired by this observation, policy makers and economic theorists have long stressed the role of urbanization and cities for economic efficiency and growth (Duranton 2015; Glaeser et al. 1992; World Bank 2009). The size of a city, in particular, is considered an important driver of economic development. Based mainly on empirical evidence from the US and the UK, research has stressed how large cities lead to greater productivity and economic growth through the generation of agglomeration economies which allow for a more productive use of available resources (Melo, Graham, and Noland 2009; Rosenthal and Strange 2004). Over the past few decades, however, the world has changed significantly and these changes have put the link between large cities and economic success under greater scrutiny. Countries at low levels of economic development have rapidly urbanized and very large cities are no longer predominantly found in rich and/or dynamic countries (United Nations 2014). Moreover, cities have grown much larger. This has challenged the city size/productivity link. Recent empirical evidence suggests that the largest cities in the world today are not necessarily the most productive, but mid-size agglomerations (McCann and Acs 2011). Furthermore, factors that are often independent of city size, such as urban infrastructure, institutional capacity and industry composition, are increasingly regarded as more important determinants of whether a city can be judged as a motor for economic growth or not (Camagni, Capello, and Caragliu 2015; Castells-Quintana 2017; Glaeser 2014). The overarching aim of this paper is therefore to delve in greater detail into the link between the size of cities and aggregate economic growth in order to advance our understanding of the factors that may influence this relationship. More specifically, we explore empirically 1) whether in recent decades certain city sizes were more closely related to economic growth enhancing than others and 2) how additional factors highlighted in the literature affect the city size growth relationship. The paper contributes to the literature in two important ways. Firstly, while there are already a number of related studies that investigate the relationship between some measure of urbanization and economic growth, this paper analyses the so far understudied relationship between city size and economic growth. With the exception of Frick and Rodríguez-Pose (2016), who use a country’s average city size as explanatory variable, all other research focuses on the relationship between either urbanization and growth or urban concentration and growth (Brülhart and Sbergami 2009; Castells-Quintana 2017; Henderson 2003), overlooking the city size dimension. While the studies on the link between urban concentration and economic growth are frequently cited as evidence for the growth promoting effect of large cities, there are important differences between the two indicators. In fact, there is often an inverse relationship between urban concentration and city size. Many small countries have high degrees of urban concentration, but their main cities are relatively small. In contrast, many large countries contain multiple large cities, however have a low degree of urban concentration. It is conceivable that both urban concentration and city size impact economic growth, but that the channels differ. Urban concentration allows countries to use their public resources efficiently. Conversely, city size driven growth effects are more likely to reflect agglomeration economies. It is therefore pertinent to explicitly analyse the relationship between a measure of city size and aggregate economic growth. The second contribution relates to the analysis of contextual factors. More precisely the paper explores how the city size and growth relationship is shaped by other factors, such as urban infrastructure, governance, and industrial composition. This question has attracted increasing attention over the past years in the economics literature (see for example Camagni, Capello, and Caragliu 2013; Castells-Quintana 2017; Glaeser 2014), but has – with few exceptions – been rarely tested empirically to date. The remainder of the paper is structured as follows: the next section describes the theoretical and empirical literature that explores the link between city size and economic growth. The third section addresses our methodology, indicators used and presents the dataset. The results and discussion are included in the fourth section. The final part concludes and proposes areas for further research. City Size and Economic GrowthWhy should the size of a country’s cities impact economic growth? Economists have long taken an interest in the relationship between economic development, productivity, urbanization and cities (Hoselitz 1953; Lewis 1954; Marshall 1890). Over the past two decades, the New Economic Geography (NEG) and urban economics strands were among those to examine the mechanisms which govern the relationship. Both schools of thought take different but complementary angles in examining the link, and the overall tenor, in particular from the empirical literature, is that city size and agglomeration are fundamental drivers of economic growth through their impact on people’s productivity. The NEG literature generally sets out to analyse the link between agglomeration and economic performance at the national level. In the NEG framework of industry location (Krugman 1991), external scale economies, which are created through the co-location of population and economic activity (such as in cities), make people and companies more productive. The mechanisms through which external economies increase productivity are threefold: a) knowledge spill-overs between workers enable learning and spur innovation; b) forward and backward linkages between companies, suppliers and buyers make interactions between economic actors more efficient; and c) a pooled labour market allows for an easier matching between firms and employees. Simultaneously, centrifugal forces such as high land rents, pollution, and congestion work in the opposite direction as population concentration grows and thus decrease people’s productivity. Combining this framework with an endogenous growth model allows to assess the link between a country’s level of agglomeration and national growth. The conclusion of these theoretical exercises tends to be that more agglomeration of people and firms and thus larger cities, increase people’s and companies productivity and is, hence, tantamount to greater economic growth (Fujita and Thisse 2003; Martin and Ottaviano 2001). An array of empirical studies has sought to test the predictions of the theoretical NEG models (e.g. Brülhart and Sbergami 2009; Castells-Quintana 2017; Henderson 2003). The focus of these studies has been mainly on testing whether more concentrated urban structures, as measured by urban primacy, are growth inducing as opposed to testing the growth effect of the size of cities – the topic with which we are concerned in this study. Brülhart and Sbergami (2009) and Castells-Quintana and Royuela (2014), however, also use the percentage of the urban population living in cities above 750,000 or 1 million inhabitants as an alternative indicator for urban concentration and thus generate city size related empirical evidence as an interesting ‘side product’. Both studies find support for the big-city-growth-relationship: the larger the percentage of the population living in cities above these thresholds, the better the economic performance of countries, particularly at low levels of economic development. One drawback of this literature is, however, that it ignores the vast differences in the sizes of cities beyond the selected population threshold – i.e. over 750,000 or 1 million inhabitants. For instance, Austria and France had in 2015 a roughly similar share of its urban population living in cities over 1 million inhabitants (around 30%). In France, however, 22% of the urban population lived in Paris, a city of more than 10 million inhabitants, while Vienna, the only city in Austria with more than 1 million inhabitants, merely hosted around 1.8 million inhabitants (United Nations 2014). This indicator thus camouflages important differences between countries in terms of city size. It is therefore desirable to add more nuance to city size analyses, as it is by no means obvious that cities should have a uniform relationship with economic growth beyond the 1 million threshold. Urban economists adopt a slightly different perspective than the NEG literature. Instead of analysing the impact of city size or agglomeration on economic growth at the national level, they are concerned with the impact of city size on the productivity of the urban worker at the city level. In this framework, the mechanisms which determine people’s productivity are similar to those in the NEG literature. On the one side, Duranton and Puga (2004) describe forces related to the sharing of local infrastructure, matching of skills, suppliers and markets, and learning between people as the micro-foundations behind the localized scale economies that make people in cities more productive. They particularly emphasize the cumulative nature of knowledge generation and diffusion. On the other side, larger city size leads to increased rents and commuting time which reduces people’s productivity. Taken all together, a city’s productivity is therefore believed to follow an inverted U-shape function of total urban employment. Productivity increases with city size up to a certain population threshold, beyond which the disadvantages of agglomeration overshadow its benefits. An array of empirical studies find evidence for these productivity gains at the city level. Rosenthal and Strange (2004) find that labour productivity increases by 3-8% through a doubling of city size. Productivity gains tend to be greater in cities with high-tech sectors and service industries (Graham 2009; Henderson 2010). Meta-analyses confirm this positive relationship, although often underscoring the presence of important regional differences (e.g. Melo, Graham, and Noland 2009). This view is reinforced by Duranton (2015) who reports that productivity gains are even larger in emerging countries’ cities than in cities located in high-income countries (e.g. productivity increases for China between 10% and 12% as a result of doubling of city size). While these studies are concerned with productivity effects at the city level and not economic growth at the national level, they are still informative for our purpose. If people and resources in general are more productive in larger cities, then having a larger percent of the national population living in larger cities should increase a country’s overall productivity and, consequently, national growth. Despite their differing approach and focus of analysis, both NEG literature and urban economics have contributed to forge a prevailing view among many policy makers and academics: agglomerating people in larger cities increases people’s and companies’ productivity and, consequently, drives economic growth. In recent years, however, this assertion has increasingly been called into question by a raft of empirical studies (Dijkstra, Garcilazo, and McCann 2013; ESPON 2012; McCann and Acs 2011). Several factors contributed to what seems an increasing need to re-examine the link between city size and aggregate economic growth. First, many developing countries’ cities have outgrown their counterparts in the developed world: out of the 30 largest agglomerations in 2015, 23 were located in low- and middle-income countries. Countries as different as Bangladesh, the Democratic Republic of Congo, Mexico, Peru, or Indonesia are represented in this list (United Nations 2014). Figure 1, which shows the location of cities in in certain size categories in 1960 and 2011, also visualize this development. While only few cities with more than 1 million inhabitants could be found in the developing world in 1960, they existed virtually anywhere in the world by 2011. This explosion of large cities in many developing countries, which often went hand in hand with the emergence of large inner city slums and significant congestion, has cast increasing doubt on the relationship between city size and productivity for developing countries. Figure 1 Cities of different sizes in 1970 and 2014
Source: United Nations (2014) Second, cities have generally grown much larger than before. While New York was the largest city in 1950 with roughly 12 million inhabitants, today Tokyo, the largest city in the world, has 38 million inhabitants. Many developing country cities have grown to become mega cities: Delhi and Shanghai, with 26 million and 24 million inhabitants respectively are clear examples of this trend (United Nations 2014). The ever growing size of megacities has brought the linearity of the relationship between increased city size and economic growth at these city dimensions into question, especially given the urban economics u-shaped productivity function. Recent empirical research for European countries has provided evidence for this. OECD (2006) for example, finds support for a positive effect of city size on income at the city level, but only if some of the largest cities are excluded from the sample. When restricting the sample to megacities of more than 7 million inhabitants, the coefficient turns negative. Similarly, McCann and Acs (2011) indicate that among the 75 most productive cities in the world 29 cities have a population of less than 3 million inhabitants, while 32 range between 3 and 7 million. Considering the size of today’s megacities in particular, these are by no means the largest cities. Dijkstra, Garcilazo, and McCann (2013) explore the contribution of different European cities to national economic growth. Again, they find that not only have midsize cities grown faster than very large cities, but also that their contribution to national economic growth has been greater. Research by Parkinson and co-authors covering 31 European capitals and 124 second-tier cities (ESPON, 2012) comes to a similar conclusion. The evidence emerging from this literature thus suggests a mixed picture in which the role played by city size is far from uniform. This research has, thus, raised pertinent questions about the types of city sizes that tend to be growth maximising. Finally, researchers have increasingly gone beyond city size and emphasized the role of other factors behind changes in city-level productivity (Camagni, Capello, and Caragliu 2013; 2015). Industry specific aspects such as industrial composition (Au and Henderson 2006; Graham 2009) and company size (Faggio, Silva, and Strange 2017; Rigby and Brown 2015), context specific elements including government capacity (Ahrend et al. 2014; Glaeser 2014; Rodríguez-Pose 2013), and urban infrastructure (Castells-Quintana 2017) as well as network integration (Sassen 1991; Scott 2001) and borrowed city size (Alonso 1973) have featured prominently in these analyses. The importance of industrial composition, in particular, has attracted considerable attention. Tradable services and high-tech manufacturing benefit more from large cities than other sectors (Graham 2009), meaning that economies with a strong presence of such sectors benefit more from the presence of large cities than countries with a larger and/or more mature manufacturing industry base. Similarly, the provision of an adequate urban infrastructure is increasingly regarded as key for productivity and growth. Castells-Quintana (2017), for instance, shows empirically that in countries where the urban infrastructure, as proxied by sanitation, is not sufficiently developed, urban concentration can be growth inhibiting. Glaeser (2014) and Ahrend et al. (2014) furthermore highlight the importance of institutional capacity, in particular in developing countries, in order to reduce negative externalities which arise through rapid city growth. An empirical analysis of the city size growth link should therefore ideally account for these factors. Model and DataIn the following sections, we empirically test the relationship between city size and aggregate growth. As our interest lies in the relationship between city size and growth at the national level and not growth at the city level, the approach of the empirical NEG literature, that examines the link between urban concentration and national economic growth, is most suited for our purpose (Brülhart and Sbergami 2009; Castells-Quintana and Royuela 2014). The econometric model is built around a simple GDP per capita growth equation based on the extended Solow growth model (Durlauf, Johnson, and Temple 2005). We estimate a country’s growth rate in five-year periods as a function of an indicator for the size of a country’s cities as well a set of control variables commonly used in growth regressions. The model takes the following simple form: Where p denotes five-year intervals;
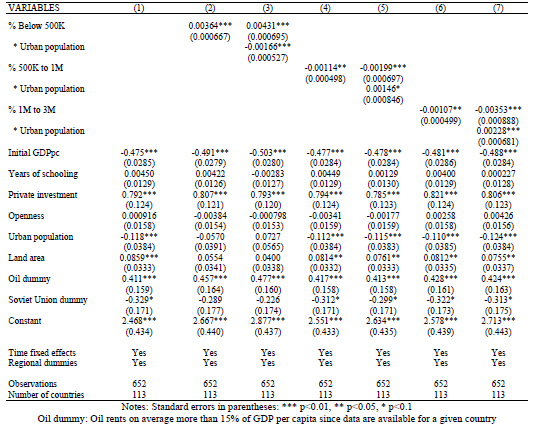
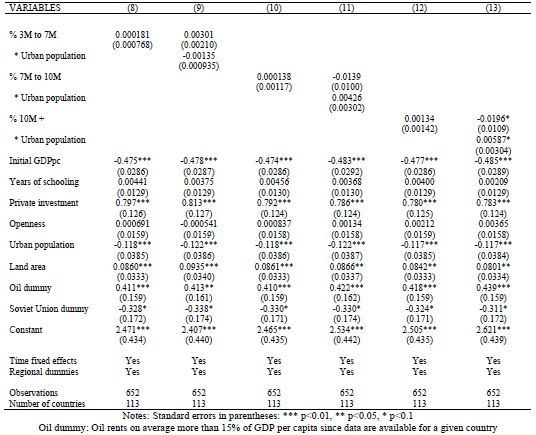
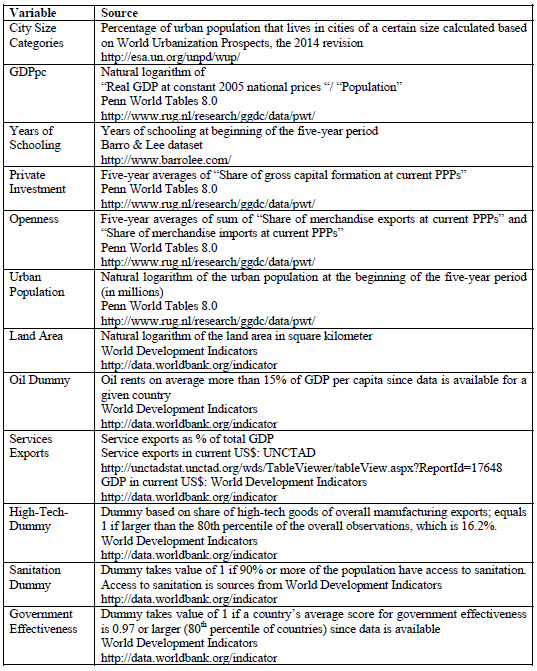
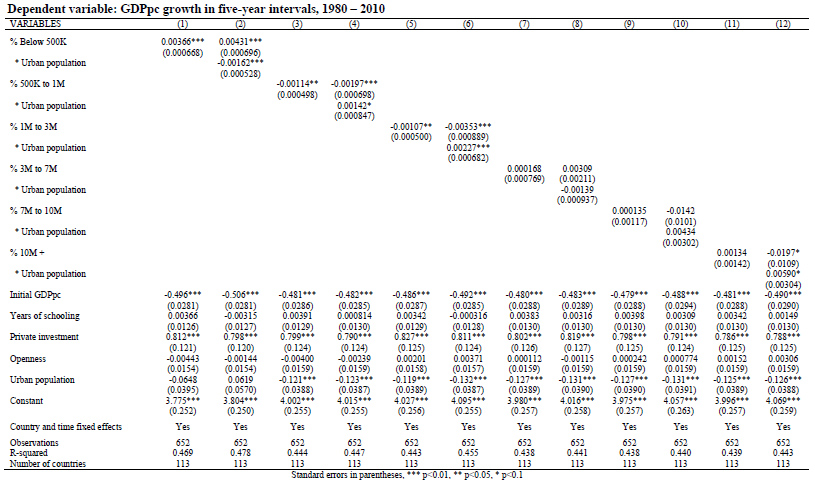
εip is the error term. For the variable of interest, citysizeip, we rely on data from the 2014 World Urbanization Prospects (WUP) which provides information on the percentage of the urban population living in cities of different size categories (United Nations 2014). We hypothesise that if cities of a certain size contribute to maximising the productivity of their population, a growing share of the urban population living in cities of that size should promote economic growth. To test this hypothesis, we combine different city-size categories available from the WUP to fit the OECD classification used in McCann and Acs (2011) as well as define further categories below and above the established thresholds in order to add greater nuance. We also take into consideration different well-established thresholds of what is considered a megacity: 7 million (OECD 2006) and 10 million (United Nations 2014). The resulting categories are the percentage of the urban population living in cities 1) below 500,000, 2) 500,000 to 1 million, 3) 1 million to 3 million, 4) 3 million to 7 million, 5) 7 million to 10 million and 6) 10 million and more.1 An interaction term with the natural logarithm of the urban population is also included in the analysis, as it is conceivable that the effect depends on the size of the country (Henderson 2003). As controls, we resort to the standard variables mainly used in cross-country growth regressions as well as a set of variables that may influence the size of a country’s cities and growth simultaneously. For the first set, we include a) initial GDP per capita to control for conditional convergence – growth is assumed to be faster in countries which start from a lower level (Durlauf, Johnson, and Temple 2005); b) years of schooling to measure a country’s human capital (Lucas 1988; Romer 1986); and c) private investment as a percentage of GDP as it is assumed to be a key growth driver in the Solow model. With regards to the controls which may be directly linked to city size as well as a country’s economic performance, we include the following variables. The first is openness, which is believed to influence a country’s spatial structure and city size (Krugman and Elizondo 1996) as well as to directly promote economic growth (Sachs et al. 1995). Including it ensures that the coefficient of our city size categories does not wrongly capture this latter effect. The second is a country’s physical land area. A large surface area such as in India or Brazil is expected to be closely linked to the size of a country’s cities. This may also be the case for a country’s urban population. Similarly, a country’s size (either measured in physical size or population) also influences its market potential, which in turn may have an effect on aggregate economic performance (Alesina, Spolaore, and Wacziarg 2005). It is therefore pertinent to include it in the regression. Furthermore, a number of dummy variables are considered in the analysis to account for the particularities in the growth and urbanization path that certain groups of countries may have experienced: a) continental dummies to account for systematic differences in the urbanization and growth paths of regions; b) economies which are strongly dependent on oil exports and c) states which formed part of the former Soviet Union. Finally, we include time fixed effects to ensure results are not driven by period specific trends. The data for the controls are derived from different sources. The years of schooling indicator comes from the Barro and Lee dataset, urban population from the 2014 edition of the World Urbanization Prospects, physical land area and the dummy for oil dominated economies is based on the World Development Indicators. The remainder of the data is sourced from the eighth edition of the Penn World Tables. A more detailed description of the indicators and sources is included in Appendix 1. Depending on the different specifications, a maximum of 113 countries is covered in the analysis.2 ResultsSize Categories and Economic GrowthIn order to analyse whether the percentage of the urban population living in cities of different size categories affects national economic growth, we include the indicators for the different size categories as well as their interaction terms with urban population one by one. Table 1 presents the HT results for these estimates and Appendix 2 the FE results. The basic model (regression 1) works well. The control variables show the expected signs and remain stable when the variables of interest – the different city size categories – are introduced in the analysis (regressions 2 through 13). Initial GDPpc is negative and significant at the 1% level throughout all our estimates, indicating conditional convergence. Private investment is the key driver for growth in the model: the coefficient is positive and highly significant in all estimations. Urban population has a negative association with economic growth in most regressions. This result is intuitive given that urban population is highly correlated to the overall population. Increasing population while holding other factors such as capital and years of schooling constant decreases the factor endowment per person and should, hence, have a negative impact on GDP per capita growth. The positive coefficients of the physical land area are also in line with expectations: holding other factors constant, adding another unit of land increases factor endowment per person and growth. This result does not hold when we control for the percentage of the urban population living in small cities. Furthermore, the dummy for countries whose exports are dominated by oil has – as expected – a positive and significant coefficient throughout and the dummy for the countries which formed part of the former Soviet Union is negative and significant at the 10% level in all but two regressions. Table 1: Dependent variable: GDPpc growth in five-year intervals, 1980-2010
Table 1: (continued)
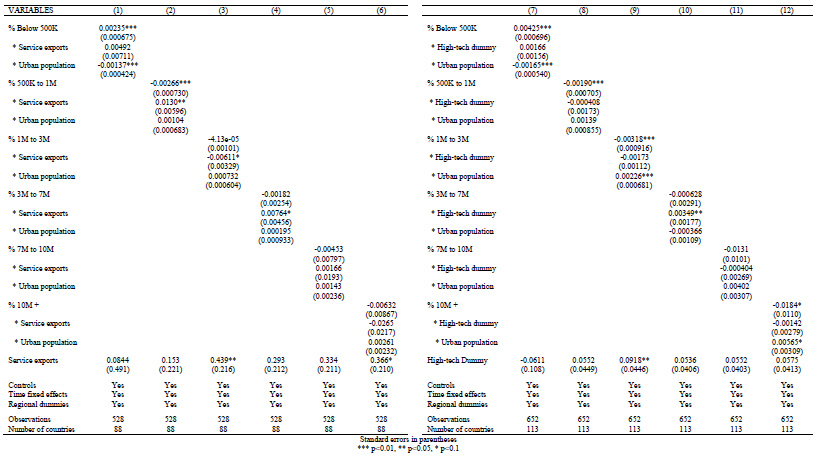
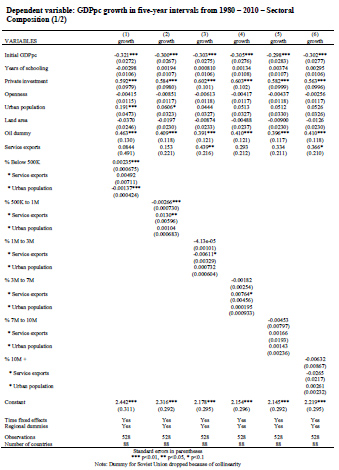
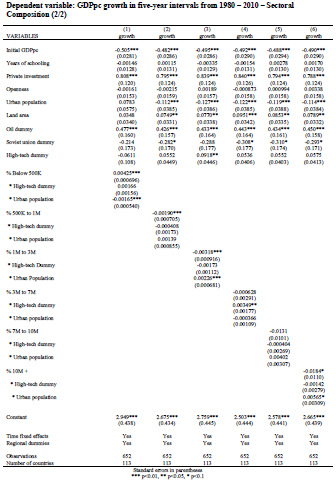
Finally, years of schooling and openness are not significant in our results. While these coefficients do not necessarily match expectations, they are not entirely surprising. Increases in years of schooling are unlikely to show an immediate effect on growth (Durlauf, Johnson, and Temple 2005). Likewise the results for different indicators of openness and trade integration have varied between studies with results frequently being insignificant (Durlauf, Johnson, and Temple 2005). Let us now turn to the results for our variable of interest: the share of the urban population living in cities of certain size categories (regressions 2 - 13). Each indicator is inserted in the model individually, as there is a clear interdependence between them – first alone and then with the interaction term. Three out of the six size categories have a significant coefficient when introduced alone; four of them once the interaction term of urban population is considered. The results here do not necessarily go along expectations. First, the percentage of the urban population living in cities below 500,000 inhabitants is positive and significant at the 1%. This indicates a positive relationship between a large share of people living in relatively small cities and growth. This result holds when we add the interaction term with the urban population, however it is nuanced by a negative sign on the interaction term. This points to the existence of an urban population threshold: the connection between the percentage of the urban population living in cities below 500,000 inhabitants is positive up to a total urban population of 12.3 million. Beyond that level, it turns negative. Hence, the growth promoting effect of small cities holds for the great majority of countries in our sample. 77 countries out of the 113 countries included in our regressions had urban populations of 12.5 million or less in 2010. In contrast, the coefficients for the urban population share in cities between 500,000 and 1 million inhabitants as well as between 1 million and 3 million are negative and significant at the 5% level. Countries with a higher share of their urban population in mid-sized cities have thus had a weaker economic performance. The introduction of the interaction term strengthens this relationship: the coefficients becoming significant at the 1% level. Both interaction terms are, however, positive and significant, meaning that the effect of the share of the urban population in cities with a population between 1 and 3 million turns positive for countries with an overall urban population of 4.8 million and at 3.8 million for cities between 500,000 and 1 million inhabitants. The influence of mid-sized cities is, thus, heavily affected by the country’s size. Beyond the 3 million threshold, the percentage of the urban population living in very large to megacities seems irrelevant for economic growth. All the coefficient for cities between 3 and 7 million inhabitants and from 7 million to 10 million are insignificant (Regressions 8-11). For the percentage of the urban population living in megacities of more than 10 million, the coefficient is also not relevant (Regression 12) and only becomes significant, once the interaction term is introduced (Regression 13). In this case, the association is negative: the bigger the share of population living in very large megacities, the lower the economic growth. The positive coefficient of the interaction term signals that this relationship is, however, not always pernicious for development. In countries with urban populations larger than 28.2 million – 25 out of the 113 countries in the sample in 2010 – the presence of megacities becomes a positive force for growth. However, the low level of significance – both coefficients at the 10% level – warrants some caution in the interpretation of these results. The fixed effects results included in Appendix 2 confirm the robustness of these findings. We, furthermore, run a number of additional regressions to stress-test the results. First, we estimate the model with alternative size categories, i.e. the percentage of the urban population living in cities above 1 million as well as the percentage of the urban population living in cities above 3 million inhabitants. The results suggest that the growth inducing or inhibiting effect of city size is indeed captured by the different categories employed in our regressions. The coefficients for 1M+ and its interaction with urban population mirror those for our 1M to 3M category results, while the 3M+ results are insignificant. Second, we test whether the significant results of the mid-sized cities categories, i.e. between 500k – 1M and between 1M and 3M, depend on how the remainder of the urban population is distributed in cities on both sides of these size categories. For this purpose, we add a 3M + category to the 1M – 3M regression and a 1M+ category to the 500K – 1M regression. The results remain largely unchanged with the exception of the interaction term of the 500K – 1M indicator with urban population. In our base case regression it is positive and significant at the 10% level. While the coefficient retains its positive sign once we include a control for the percentage of the urban population living in cities with more than 1M inhabitants, the low significance level is lost. Finally, we include primacy and the quadratic form of primacy as additional controls in the regressions to ensure the coefficients of the city size categories do not pick up the effect of urban concentration. The results hold throughout with the primacy term showing a negative association to growth when included alone and an insignificant one when included together with its squared term. This suggests that our main results reflect a city size effect independent of the urban structure. Overall, the additional regressions confirm our main results included in Table 1.3 Taken together, our results highlight two important facts. First, in contrast to expectations, most of the action takes place at the lower rather than at the upper end of the urban scale: small cities with a population of less than 500,000 inhabitants have been a source for economic dynamism. By contrast, a large share of the urban population living in cities between 500,000 and 3 million is detrimental for economic growth. Beyond that threshold, the size of cities in a country does not seem to affect its economic performance in a positive or a negative way. Second, the size of the country matters for the link between population living in cities of different sizes and growth: the positive connection between small cities (below 500,000) and national growth levels works best in relatively small countries while for countries with more than 12.3 million urban citizens, the relationship turns negative. The negative effect of the 500,000 to 3 million categories is only present in countries of up to 4 million urban inhabitants. Megacities beyond 10 million only fuel growth in countries with more than 28.5 million urbanites. Roughly speaking, small cities work best in relatively small countries, megacities in big countries. Medium-sized cities are only detrimental to economic growth in very small countries. Our results hence neither validate current wisdom about the relationship between different city sizes and growth nor refute it completely. As in Henderson (2003), the analysis points to a strong dependence of the impact of city size on the country’s overall population. As mentioned, large cities are more efficient in larger countries, small ones in smaller ones. However, the positive economic role of cities with a population of less than 500,000 in the analysis in the large majority of countries in the sample is something which has been overlooked by a literature which has overwhelmingly tended to place the emphasis on large cities (Martin and Ottaviano 2001; Rosenthal and Strange 2004). The results of the analysis stress that megacities become a force for aggregate economic dynamism only in the most populous countries, which make a small part of our sample. In fact, the greatest economic benefits have been extracted from the presence of relatively small cities of up to 3 million inhabitants rather than from the growth of megacities for most countries in the world. A number of potential explanations can be put forward. First, small cities may simply make it easier to manage urban diseconomies, arising through increasing city size in most parts of the world. Congestion, high rents, and pollution do not arise in small- and medium-sized cities to the same degree as in larger cities. The solutions to address diseconomies of scale are also often easier to implement. At the same time, small- and medium-sized cities still often deliver many of the benefits of large cities, for instance in terms of provision of public goods and efficiency of market interactions. Hence, smaller cities may on average maximise productivity without generating negative externalities. This is probably especially true in many developing countries, which struggle to provide an adequate urban infrastructure. A second explanation may relate to the levels of urban concentration that a larger share of the urban population in small cities imply. The results suggest a positive effect of small cities, which decreases the larger the urban population and eventually turns negative. We also detect a negative effect of cities between 500,000 and 3 million, which turns positive beyond an urban population threshold of roughly 4 million. Put together, these factors suggests that a relatively balanced urban structure within a given country is growth promoting, but that levels of urban concentration should not fall beyond a certain threshold as the positive interaction terms with urban population for cities between 500,000 and 3 million and the negative one for the cities below 500,000 suggests. Finally, the peculiarities of the data require some caution when interpreting the insignificant results for larger city categories. Only a limited number of countries in the sample have cities with a population of 3 million inhabitants or more (43 out of the 113). Hence, there are many observations where the percentage of the urban population in the size categories above 3 million is zero which may make it more difficult to obtain significant coefficients. However, it is worth pointing out that the results remain insignificant even if we combine these categories, i.e. the percentage of the urban population in cities above 3 million. This suggests that there is high heterogeneity in cities above this threshold: while some may be true motors of economic growth, as indicated by McCann and Acs (2011), others may be less so. City Size, Context and Economic GrowthRecent literature has shown that a variety of factors may shape the relationship between city size and economic growth (see literature section above). The sectoral composition of the economy, a country’s infrastructure endowment and the capacity of the national and city governments have been particularly emphasized in this regard. To explore these interactions, we rely on the same specifications as in the previous section and check through the introduction of additional variables whether a) the sectoral composition of economies, b) access to urban infrastructure and c) the institutional capacity affect how cities mould the economic growth of a country. While many other factors, such as borrowed city size, international linkages and the maturity of firms, may also influence the relationship, we analyse those factors for which information is more readily available Sectoral Composition To test for the potential influence of a country’s sectoral composition on how cities affect economic growth, we resort to export statistics for industries which, according to the literature, generate the largest agglomeration economies, namely market-oriented services and high-tech industries (Graham 2009; Henderson 2010). Countries where these industries are important should benefit more from larger cities than countries where these industries are more trivial. Table 2: Sectoral composition – Dependent variable: GDPpc growth in five-year intervals, 1980-2010
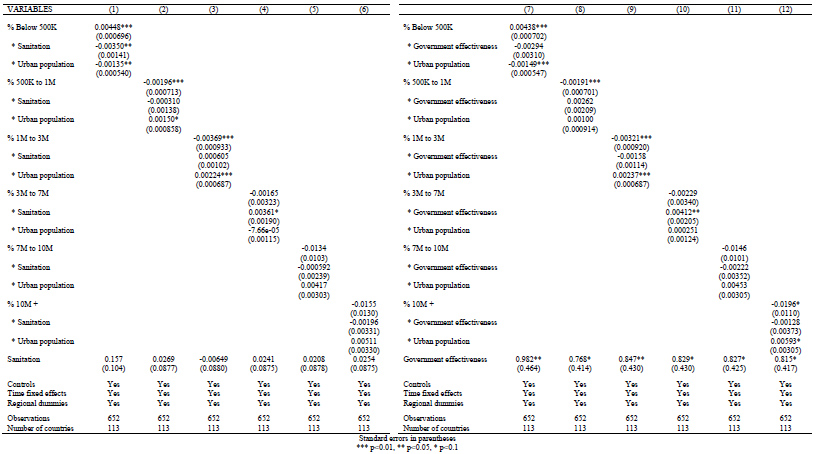
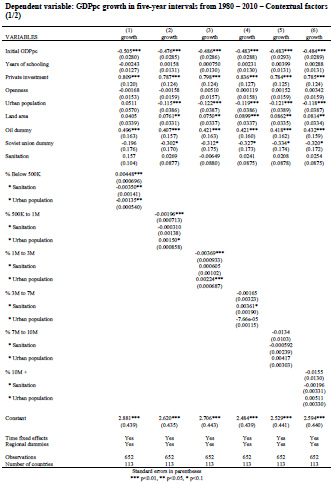
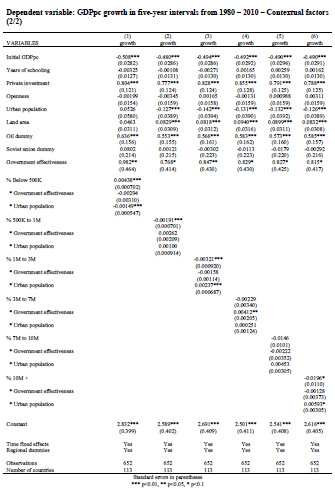
For market-oriented services, UNCTAD provides export statistics for 88 countries in our sample since the year 1980. Based on this, we calculate the share of service exports of total GDP as a measure of the intensity of services in the economy in each five-year period. Information on high-tech exports, namely the percentage of high-tech of overall manufacturing exports, can be obtained from the World Development Indicators since the year 1990. In order to maintain comparability with our base case results (1980-2010) and still be able to capture the variation of the export structure over time, we define a dummy variable for each five-year period to identify countries in which high-tech manufacturing plays an important role. The dummy takes the value of 1 if the share of high-tech goods of manufactured exports in a given five-year interval is larger than the 80th percentile of the overall observations (16.2%).4 For the vast majority of the countries the value remains constant throughout the period with data (1990-2010). We therefore assume them to be the same for the two five-year periods in the 1980s without data. In some special cases such as China and Costa Rica, where the export structure has changed significantly since the early 1990s, we account for this by assigning a 0 in the early periods and a 1 for later periods.5 The export measures are introduced into the regressions together with their interaction term with the city size categories. Table 2 shows the results: columns 1 – 6 for the service sector indicator and 7 – 12 for high-tech industries.6 Appendix 4 includes the FE results for these regressions. In both cases, the results for the city category below 500,000 remains unchanged with the main term being positive and the interaction term with urban population negative. For the 500,000 to 1 million category, the interaction term with service exports is positive, whereas the main term remains negative. This indicates that while the main negative effect holds, a strong service sector actually mitigates the negative connection of this type of cities and economic growth. In contrast, high-tech industries do not seem to affect this category. Similarly the 1M to 3M impact remains unaffected by the accounting for high-tech industries, while controlling for the service sector renders the impact insignificant. The most interesting effect can be observed in the 3 to 7 million category which is insignificant in our base case results. The interaction term for both services and high-tech is positive, while the main term and the interaction with urban population stay insignificant. This implies a growth promoting effect of cities between 3 and 7 million inhabitants provided that the service sector or the high-tech manufacturing industries play an important role in the economy. There are no changes for the 7 to 10 million category compared to the base case. The over 10 million becomes insignificant when including service exports in the analysis. We thus find that while most results from our base case hold when accounting for industry composition, countries can benefit from larger cities, i.e. a higher share of the urban population in cities between 3 and 7 million, provided that the country’s economy has a strong presence in sectors that benefit from agglomeration economies. This suggests that larger city size can indeed be growth promoting, but only under certain conditions. The fixed effects regressions included in Appendix 4 confirm these results. Context For the analysis of how context factors shape the relationship between city size and aggregate growth, we consider urban infrastructure and government capacity. As in Castells-Quintana (2017), the share of the urban population with access to improved sanitation facilities is used as a proxy for urban infrastructure. We build a dummy which takes the value of 1 if more than 90% of the urban population has access to sanitation in each five-year period.7 We cannot rely on the actual data since, as with high-tech exports, data are only available from 1990 onwards. For the two periods without actual data, i.e. 1980-1985 and 1986-1990, we assume that the dummy takes a value of 0 if a country does not pass the 90% threshold in 1990. Countries with a good urban infrastructure should be able to benefit more from larger cities. For government capacity, we rely on the World Governance Indicators. We specifically use the sub-indicator “governance effectiveness” which captures the quality of public services on a scale from -2.5 to 2.5. Data are available since 1996 only, so we calculate the average score for each country from 1996 to 2010. Based on this, we assign a dummy which equals one if the average score is 0.97 or above8 and zero if it is below.9 As with the sanitation dummy, countries with a higher level of government effectiveness are expected to be able to capture more of the benefits of larger cities. Table 3 presents the results: column 1 – 6 accounting for sanitation and 7 – 12 for government effectiveness.10 The base case results remain largely unaffected by the introduction of the two new control variables with two notable exceptions. Similarly to the industrial composition results, taking into account sanitation and government effectiveness makes cities between 3 to 7 million inhabitants a driver of growth as indicated by the positive and significant interaction term. This result is as anticipated: larger cities can be growth promoting provided that their urban infrastructure is sufficiently developed and the government is effective, including implementing those policies aimed at mitigating the negative externalities which come with large city size. The second notable difference is the interaction term between the percentage of the urban population living in cities with less than 500,000 inhabitants and sanitation. It is negative and significant at the 5% level. This implies that despite a main positive effect of a large share of people in small cities, this effect is smaller in countries with a well-developed urban infrastructure. The threshold of total urban population (as determined by the interaction between the city size category and urban population) where a larger share of the urban population in cities below 500,000 inhabitants becomes a negative factor for growth is also lower than in the base case analysis. Table 3: Contextual factors – Dependent variable: GDPpc growth in five-year intervals, 1980-2010
This finding is in line with Castells-Quintana (2017) who shows that, in particular in developing countries, city growth without the adequate provision of infrastructure results in inefficiencies, as urban diseconomies prevail over agglomeration benefits. Furthermore, they provide support for the hypothesis that the positive effect of cities below 500,000 results more often than not from the lack of capacity of numerous countries to manage the diseconomies of scale associated to larger cities. These results clearly need to be interpreted as directional as the dummies do not capture all the variation between countries and over time. However, they still emphasize the need to take each country’s context into account when analysing the link between city size and growth. ConclusionIn this paper we have analysed the link between city size and aggregate growth. Using a panel of 113 countries between 1980 and 2010, we have specifically explored whether there are certain city sizes that are growth enhancing and how additional factors highlighted in the literature impact the city size growth relationship. Our results suggest a non-linear relationship which is greatly dependent on the country’s size. A larger share of the urban population in small cities with less than 500,000 inhabitants is growth promoting in small- and medium-size countries (those with an urban population below 12.3 million). Conversely, the share of urban population living in medium-sized cities – defined as those between 500,000 and 3 million – limits economic growth in most small countries (those with an urban population roughly below 4 million), but facilitates economic dynamism beyond this threshold. Large populations living in megacities – defined as those beyond 10 million inhabitants – help growth only in relatively large countries, with an urban population of 28.5 million and more. Finally, cities between 3 and 10 million do not seem to have a systematic influence on growth at all. The analysis also showed that this relationship is highly context dependent: a high share of industries that benefit from agglomeration economies, a well-developed urban infrastructure and an adequate level of governance effectiveness allow countries to take advantage of agglomeration benefits from larger cities, i.e. between 3 and 7 million inhabitants. It also reduces the benefits of a large share of the urban population in small cities below 500,000 inhabitants. Our results thus suggest that larger cities, albeit not the very large metropoli, can indeed be drivers of growth, but only if the context is favourable. For many countries, smaller cities in fact provide a better balance between the advantages of cities and the diseconomies arising through growing cities. The results of our analysis should be interpreted with caution as data availability limits a more accurate measurement of the enabling sectoral composition and contextual factors. Similarly, the city size categories, while chosen to fit the OECD and other frequently used classifications, are still arbitrary and potentially camouflage greater complexity. Despite these caveats, our study adds important further nuance to the scarce empirical literature which links city size to aggregate economic performance and which tends to emphasize the benefits of increased city size (Brülhart and Sbergami 2009; Rosenthal and Strange 2004). By using more detailed indicators for the size of a country’s cities, it becomes evident that the benefits of increasing city size are not without limits and for many countries, smaller cities seem to offer a better balance. Furthermore, the findings complement the growing stream of literature that goes beyond city size to consider additional factors that shape the relationship between cities and economic growth (Camagni, Capello, and Caragliu 2015) and again emphasize the context dependency of the relationship. These findings are particularly pertinent in the current context in which – in contrast to previous centuries – the largest cities are now in developing countries and not in the developed world. A continued focus on the benefits of large cities over smaller ones without considering the context from policy makers and academics may lead to simplified and non-adequate policy recommendations, in particular in a developing country context. REFERENCESAhrend, R., E. Farchy, I. Kaplanis, and A. C. Lembcke. 2014. What Makes Cities More Productive? Evidence on the Role of Urban Governance from Five OECD Countries. In OECD Regional Development Working Papers. Paris: OECD Publishing. Alesina, A., E. Spolaore, and R. Wacziarg. 2005. Chapter 23 - Trade, Growth and the Size of Countries. In Handbook of Economic Growth, edited by P. Aghion and S. N. Durlauf, 1499-1542. Amsterdam: Elsevier. Alonso, W. 1973. Urban zero population growth. Daedalus (FAL):191-206. Au, C., and J. V. Henderson. 2006. Are Chinese Cities Too Small? Review of Economic Studies 73 (3):549-576. Baltagi, B. H., G. Bresson, and A. Pirotte. 2003. Fixed effects, random effects or Hausman-Taylor? A pretest estimator. Economics Letters 79 (3):361-369. Brülhart, M., and F. Sbergami. 2009. Agglomeration and growth: Cross-country evidence. Journal of Urban Economics 65 (1):48-63. Camagni, R., R. Capello, and A. Caragliu. 2013. One or infinite optimal city sizes? In search of an equilibrium size for cities. Annals of Regional Science 51 (2):309-341. Camagni, R., R. Capello, and A. Caragliu. 2015. The Rise of Second-Rank Cities: What Role for Agglomeration Economies? European Planning Studies 23 (6):1069-1089. Castells-Quintana, D. 2017. Malthus living in a slum: Urban concentration, infrastructure and economic growth. Journal of Urban Economics 98: 158-173 Castells-Quintana, D., and V. Royuela. 2014. Agglomeration, inequality and economic growth. Annals of Regional Science 52 (2):343-366. Chandler, T. 1987. Four thousand years of urban growth: an historical census. Lewiston, N.Y., U.S.A: St. David's University Press. Dijkstra, L., E. Garcilazo, and P. McCann. 2013. The Economic Performance of European Cities and City Regions: Myths and Realities. European Planning Studies 21 (3):334-354. Duranton, G. 2015. Growing through Cities in Developing Countries. World Bank Research Observer 30 (1):39-73. Duranton, G., and D. Puga. 2004. Chapter 48 - Micro-foundations of urban agglomeration economies. In Handbook of Regional and Urban Economics, edited by J.Vernon Henderson and J.F. Thisse, 2063-2117. Burlington: Elsevier. Durlauf, S. N., P. A. Johnson, and J. R. W. Temple. 2005. Chpater 8 - Growth Econometrics. In Handbook of Economic Growth, edited by P. Aghion and S. N. Durlauf, 555-677. Amsterdam: Elsevier. ESPON. 2012. Second Tier Cities and Territorial Development in Europe: Performance, Policies and Prospects. Faggio, G., O. Silva, and W. Strange. 2017. Heterogenous Agglomeration. Review of Economics and Statistics 99(1): 80-94. Frick, S. A., and A. Rodríguez-Pose. 2016. Average city size and economic growth. Cambridge Journal of Regions, Economy and Society 9 (2):301-318. Fujita, M., and J. F. Thisse. 2003. Does geographical agglomeration foster economic growth? And who gains and loses from it? Japanese Economic Review 54 (2):121-145. Glaeser, E. L. 2014. " world of cities: the causes and consequences of urbanization in poorer countries. Journal of the European Economic Association 12 (5):1154-1199. Glaeser, E. L., H. D. Kallal, J. A. Scheinkman, and A. Shleifer. 1992. Growth in cities. Journal of Political Economy 100 (6):1126-1152. Graham, D. J. 2009. Identifying urbanisation and localisation externalities in manufacturing and service industries. Papers in Regional Science 88 (1):63-84. Henderson, J. V. 2003. The urbanization process and economic growth: The so-what question. Journal of Economic Growth 8 (1):47-71. Henderson, J. V. 2010. Cities and Development. Journal of Regional Science 50 (1):515-540. Hoselitz, B. F. 1953. The Role of Cities in the Economic Growth of Underdeveloped Countries. Journal of Political Economy 61 (3):195-208. Krugman, P. 1991. Increasing Returns and Economic-Geography. Journal of Political Economy 99 (3):483-499. Krugman, P., and R. L. Elizondo. 1996. Trade policy and the Third World metropolis. Journal of Development Economics 49 (1):137-150. Lewis, A. W. 1954. Economic Development with Unlimited Supplies of Labour. The Manchester School 28 (2):139-191. Lucas, R. E. 1988. On the mechanics of economic development. Journal of Monetary Economics 22 (1):3-42. doi: 10.1016/0304-3932(88)90168-7. Marshall, A. 1890. Principles of economics. London, New York: Macmillan and Co. Martin, P., and G. I. P. Ottaviano. 2001. Growth and agglomeration. International Economic Review 42 (4):947-968. McCann, P., and Z. J. Acs. 2011. Globalization: Countries, Cities and Multinationals. Regional Studies 45 (1):17-32. Melo, P. C., D. J. Graham, and R. B. Noland. 2009. A meta-analysis of estimates of urban agglomeration economies. Regional Science and Urban Economics 39 (3):332-342. OECD. 2006. Competitive Cities in the Global Economy. Paris. Rigby, D. L., and W. M. Brown. 2015. Who Benefits from Agglomeration? Regional Studies 49 (1):28-43. Rodríguez-Pose, A. 2013. Do institutions matter for regional development?. Regional Studies 47 (7): 1034-1047. Romer, P. M. 1986. Increasing Returns and Long-Run Growth. Journal of Political Economy 94 (5):1002-1037. Rosenthal, S., and W. Strange. 2004. Chapter 49 - Evidence on the nature and sources of agglomeration economies. In Handbook of Regional and Urban Economics, edited by J. Vernon Henderson and J. F. Thisse, 2119-2171. Burlington: Elsevier. Sachs, J. D., A. Warner, A. Åslund, and S. Fischer. 1995. Economic Reform and the Process of Global Integration. Brookings Papers on Economic Activity 1995 (1):1-118. Sassen, S. 1991. The Global City. Princeton, NJ: Princeton University Press. Scott, A. J. 2001. Global City-regions Trends, Theory, Policy. Cambridge: Oxford University Press. United Nations. 2014. World Urbanization Prospects: The 2014 Revision. http://esa.un.org/unpd/wup/. World Bank. 2009. World Development Report 2009. Reshaping Economic Geography. Washington, D.C.: Author.
ACKNOWLEDGEMENTSThe authors are grateful to Dan Rickman, the editor of this paper, and to the anonymous reviewers for their insightful comments and suggestions to earlier versions of the paper.
NOTES* Susanne A. Frick and Andrés Rodríguez-Pose, Department of Geography and Environment, London School of Economics and Political Science (email: a.rodriguez-pose@lse.ac.uk) 1. Ultimately, any size threshold is arbitrary. Our goal is to provide a more nuanced analysis than studies thus far that rely on a unique threshold of 750,000 or 1,000,000. Resorting to the widely used city category definitions from OECD and the UN provides a helpful reference point for this purpose. 2. Estimating any relationship between factors related to urbanization, such as urban concentration and city size, on the one hand, and economic growth, on the other, faces the inherent challenge of reverse causality. Is growth promoted by city size or is the change in city size caused by growth? The reality is likely a combination of both. To remedy this, existing studies have either resorted to the use of dynamic GMM approaches (Brülhart and Sbergami 2009; Henderson 2003) or to the use of an instrumental variable design (Frick and Rodríguez-Pose 2016). In our case, both strategies are challenging. Given the large number of size categories, finding an instrument for each of them is not a viable strategy. Furthermore, the GMM approach tends to be unstable when the panel has few time periods, as in our case. We, therefore, rely on the more straightforward use of the standard country fixed effects model as well as the Hausman-Taylor (HT) estimator. Our results should be interpreted in light of this caveat. The HT results are presented in the main body of the text while the FE results for each regression are included in the appendix. The HT has the advantage over a fixed effects estimator that it allows for the inclusion of time-invariant variables in a panel setting, e.g. land area as well regional and oil dummies in our case (Baltagi, Bresson, and Pirotte 2003). This approach also permits the introduction of a number of interaction terms to address our second research question. The HT is essentially a combination of a fixed effects and a random effects estimator. For the time-varying variables, it works in a similar way to the fixed effects models, as it uses the within transformation of time-varying variables to estimate consistent coefficients. In contrast to the FE model however, the HT also estimates coefficients for the time-invariant variables. Since in our case, the time-invariant variables can be considered exogenous (e.g. land area), the resulting coefficients are not biased. 3. The results of all robustness tests are available upon request. 4. The average export share of high-tech exports of manufacturing exports remains relatively unchanged for the period with data, i.e. 8.9% in the 5 year period from 1991 to 1995 and 9.1% for 2006 to 2010. 5. This is the case in only 14 out of the 113 countries, including China, Costa Rica, Iceland and Hungary, where there is a clear trend with little high-tech exports in the early years and strong presence in the later. 6. The full results are included in Appendix 2. 7. The 90% threshold is chosen based on Castells-Quintana (2017), who finds that the impact of urban conentration on economic growth turns positive once 90% of the urban population has access to sanitation. 8. 0.97 equals the 80th percentile of the observations. 9. Most countries’ scores have not varied dramatically over the years. There are some cases where the difference between minimum and maximum score is larger than 1. However, these cases do not pass our defined threshold of 0.97 in any of the years. Thus, we believe the classification, while simplified, is accurate enough for our purpose. 10. The full results are included in Appendix 3. APPENDIX 1 - Data sources
APPENDIX 2 - Fixed Effect results for size categories and economic growth
APPENDIX 3 - Full results sectoral composition and context
APPENDIX 4 - Fixed Effects results sectoral composition and context
Note: This Research Bulletin has been published in Growth and Change, (2017), OnlineFirst |
||