GaWC Research Bulletin 459 |
|
|
|
This Research Bulletin has been published in World Development, 105 (2018), 156-170. doi:10.1016/j.worlddev.2017.12.034 Please refer to the published version when quoting the paper
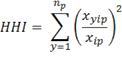
IntroductionMany countries have experienced sizeable shifts in the geographic distribution of their population over the past decades, in particular developing countries. Population growth paired with galloping urbanization rates have resulted in an increase in the size of some cities, shrinking population in others, and the birth of new cities. The perceived increasing concentration of people has received much attention in the literature in terms of its impact on different socio-economic aspects such as poverty reduction (Christiaensen, Weerdt, & Todo, 2013; Portes & Roberts, 2005; Sekkat, 2016), CO2 emissions (Makido, Dhakal, & Yamagata, 2012; Mohajeri, Gudmundsson, & French, 2015), and inequality (Castells-Quintana & Royuela, 2015; Oyvat, 2016). The question whether increasing agglomeration is beneficial for productivity and economic growth has been particularly high on the agenda. A growing number of academics and policy-makers have stressed the importance of urban concentration for economic growth: the concentration of people and firms in one place generates agglomeration economies and productivity gains through pooled labour markets, forward and backwards linkages, as well as knowledge spill-overs (Fujita & Thisse, 2003; Martin & Ottaviano, 2001; Romer, 1986; Rosenthal & Strange, 2004). Many studies even posit a trade-off between a spatially-balanced economic development (equity) and economic efficiency in the form of a greater concentration of population and economic activity in one place which may potentially lead to greater national economic growth (see Martin, 2008 for an overview). More concentrated urban structures – in particular at low levels of development – are frequently regarded as growth enhancing (Brülhart & Sbergami, 2009; Henderson, 2003; World Bank, 2009). Policies to stimulate economic development outside of the main cities are, in contrast, often regarded as inefficient and growth limiting. The literature on the topic, while extensive, has two important constraints. First, there is still limited information on how the levels of urban concentration have evolved across different countries in the world. While a few studies explicitly describe the patterns and evolution of urban concentration, the majority focuses on analysing what drives city size distribution within countries (Anthony, 2014; Moomaw, 2004). When they do analyse the patterns, studies often remain mainly cross-sectional (Short & Pinet‐Peralta, 2009) or, when they are longitudinal, they focus on a specific country or region (Aroca & Atienza, 2016; Behrens & Bala, 2013; Cuervo & Cuervo, 2013). Frequently, general references to the well-known higher levels of urban concentration in developing countries and their social consequences also suffice as an introduction to the topic (Castells-Quintana, 2016; Henderson, 2003; Venables, 2005). A more nuanced description is therefore desirable to understand the extent to which perception of increasing concentration matches reality. The second limitation relates to the measure of urban concentration. Most literature uses either levels of primacy i.e. the concentration of a country’s urban population in the largest city (Anthony, 2014; Behrens & Bala, 2013; Cuervo & Cuervo, 2013; Henderson, 2003) or the share of the urban population living in cities above a certain size threshold (Bertinelli & Strobl, 2007; Brülhart & Sbergami, 2009; Sekkat, 2016) as indicators of urban concentration. This is particularly true for studies looking at the link between urban concentration and growth, since both indicators have the advantage of being available for many countries over several periods. They do, however, only imperfectly portray the historical shifts occurring in many countries: the share of the population in cities of a certain size has little to say about the relative distribution of the urban population; and primacy only depicts changes in the largest city and the overall size of the urban population. In the few studies, in which more sophisticated indicators of concentration are used, the samples tend to be restricted to developed countries, mainly in Europe (Gardiner, Martin, & Tyler, 2011). Whether these lessons can be applied to today’s developing countries is increasingly called into question given the rapid urban transformations developing countries are undergoing and potential differences in their developing paths. Our study specifically aims to address these two gaps in our knowledge. By assembling an entire new dataset – which permits the construction of more nuanced indicators of urban concentration for a large number of countries – we first examine how the level of urban concentration has evolved between 1985 and 2010 across a large set of countries. Secondly, we assess how changes in urban concentration have affected economic growth in the same time period. We furthermore specifically test for differences in impact between developed and developing countries. Concerns about the potential reverse causality of the variables are addressed through instrumental variable (IV) analysis. The paper adopts the following structure. The next section discusses possible indicators to measure the level of urban concentration, introduces the new dataset and describes the evolution of urban concentration in our sample. The following section provides an overview of the relevant literature on the link between agglomeration and growth. Section 4 introduces the model, data as well the estimation strategy. Section 5 examines the impact of a country’s urban structure on its economic performance and discusses the results. The final chapter concludes and lays out some further areas for research. Change in urban concentrationIndices of Urban ConcentrationIn order to describe the evolution of the urban structure of different countries around the world, we consider a number of indicators. Most literature concerned with the topic relies either on (i) urban primacy, (ii) the share of the urban population living in cities above a certain size threshold, (iii) Zipf’s law, or (iv) the Herfindahl-Hirschman-Index (HHI). Among these four, primacy and the share of the urban population in cities above a certain size are the most widely used and have been particularly popular in research that considers the link between urban concentration and growth (Bertinelli & Strobl, 2007; Brülhart & Sbergami, 2009; Castells-Quintana, 2016; Henderson, 2003). Although there is no universally accepted definition of urban primacy, it is commonly referred to as the percentage of the urban population living in the largest city or the ratio between the population of the largest city over the sum of the population of the two to four next largest cities (Anthony, 2014; Moomaw, 2004; Short & Pinet‐Peralta, 2009). Similarly, different thresholds are used for the share of the population living in cities above a certain size, most prominently either 750,000 or 1 million inhabitants (Bertinelli & Strobl, 2007; Brülhart & Sbergami, 2009; Castells-Quintana & Royuela, 2014). The advantage of both indicators and thus their popularity in the literature rely on their availability for many countries and over a relatively long time period. This makes them particularly apt for use in panel regressions. As discussed in the introduction, there are, however, certain limitations when using these indicators. On the one hand, the percentage of the urban population, which lives in cities of a certain size, does not say much about the relative distribution of the urban population across cities: as long as we do not know across how many cities this percentage is split nor how large the remainder of the cities are, this indicator does not reveal much about a country’s urban structure. Primacy, on the other side, does address the question of the relative distribution of people across a country’s cities. However, the descriptive power of primacy also has limitations. Henderson (2003) argues that primacy is a good proxy for the entire urban structures since the largest city delineates the remainder of the urban structure, if Zipf’s Law holds. A brief examination of the latest World Urbanization Prospects data on city size (United Nations, 2014) however reveals a very different picture. The ratio of the largest city over the second largest city is on average 2.7 for developed countries and 3.9 for developing countries (it almost reaches the value of 10 in countries such as Afghanistan, Argentina, and Peru). This clearly violates Zipf’s law, where this ratio should be 2. Primacy is, thus, not well suited as a proxy to depict the full urban structure. Furthermore, both primacy and the percentage of the urban population, which lives in cities of a certain size, are highly sensitive to how countries define what constitutes the “urban population”. For instance in the UK, any settlement with 10,000 or more inhabitants is defined as urban; in the US, urban areas have 50,000 or more inhabitants, while urban clusters have between 2,500 and 50,000. Hence, the base over which both indicators is calculated may differ significantly across countries and bias the measurement. This leaves us with the above-mentioned Zipf’s law and the HHI as possible indicators to capture the level of concentration of a country’s urban structure. Firstly, Zipf’s law (also called rank size rule), describes an empirical phenomenon in which the size of a country’s cities follows a Pareto distribution (Zipf, 1949). This law suggests that the second largest city within a country is half the size of the largest, the third largest city has a third of the population of the largest city and so forth. We can visualize this relationship by plotting the log of the population of all cities (x-axis) against the log of the cities’ rank (y-axis): if the city size distribution follows Zipf’s law, a straight downward line emerges with a slope of -1. Theoretically, this coefficient could be used as a measure of urban concentration since a deviation either below or above a coefficient of -1 indicates more or less evenly distributed urban structures. In practice, however, the empirical literature on Zipf’s law has mainly aimed to test whether the law holds across different countries and not to describe the status and evolution of a country’s urban structure (Giesen & Südekum, 2011; Ioannides & Overman, 2003; Rosen & Resnick, 1980; Soo, 2005). This is due to the fact that in order to calculate the coefficient, information on a large amount of cities and, in the case of time series analysis, over multiple time periods is needed. Most studies requiring a time-series indicator for urban concentration have, therefore, resorted to the above-mentioned primacy or urban population share. The final option is the Herfindahl-Hirschman-Index (HHI). The HHI is frequently used in different disciplines to measure concentration and is defined as follows in an urban context:
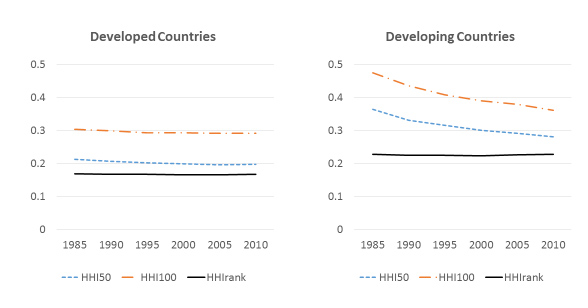
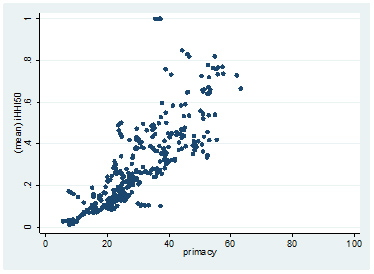
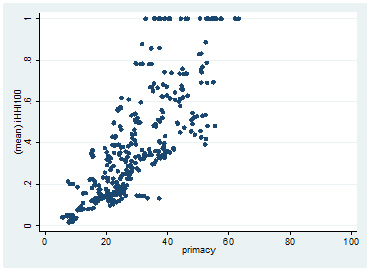
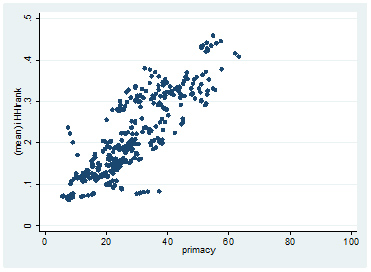
where xyip = population of city y in country i in the beginning of period p The HHI is the sum of the squared shares of each city’s contribution to the overall urban population in the beginning of period p. It takes values between 1/n and 1, where 1 indicates complete concentration. A number of authors emphasize the desirability of using the HHI as opposed to other indicators for urban concentration due to its superiority in describing the full city size distribution (Castells-Quintana, 2016; Henderson, 2003). Due to the data requirements for its calculation, it has, however, been rarely used (Wheaton & Shishido, 1981). Based on this discussion, it is clear that Zipf’s law and the HHI are more suited than primacy and the share of the urban population living in cities above a certain size to examine a country’s urban structure. Between the two, there is no clear advantage of one over the other in terms of their explanatory power. Our choice therefore falls on the HHI for practical purposes: the HHI is simpler to calculate for a large amount of countries and over multiple time periods. City Population DatasetIn order to calculate the HHI, a new city population dataset has been built from scratch. The dataset covers 68 countries over the period 1985 to 2010. For each country, the dataset contains information about the population of its cities at different points in time.1 The data was sourced from census data for each country available on citypopulation.de (Brinkhoff, no date) and complemented with information from the 2014 edition of the World Urbanization Prospects (United Nations, 2014).2 Different world regions are well represented in the dataset with a relatively even distribution between Africa (19%), Americas (21%), Asia (25%), Europe (32%) and Oceania (3%) (Appendix 1 provides the details). As census years vary from country to country, the data are projected to achieve a balanced dataset with information gathered in five-year intervals.3 A frequent concern with population data for cities is whether the statistic counts the population within the administrative boundaries of a city only or that of the overall agglomeration (which may include several cities from an administrative point of view). For example, the administrative boundaries of Paris suggest a population of 2.2 million and a growth of around 1% since the early 1980s. If we however consider the agglomeration, Paris looks very different in terms of its population numbers i.e. with a population of around 10.6 million and a growth of 15% over the past three decades.4 As we are interested in the external economies arising through the concentration of people and these external economies do not stop at administrative boundaries, we adjust the population data to account for the size of the actual agglomerations, for those countries where agglomeration data are not readily available. For this purpose, the contiguous boundaries of an agglomeration were defined through the inspection of satellite imagery, and the population of the administrative cities within these boundaries was added up.5 With these data at hand, the HHI was calculated. As with other measures related to urbanization and cities, the HHI is sensitive to aggregation bias, i.e. to the number of cities included in its calculation. Since there is no universally applicable rule to determine what this number should be, we follow the approach suggested by Cheshire (1999) and Rosen and Resnick (1980) and calculate the HHI in multiple ways: 1) based on a size cut-off, including all cities above a certain size threshold and 2) based on a specified number of cities, independent of size. Using a size cut-off allows us to include all cities considered big enough to generate agglomeration economies. However, using the size cut-off leads to a very different treatment of small and large countries. Small countries often only have a few cities with a population above the defined threshold. Resorting to a specified number of cities solves this problem, but limits the indicator to the upper tail of the city distribution for large countries. This may affect results, for instance in the case of China, where there are more than 100 cities with more than one million inhabitants today. By contrast, in smaller countries with few cities, the indicator includes more cities than if based exclusively on a size cut-off. We experiment with both approaches and calculate the following urban agglomeration measures: a) HHI50 includes all cities of a country with 50,000 or more inhabitants; b) HHI100 all cities with 100,000 inhabitants or more; and c) HHIrank includes the 25 largest cities of a country, independent of their size. As any particular threshold of inclusion of cities is bound to be controversial, we have resorted to two different cut-offs in our calculation of HHI: HHI50 and HHI100. The aim is to assess the extent to which the choice of cut-off may affect the overall. Practical considerations in terms of data availability as well as the desire to reflect a country’s urban structure as fully as possible guided the decision on the selection of specific thresholds.6 The comparison between the three HHIs and primacy show a good correlation with the correlation being particularly close for relatively low levels of urban concentration (see Appendix 2 for the correlation charts). However, the spread becomes increasingly large as we move to higher levels. There, countries with similar levels of primacy display different HHI values. Namibia, Peru, and Uganda, for instance, have similar primacy levels of around 35% to 40% for much of the period of analysis. Their HHI indicators, however, reflect much higher levels of concentration for Namibia and Uganda, while being similar to the primacy indicator in the case of Peru. When scrutinising these cases in greater detail,, primacy seems to underestimate urban concentration in countries where there is essentially one large city at the apex of the urban structure, with a few much smaller – and, in some cases, virtually non-existent – secondary towns (such as Namibia or Mongolia). Even in these cases primacy rarely reaches levels above 35-45%. A potential explanation of these figures lays in the fact that primacy numbers depend on each country’s definition of the urban threshold. Moreover, primacy numbers often do not take into account agglomerations boundaries. The HHIs have the important advantage that the threshold over which it is calculated is defined uniformly across the dataset, making the indicator clear and comparable between countries. Evolution of Urban ConcentrationEquipped with the three defined HHI indices, we analyse the evolution of urban concentration from 1985 to 2010. Figure 1 plots the average of the different HHIs dividing the sample into developed and developing countries.7 Three insights emerge from Figure 1. First, there are marked differences in the levels of urban concentration. Developed countries have much less concentrated urban structures than developing countries across the three indicators. The difference is particularly marked for HHI50 and HHI100, despite a significant decrease in these indicators for developing countries over the period of analysis. Figure 1 Evolution of urban concentration 1985–2010
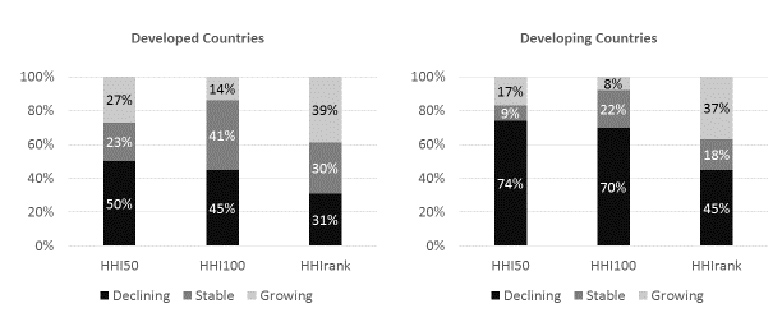
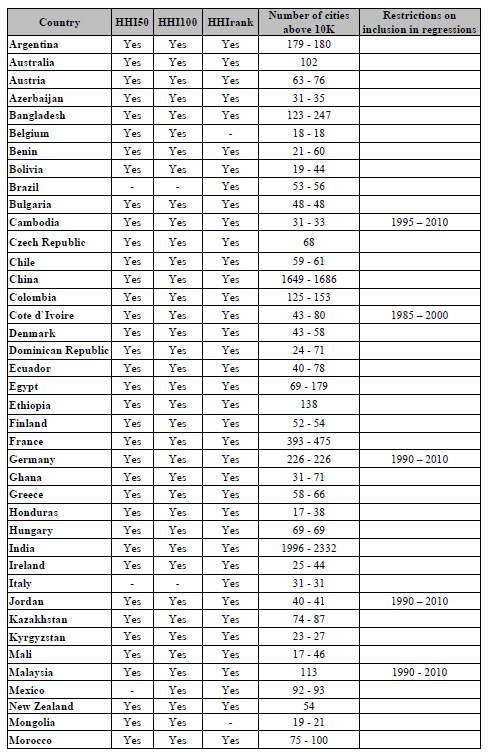
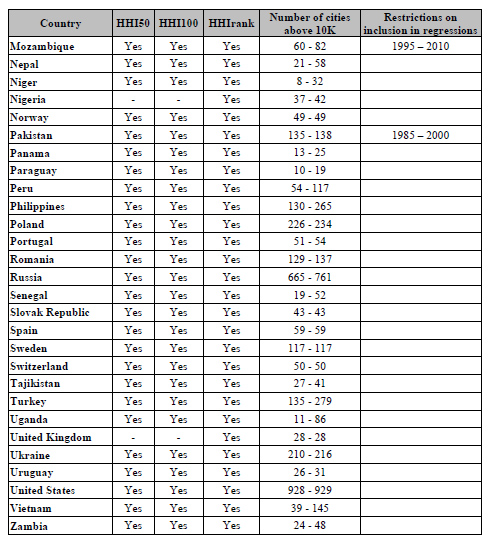
Second, the average levels of concentration have remained relatively stable for developed countries during the period of analysis, but have changed dramatically in developing countries. While the average level of HHI50 and HHI100 in developing countries was higher than in developed countries, it decreased sharply in the former (from 0.36 to 0.28 and 0.48 to 0.36 respectively), pointing to a decreasing concentration of the urban population. This trend can be partially attributed to the rapid urbanisation process in the emerging world. The number of people living in cities doubled in middle-income countries between 1985 and 2010 and almost tripled in the least developed countries.8 This has resulted in the birth of new cities and rapidly growing urban populations across the spectrum of city sizes. The number of cities which pass the threshold for inclusion in the calculation of the indices consequently increased which, in turn, enlarged the base over which the HHI is calculated. Finally, there are differences between the indicators in terms of their evolution. The average of the HHI50 and HHI100 indicators declined – albeit at a different pace – for both developed and developing countries, suggesting lower concentration levels. In contrast, the average HHIrank indicator remained stable for both groups of countries. Moving beyond average levels reveals greater heterogeneity between and within the indicators. Figure 2 shows the percentage of countries in which the different indicators either displayed a declining, a stable or a growing urban concentration. The “declining” category comprises countries whose urban concentration levels decreased by more than 5%; “stable” countries hovered around +/- 5% from their initial level; and “growing” includes the countries whose indicator increased by more than 5%. Again, the sample is split into developed and developing countries. Figure 2 Evolution of urban concentration 19852010, by category
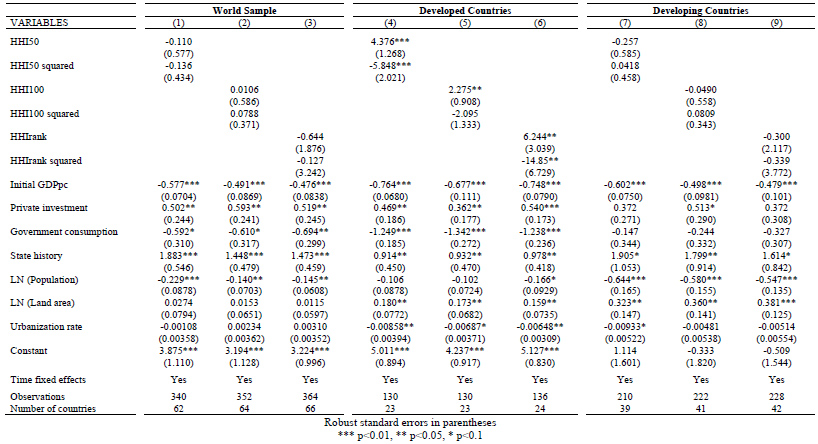
For the developed countries sample, Figure 2 unveils much greater diversity in urban concentration changes than the relatively stable averages of Figure 1 suggest. For HHI50 and HHIrank, the stable group represents the smallest of the three groups (23% and 30% respectively), while for the HHI100 – where it is the second group – 41% fall into this category. The large majority of developed countries have experienced significant changes in their urban structure. The picture differs by indicator: HHI50 and HHI100 indicate that more countries had less concentrated urban structures in 2010 compared to 1985. According to the HHIrank, however, almost four out of ten developed countries had more concentrated urban structures in 2010 than in 1985. Only three out of ten had less concentration. Countries within the increasing group include Spain, Norway, New Zealand, and the UK; Australia, Hungary, and the US belong in the decreasing group. Among developing countries, the picture is more homogenous. Driven by increasing urbanization rates and a general increase in the size of cities, an overwhelming majority of the countries became less concentrated during the period of analysis (as measured by HHI50 and HHI100). When considering the HHIrank, the decreasing group – while not representing the majority of countries – is still the largest group. However, the development is again more diverse for the HHIrank with its fixed number of cities. Almost the same percentage of countries witnessed an increase as a decrease in concentration levels (37% vs 45%). There are clear geographical differences within these groups. The large majority of Latin American countries saw their levels of urban concentration decline regardless of the indicator considered. Many Asian countries, in contrast, had increasing levels of urban concentration, in particular when considering the HHIrank. One in two Asian countries is more concentrated today than in 1985. The same is true for Africa, where the picture however differs strongly between the indicators. The majority of African countries experienced increased levels of urban concentration for the HHIrank indicator, while the contrary is true for HHI100 and HHI50. On average, countries have, thus, become less concentrated since 1985 (HHI50 and HHI100). There is limited evidence of significantly more concentrated urban structures (HHIrank). This finding is at odds with the general perception of heightened urban concentration in many countries. Going beyond the averages, however, helps to reconcile this apparent contradiction to a certain degree: individual countries both in the developing and developed world have experienced strong changes in their urban structure. If we consider the HHIrank indicator, with its fixed number of cities, there are as many countries with a more concentrated urban structure as with a less concentrated one. Furthermore, developing countries still remain more concentrated than developed countries which may have contributed to the general perception of increasing concentration. The differences in the results for the HHI indicators also show that passing judgement on whether we live in a world with more concentration or with less concentration ultimately depends on what we deem to be the most adequate indicator of urban concentration. Each indicator captures a slightly different development and has its advantages as well as disadvantages. Urban concentration and economic growthTurning to our second research question, we analyse how the above described evolution of urban concentration has impacted the countries’ economic performance. Whether a country’s urban structure and, more generally speaking, its degree of agglomeration have a bearing on economic development and growth has long attracted the interest of researchers. Already more than a century ago, Alfred Marshall’s seminal work on industrial districts (1890) described the productivity gains which companies experience by co-locating with other companies. Six decades later, Williamson (1965) coined the idea of an inverted U–shaped relationship between agglomeration and economic development. In this U-shaped function, levels of concentration rise with economic development and subsequently fall beyond a certain economic development threshold. The interest on the topic has not faded away and an increasing number of researchers has sought to find support for a relationship and to determine the direction of causation. In recent years, New Economic Geography (NEG) and the System of Cities literature have further increased the prominence of the question. The NEG literature stresses the economic benefits arising from concentrated urban structures. In the basic NEG framework, the balance between centripetal and centrifugal forces determines the location of economic activity and population within a country (Fujita, Krugman, & Venables, 1999; Krugman, 1991). On the one hand, concentration creates economic benefits in the form of centripetal forces, such as forward and backward linkages, thick labour markets, and localized knowledge spill-overs. These generate economic efficiency and incentivize even more demographic and economic concentration. On the other hand, urban concentration also gives raise to centrifugal forces, such as congestion, immobile factors, and increasing land rents. These work against the agglomeration benefits and disperse activity into other regions of the country. Based on this framework, several models have been proposed to examine the effect of a country’s level of concentration on economic growth and vice versa. In Fujita and Thisse (2003), localized knowledge spill-overs act as a strong centripetal force. The concentration of economic activity and population is assumed to be welfare enhancing provided that the trickle-down effect is strong enough (Fujita & Thisse, 2003). Martin and Ottaviano (2001) similarly postulate that agglomeration spurs economic growth, as it lowers the costs of innovation through pecuniary externalities. Furthermore, growth fosters agglomeration as new firms tend to locate close to other innovative firms, making economic development and agglomeration mutually reinforcing (Martin & Ottaviano, 2001). Puga and Venables (1996) take a slightly different angle by stressing the role of pecuniary externalities as drivers of industrial location. They find that, as economies grow, increases in wages in dynamic areas eventually push some firms to relocate to lower wage regions. Consequently, wage differentials between regions first increase, before decreasing. This finding is in line with Williamson’s (1965) U-shaped curve. Overall, the theoretical NEG literature, thus, considers agglomeration beneficial for economic growth. More urban concentration is, hence, advantageous from an economic development point of view. The urban economics literature takes a more cautious stand on this question. While it emphasizes a positive effect of increased city size and agglomeration on productivity, it also recognizes that a highly concentrated urban structure could be growth hindering (Abdel-Rahman & Anas, 2004; Henderson, 2005). Similar to NEG, urban economists consider that agglomerations generate external scale economies through the sharing and matching of inputs, people, and ideas (Duranton & Puga, 2004). However, these benefits from increasing city population are at some point outweighed by urban diseconomies, such as congestion and high land rents. A U-shaped trajectory is in evidence again: productivity increases with city size up to the threshold where congestion costs cause productivity to start falling. Workers and firms would thus benefit from a move to another city, creating a more balanced urban structure. Coordination failure, however, may stop people from doing so, as an individual actor is not compensated for the external benefits it creates for others. This, in turn, may lead to the emergence of strongly concentrated urban structures, with the majority of the urban population in one city. Venables (2005) even maintains that highly concentrated urban structures may confine countries to low economic development. As negative externalities reduce the returns to job creation, they slow down economic development. In the presence of low growth, it becomes more difficult to start a new city, leading to urban systems that are growth inhibiting rather than enhancing (Venables, 2005). Thus, from the theoretical urban economics perspective, whether a country’s level of urban concentration is growth enhancing or not depends on whether the concentration of the population in a country’s prime city is perceived to be already beyond the tipping point or not. A growing body of empirical literature aims to test the predictions of the theoretical models on the relationship between agglomeration and economic growth. A first group of studies specifically examines the relationship between urban concentration and economic growth at the national level, using country-level panel data (Bertinelli & Strobl, 2007; Brülhart & Sbergami, 2009; Castells-Quintana & Royuela, 2014; Henderson, 2003). The studies resort to the aforementioned primacy indicator and/or the percentage of the urban population living in cities above a certain size as measures for the level of population concentration. They find a positive relationship between urban concentration and economic growth, although this conclusion is nuanced by a negative sign on the interaction term with GDP per capita. This implies that urban concentration may be particularly important at early stages of economic development. Some studies point to important regional differences in this relationship. Pholo-Bala (2009) concludes that the relationship between urban concentration and economic growth is far from uniform across different groups of countries. While in the case of Europe the positive relationship holds, a growth trap at medium levels of urban concentration exists in Asia and Latin America. Results for Africa are highly dependent on the measure of urban structure employed (Pholo-Bala, 2009). Similarly Castells-Quintana (2016) identifies a potentially detrimental effect of urban concentration in African countries. A second group of studies is mainly based on European data and measures agglomeration by the degree of concentration of economic activities, as opposed to urban population concentration. While economic and urban concentration are not equivalent, they tend to go hand in hand. Results emerging from this literature may thus still be informative, in particularly since these studies usually rely on a more diverse and more nuanced set of indicators than the literature on urban concentration. Interestingly, the findings in this group are more mixed and depend on the measure employed and scale of analysis. Barrios and Strobl (2009), using the standard deviation of log of regional GDP per capita by country, identify the existence of an inverted u-curve for the relationship between GDP per capita and regional inequalities. Crozet and Koenig (2007) look at whether intra-regional inequality in GDP per capita spurs regional growth in European regions and find a positive relationship, but only in Northern countries. Gardiner et al. (2011) highlight that results depend on the spatial measure and scale used, implying that there is no unambiguous relationship between agglomeration and regional growth. Other research suggests a negative effect of agglomeration on economic growth. Bosker (2007) reports that a higher employment density translates into a lower growth rate, while Sbergami (2002) shows that more equal distribution of economic activities across regions spurs the national growth. Consequently, the empirical literature on the link between agglomeration and national economic performance is inconclusive. Studies using measures of population concentration generally suggest that a concentrated urban structure is conducive to economic growth up to a certain threshold of economic development, but also point to important regional differences depending on levels of development. The results are also often beleaguered by their reliance on rather crude indicators. Where indicators are more sophisticated, as for the studies on economic agglomeration, studies tend to focus almost exclusively on the European experience. This calls into question the ability to generalise these results, especially to developing countries. Model and dataIn order to analyse the effect of urban concentration on national economic growth, we follow the existing literature on the topic (Brülhart & Sbergami, 2009; Castells-Quintana, 2016; Henderson, 2003) and specify a simple economic growth model. In this model the dependent variable – GDP per capita growth over five-year intervals – is explained by our different HHI indicators, GDP per capita at the beginning of the period, and a set of control variables. Our model takes the following structure:
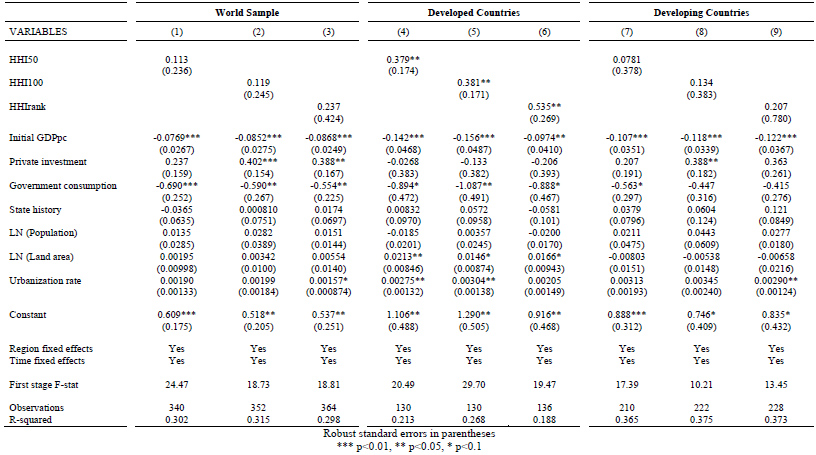
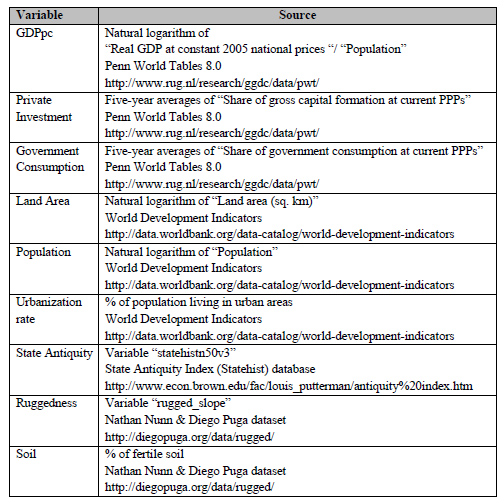
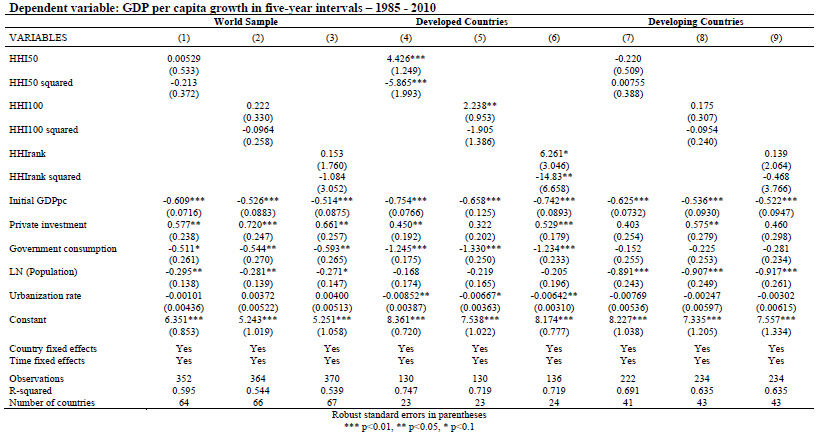
Our variable of interest is HHIip, the measure of the level of urban concentration in each country i at the beginning of period p. The three different versions of the HHI, as introduced in the section on the evolution of urban concentration, are used in the analysis. To allow for a possible non-linear relationship between urban concentration and growth, we also add the second order polynomials, following Henderson (2003) and Brülhart and Sbergami (2009). Furthermore, two sets of controls variables are included in the regressions. The first set of controls comprises those generally integrated in cross-country growth regressions. These are: a) GDP per capita at the beginning of the period, to control for conditional convergence. Countries with a lower GDP per capita are expected to display higher growth rates according to the neo-classical growth model, thus the coefficient should be negative (Durlauf, Johnson, & Temple, 2005); b) private investment, which should be a driver of economic growth because of its contribution to a country’s capital stock; and c) government consumption as a percentage of GDP, given its potential crowding-out effect on private investment. The second set of controls comprises variables which are more directly related to a country’s urban structure, while possibly also influencing a country’s growth pattern. We control both for the physical size of a country (land area) and the size of its population. Both variables may affect a country’s urban structure. Small countries (both in terms of dimension and population) are likely to have a lower number of cities. This generally implies a greater urban concentration than larger countries. Furthermore, a country’s size also reflects its market potential – larger countries tend to be more attractive to investors – and thus can influence economic performance (Alesina, Spolaore, & Wacziarg, 2005). Finally, we include a control for a country’s political stability and institutional quality, which may both influence a country’s urban structure (Ades & Glaeser, 1995) as well as its growth performance. For this purpose we use the state antiquity index (Putterman and Bockstette, 2012). The indicator measures for every 50 year period since 1 A.D. a) if there was a central government, b) what percentage of a country’s current land mass was governed by this government, and c) whether the government was indigenous or foreign. Bockstette, Chanda and Putterman (2002) demonstrate that this indicator is strongly correlated with a country’s current institutional ability. Using a historical indicator for institutional quality has the advantage that it is not influenced by today’s growth performance, thus we do not need to worry about reverse causality between the indicator and economic growth. Furthermore, alternative indicators such as the World Governance Indicators are only available since the mid-nineties, thus limiting their use in panel regressions. All regressions include time fixed effects and robust standard errors.9 GDP per capita growth, initial GDP per capita, private, and government investment are sourced from the eighth edition of the Penn World Tables. Population size, urbanization rate, and land area stem from the World Development Indicators. As mentioned, the state antiquity indicator is derived from Putterman and Bockstette’s dataset. Appendix 3 includes a detailed overview of the specific variables used in the analysis and their data sources. We estimate the model using the Hausman-Taylor (HT) estimator to allow for the inclusion of time-invariant variables “land area” and “state antiquity” in a panel setting (Baltagi, Bresson, & Pirotte, 2003). As in the case of fixed effects models, HT uses the within transformation of time-varying variables to estimate consistent coefficients for these variables. It also uses individual means of the time variant regressors as instruments for the time invariant variables. We also report the results of the standard country fixed effects estimator in Appendix 4. In order to test the robustness of the HT and fixed effect results and address concerns of reverse causality, we resort to an instrumental variable design, which relies on a country’s physical geographical characteristics as instruments. The rationale for the instruments and results of the robustness check are presented in a separate section. ResultsMain ResultsTable 1 shows the results for the HT estimator. Columns 1 – 3 present the results for the world sample, columns 4 – 6 for developed, and columns 7 – 9 for developing countries. The general model works well and the control variables show the expected signs. GDP per capita at the beginning of the period is negative and significant at the 1% level throughout all estimations, pointing towards a conditional catching-up process independent of the data sample considered. Private investment is positive and significant in seven of nine regressions, with the results being weaker for the developing countries sample. Government consumption retains a negative coefficient throughout all estimates and is significant in the world and the developed countries sample, indicating a possible crowding out of private investments. The indicator for state history is positive and significant in all estimates. This emphasizes the importance of institutions for a country’s economic performance. The results for the control variables which are more directly related to a country’s urban structure, namely its population, land size and urbanization rate, vary somewhat by sample. Population is negative throughout, but insignificant in the developed countries sample. Land area is positive and significant when considering both samples individually, but not in the world sample. The level of urbanization is weakly correlated with GDP per capita growth for developed countries, but not for developing countries. Turning to our variables of interest, we find that none of our urban concentration indices (HHIs) or their squared terms displays a significant correlation with economic growth in the world sample (columns 1 to 3). This would – in contrast to some of the previous empirical studies – suggest that a country’s urban structure plays a minor role, if at all, in its growth performance. However, once the sample is divided into developed and developing countries, a clearer picture emerges (columns 4 to 9). For the developed countries group (columns 4 to 6), the coefficients are consistently significant. The main terms of HHI50, HHI100 and HHIrank are positive and significant at the 1% or 5% level. The squared terms of the corresponding HHI are negative, but only significant for the HHI50 and HHIrank indicator. This indicates a positive correlation between urban concentration and economic growth for developed countries, which decreases as urban agglomeration increases. Table 1 Dependent variable: GDP per capita growth in five-year intervals, 19852010
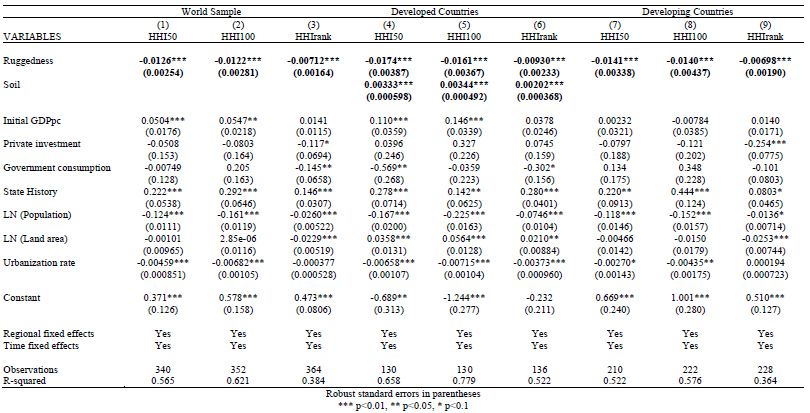
Urban concentration in developing countries has, by contrast, no effect on economic growth. As in the case of the results for the world sample (columns 1 to 3), none of the HHI indicators or their squared terms is significant (Columns 7 to 9). This suggests that in the developing and emerging world – and contrary to what is postulated in the World Development Report 2009 (World Bank, 2009) – urban agglomeration cannot be considered a factor in the promotion of greater economic growth. The country fixed effects results (included in Appendix 4) confirm the findings of Table 1. Urban concentration is growth promoting in developed countries, while it does not seem to have a systematic effect in developing countries.10 Robustness CheckA recurring concern in the study of the relationship between urbanization, agglomeration and economic development is the question of reverse causality. Does the urban structure of a country drive economic growth or does economic growth drive urban concentration? The reality is likely to be a mix of both. To confirm the robustness of our results, we need to identify the effect flowing from urban concentration to economic growth. In order to do that, we rely on an instrumental variable (IV) design. The aim is to see whether an IV approach confirms the results reported in Table 1 and in Appendix 4. For the purpose of the IV analysis, we need a suitable instrument which is a) relevant, i.e. is driving the urban structure of a country and b) exogenous, i.e. not in any way associated with the country’s economic growth performance other than through its impact on the urban structure. As city formation is strongly path dependent, i.e. cities persist and often thrive in the places where they were originally founded (Bleakley & Lin, 2012), the drivers of city formation in the past may provide suitable instruments, capable of predicting a country’s urban structure today. Geographical factors have been crucial for the establishment of cities. Cities have been traditionally set up in areas with suitable terrain and easy access to water and fertile land. Proximity to fertile land as a means to secure a regular food supply for the city’s population has been the paramount criterion for the establishment of cities (Motamed, Florax, & Masters, 2014). A large supply of fertile land has contributed to the development of larger cities and thus more concentrated urban structures. Limited access to fertile, arable land, by contrast, may have encouraged the formation of smaller cities and therefore provided the foundation for the development of a more balanced urban structure today. Ruggedness also affects the suitability of the land to build cities and in particular to trade between places (Nunn & Puga, 2012). Where the terrain is very rugged, roads and communication systems were difficult to build connecting different points in the country. It is therefore likely that countries with a rugged terrain developed several cities in the territory that served as commercial, trading, and population hubs for specific areas of the country. Ruggedness should therefore lead to less concentrated urban structures. We therefore consider these two geographical properties to determine the suitability of countries to develop large cities and more or less balanced systems of cities. Concerning the exogeneity of these indicators, it is conceivable that both the soil quality and the ruggedness of a country may impact a country’s overall level of economic development and, through this, current economic growth performance. A look at our dataset, however, does not reveal any clear correlations. The simple correlation between the share of fertile land in a country and GDPpc growth is -0.03. That between ruggedness and economic growth: -0.02. These very low correlations are an indication that while these factors may have determined the formation of cities and systems of cities in the past, their role in providing urban prosperity today is almost non-existent. The examples below confirm this notion. Some countries with a large percentage of fertile land, such as Benin or the Philippines, are poor, whilst others with similar access to fertile land are highly developed (e.g. France, Germany). Similarly, some countries with high levels of ruggedness are highly developed (e.g. Switzerland, Greece), while others are at the bottom of the pyramid (e.g. Nepal, Rwanda). This lack of correlation between first-nature geography and economic performance is reinforce the work of Acemoglu, Johnson, and Robinson (2002) or Ketterer and Rodríguez-Pose (2016) who show that, once institutions while controlled for, geography does not matter for long-term economic development. For the sake of simplicity, we only include the main term of the HHIs in the IV regression. We estimate the model using a pooled 2SLS estimator with robust standard errors, as our instruments are time-invariant and we can therefore not run the regressions in a panel setting. All control variables remain the same as in the main regression. Furthermore, we add regional dummies in order to account for some of the heterogeneity between the regions. Table 2 displays the second stage results. Our instruments work well with the first stage F-statistics passing comfortably the rule of thumb threshold for strong instruments proposed by Staiger and Stock (1997) and also exceeding the Hausman, Stock and Yogo (2005) threshold values.11 The first step regressions are included in Appendix 5. The coefficients of the IV analysis confirm our main results from Table 1 and Appendix 4. All HHI indicators are insignificant in the world and developing countries samples, while HHIs are positive and significant in the developed country sample (Table 2). Thus, the positive impact of urban concentration on economic growth is confirmed only for developed countries. Table 2 IV-estimates Dependent variable: GDP per capita growth, 19852010
DiscussionThe results have interesting implications both for the empirical and the theoretical literature. From an empirical perspective, they contradict the main tenet in the literature (Bertinelli & Strobl, 2007; Brülhart & Sbergami, 2009; Henderson, 2003), that agglomeration economies are particularly important at early stages of economic development. The results suggest that, in fact, for lower levels of economic development, urban concentration seems to be wholly disconnected from a country’s economic performance. A number of potential explanations can be considered. First, as we show in section 2.2, primacy may underestimate urban concentration in settings with dominant prime cities. This is more frequently the case in developing than in developed countries and may therefore particularly affect the results for the developing country sample. Second, the contrasting results may be driven by the differing periods of analysis. It is well known that different sectors benefit from agglomeration economies to a varying degree with high-tech industries and the professional services sectors among those that benefit the most (see for example Graham, 2009; Henderson, 2010). This is relevant for our results, as these sectors have become increasingly central since the 1980s and are primarily prevalent in high-income countries. While our analysis covers precisely this period of change, Henderson (2003), Bertinelli and Strobl (2007), and Brülhart and Sbergami (2009) cover earlier periods and are thus not be able to capture this effect in their analyses. In light of this, the positive results for high-income countries are well justified. Similarly, continued high levels of urban concentration have gone hand in hand with ever increasing city sizes in developing countries. While the average size of the largest city in each country grew by around 20% between 1985 and 2010 in developed countries, the size of the largest city in a given developing country more than doubled in the same period, from an average of 1.8 million to 4 million inhabitants (numbers based on United Nations, 2014). The relative growth of city size in developing countries was similar for the period between 1960 and 1985 (from an average of 0.85 million to 1.8 million), but the absolute increases as well as the levels became much larger in the latter period. This development may lead to a prevalence of urban diseconomies of scale – congestion, pollution, emergence of large slums – as well as other diseconomies, such as inequality, social and political conflict. Urban diseconomies may thus largely undermine any positive effects from the concentration of economic activity in many countries and explain the insignificant results found for the developing countries sample. The results are furthermore in line with some of the more recent empirical studies on the topic which have already highlighted greater heterogeneity in the relationship between urban concentration and economic growth. Pholo-Bala (2009) uncovers a positive effect of urban concentration in European countries, which represent the majority of the countries in the developed country sample, while finding negative effects for African and Latin American countries. Similarly, Castells-Quintana (2015) shows that urban concentration is growth inhibiting in many African countries where the necessary urban infrastructure is not in place. He, furthermore, obtains results that are broadly in line with ours when subdividing the sample into developed and developing countries (see footnote 20, p. 164). It is also worth pointing out that the seminal contribution by Brülhart and Sbergami (2009) does not fully contradict our results. While their main message is that urban concentration is particularly important at low levels of economic development, their panel results are only significant for the second indicator used – the percentage of the urban population living in cities above 750k inhabitants – and not for the primacy indicator. The significant results of the percentage of the urban population living in cities with more than 750k inhabitants may, however, reflect a city size related argument rather than a concentration effect. In addition, they find a positive effect of urban concentration for the European country sample once they account for the importance of the financial sector in each country. This supports the notion highlighted above that countries may increasingly benefit from concentration if the strongest sectors in their economies tend to benefit more from agglomeration externalities. From a theoretical perspective similar points can be made. Comparing our results to the theoretical literature, it seems that NEG models, which predict a growth promoting effect of concentration, have done a reasonable job in describing current mechanisms in the developed world. However, they do not appear accurate for the situation in many developing countries, where we do not find an effect of urban concentration on national economic performance. The reasons for this discrepancy may be that agglomeration benefits as described by NEG are more prevalent in high-tech and knowledge-intensive industries (Graham, 2009; Henderson, 2010) which only represent a small part of the economy in most developing countries. Similarly, these models may underestimate agglomeration diseconomies in developing countries, which are bound to be stronger than in developed countries, given their lower endowment in urban infrastructure and higher levels of urban concentration. Moreover, the results do not confirm the presence of a low economic development trap in our sample, stipulated as a possibility by the system of cities approach. For developed countries, an efficient system of cities seems to have emerged which promotes economic growth. By contrast, in developing countries, urban structure seems to play second fiddle – if at all – to a raft of other factors which are the real determinants of economic growth. ConclusionIn this paper we have investigated two closely related topics. Firstly, the evolution of urban concentration in 68 countries from 1985 to 2010, employing a set of more nuanced indicators than used in the literature thus far. Secondly, the extent to which the degree of urban concentration has affected national economic growth in the same period. In order to overcome the data limitations of past empirical literature on the topic, a new city population dataset was built that allows constructing a set of Herfindahl-Hirschman-Indices. We, furthermore, specifically analysed differences between developed and developing countries and are able to account for reverse causality through an IV design in our regressions. The results indicate that contrary to the general perception of heightened urban concentration, levels of urban concentration have decreased on average or remained stable around the world, depending on the indicator employed. These averages, however, conceal strong changes and differences at country level. Many countries have experienced significant shifts in their urban structure: increased concentration can be found in many developed countries as well as in Asia and some countries of Africa. Levels of concentration have decreased in most parts of Latin America. In general, developing countries still remain much more concentrated than developed countries. The results of the analysis on the relationship between urban concentration and economic growth suggest that there is no uniform relationship between urban concentration and economic growth. Urban concentration has been beneficial for economic growth in high-income countries, but this effect does not hold for developing countries. This contrasts with some of the most prominent previous studies that find a particularly important effect for low levels of economic development. As indicated by some more recent research, there is considerable heterogeneity across the world in the relationship between urban concentration and economic growth, which is, to a large extent, a consequence of contextual factors that have little to do with urban concentration. What are the implications of our results for policy makers who face the question of whether to promote further agglomeration or to stimulate development outside of the primary urban areas? As with most questions, there is no easy answer. On the one hand, the results show that, despite decreasing levels of urban concentration in many developing countries, urban concentration still remains high and many countries saw their levels increase. Urban concentration may, thus, not be self-correcting with economic development as frequently hypothesized. Furthermore, the analysis dispels the prevailing NEG notion that a more concentrated urban structure is best for economic growth, in particular at low levels of economic development. While no uniform relationship can be deduced, the results show that many countries in the developing world are likely to suffer more from congestion generated through increased concentration than benefit from it. Hence, promoting development outside of primary urban areas would be beneficial from an economic point of view. On the other hand, developed countries with the right urban infrastructure in place and an economy with industries strongly benefiting from agglomeration economies highlight that countries can, in fact, benefit from urban concentration. This suggests that sweeping policy recommendations may be ill-advised and that more specific, country-based research may be the way forward in order to set up policies that may foster and make best use of the economic potential of cities and urban agglomeration on a case by case basis. REFERENCESAbdel-Rahman, H. M., & Anas, A. (2004). Chapter 52 - Theories of systems of cities. In J. V. Henderson & J.-F. Thisse (Eds.), Handbook of Regional and Urban Economics (Vol. 4, pp. 2293-2339). Burlington: Elsevier. Acemoglu, D., Johnson, S., & Robinson, J. (2002). Reversal of fortune: Geography and institutions in the making of the modern world income distribution. The Quarterly Journal of Economics, 117(4), 1231-1294. doi:10.1162/003355302320935025 Ades, A. F., & Glaeser, E. L. (1995). Trade and Circuses - Explaining Urban Giants. Quarterly Journal of Economics, 110(1), 195-227. doi:10.2307/2118515 Alesina, A., Spolaore, E., & Wacziarg, R. (2005). Chapter 23 - Trade, Growth and the Size of Countries. In P. Aghion & S. N. Durlauf (Eds.), Handbook of Economic Growth (Vol. 1, Part B, pp. 1499-1542). Amsterdam: Elsevier. Anthony, R. M. (2014). Bringing up the past: Political experience and the distribution of urban populations. Cities, 37, 33-46. doi:10.1016/j.cities.2013.11.005 Aroca, P., & Atienza, M. (2016). Spatial concentration in Latin America and the role of institutions. Investigaciones Regionales, (36), 233-253. Retrieved from http://www.aecr.org/images/ImatgesArticles/2016/12/11_ArocaAtienzareduc.pdf Baltagi, B. H., Bresson, G., & Pirotte, A. (2003). Fixed effects, random effects or Hausman-Taylor? A pretest estimator. Economics Letters, 79(3), 361-369. doi:10.1016/s0165-1765(03)00007-7 Barrios, S., & Strobl, E. (2009). The dynamics of regional inequalities. Regional Science and Urban Economics, 39(5), 575-591. doi:10.1016/j.regsciurbeco.2009.03.008 Behrens, K., & Bala, A. P. (2013). Do rent‐seeking and interregional transfers contribute to urban primacy in Sub‐Saharan Africa? Papers in Regional Science, 92(1), 163-195. doi:10.1111/j.1435-5957.2011.00400.x Bertinelli, L., & Strobl, E. (2007). Urbanisation, urban concentration and economic development. Urban Studies, 44(13), 2499-2510. doi:10.1080/00420980701558442 Bleakley, H., & Lin, J. (2012). Portage and Path Dependence. Quarterly Journal of Economics, 127(2), 587-644. doi:10.1093/qje/qjs011 Bockstette, V., Chanda, A., & Putterman, L. (2002). States and markets: The advantage of an early start. Journal of Economic Growth, 7(4), 347-369. doi:10.1023/a:1020827801137 Bosker, M. (2007). Growth, Agglomeration and Convergence: a Space-time Analysis for European Regions. Spatial Economic Analysis, 2(1), 91-100. doi:10.1080/17421770701255237 Brinkhoff, T. (no date). City Population. Retrieved from http://www.citypopulation.de Brülhart, M., & Sbergami, F. (2009). Agglomeration and growth: Cross-country evidence. Journal of Urban Economics, 65(1), 48-63. doi:10.1016/j.jue.2008.08.003 Castells-Quintana, D. (2016). Malthus living in a slum: Urban concentration, infrastructure and economic growth. Journal of Urban Economics. doi:10.1016/j.jue.2016.02.003 Castells-Quintana, D., & Royuela, V. (2014). Agglomeration, inequality and economic growth. Annals of Regional Science, 52(2), 343-366. doi:10.1007/s00168-014-0589-1 Castells-Quintana, D., & Royuela, V. (2015). Are Increasing Urbanisation and Inequalities Symptoms of Growth? Applied Spatial Analysis, 8(3), 291-308. doi:10.1007/s12061-015-9146-2 Cheshire, P. (1999). Chapter 35 - Trends in sizes and structures of urban areas Handbook of Regional and Urban Economics (Vol. 3, pp. 1339-1373). Amsterdam: North-Holland. Christiaensen, L., Weerdt, J., & Todo, Y. (2013). Urbanization and poverty reduction: the role of rural diversification and secondary towns. Agricultural Economics, 44(4-5), 435-447. doi:10.1111/agec.12028 Crozet, M., & Koenig, P. (2007). The Cohesion vs Growth Tradeoff: Evidence from EU Regions (1980-2000). Paris: Paris School of Economics. Cuberes, D. (2011). Sequential city growth: Empirical evidence. Journal of Urban Economics, 69(2), 229-239. doi:10.1016/j.jue.2010.10.002 Cuervo, L. M., & Cuervo, N. (2013). Urban Primacy and Regional Economic Disparities in Latin America. In J. R. Cuadrado-Roura & P. Aroca (Eds.), Regional Problems and Policies in Latin America (pp. 135-162). Berlin: Springer. Duranton, G., & Puga, D. (2004). Chapter 48 - Micro-foundations of urban agglomeration economies. In J. V. Henderson & J. F. Thisse (Eds.), Handbook of Regional and Urban Economics (Vol. 4, pp. 2063-2117). Burlington: Elsevier. Durlauf, S. N., Johnson, P. A., & Temple, J. R. W. (2005). Chpater 8 - Growth Econometrics. In P. Aghion & S. N. Durlauf (Eds.), Handbook of Economic Growth (Vol. 1, Part A, pp. 555-677). Amsterdam: Elsevier. Fujita, M., Krugman, P., & Venables, A. J. (1999). The spatial economy: cities, regions and international trade. Cambridge Mass.: MIT Press. Fujita, M., & Thisse, J. F. (2003). Does geographical agglomeration foster economic growth? And who gains and loses from it? Japanese Economic Review, 54(2), 121-145. doi:10.1111/1468-5876.00250 Gardiner, B., Martin, R., & Tyler, P. (2011). Does spatial agglomeration increase national growth? some evidence from Europe. Journal of Economic Geography, 11(6), 979-1006. doi:10.1093/jeg/lbq047 Giesen, K., & Südekum, J. (2011). Zipf's law for cities in the regions and the country. Journal of Economic Geography, 11(4), 667-686. doi:10.1093/jeg/lbq019 Graham, D. J. (2009). Identifying urbanisation and localisation externalities in manufacturing and service industries. Papers in Regional Science, 88(1), 63-84. doi:10.1111/j.1435-5957.2008.00166.x Hausman, J., Stock, J. H., & Yogo, M. (2005). Asymptotic properties of the Hahn-Hausman test for weak-instruments. Economics Letters, 89(3), 333-342. doi:10.1016/j.econlet.2005.06.007 Henderson, J. V. (2003). The urbanization process and economic growth: The so-what question. Journal of Economic Growth, 8(1), 47-71. doi:10.1023/A:1022860800744 Henderson, J. V. (2005). Chapter 24 - Urbanization and Growth. In P. Aghion & S. N. Durlauf (Eds.), Handbook of Economic Growth (Vol. 1, Part B, pp. 1543-1591). Amsterdam: Elsevier. Henderson, J. V. (2010). Cities and Development. Journal of Regional Science, 50(1), 515-540. doi:10.1111/j.1467-9787.2009.00636.x Henderson, J. V., & Wang, H. G. (2007). Urbanization and city growth: The role of institutions. Regional Science and Urban Economics, 37(3), 283-313. doi:10.1016/j.regsciurbeco.2006.11.008 Ioannides, Y. M., & Overman, H. G. (2003). Zipf’s law for cities: an empirical examination. Regional Science and Urban Economics, 33(2), 127-137. doi:10.1016/S0166-0462(02)00006-6. Ketterer, T. D., & Rodríguez-Pose, A. (2016). Institutions vs. ‘first-nature’ geography: What drives economic growth in Europe's regions?. Papers in Regional Science, doi: 10.1111/pirs.12237. Krugman, P. (1991). Increasing Returns and Economic-Geography. Journal of Political Economy, 99(3), 483-499. doi:10.1086/261763 Makido, Y., Dhakal, S., & Yamagata, Y. (2012). Relationship between urban form and CO2 emissions: Evidence from fifty Japanese cities. Urban Climate, 2, 55-67. doi:10.1016/j.uclim.2012.10.006 Martin, P., & Ottaviano, G. I. P. (2001). Growth and agglomeration. International Economic Review, 42(4), 947-968. doi:10.1111/1468-2354.00141 Martin, R. (2008). National growth versus spatial equality? A cautionary note on the new ‘trade-off’ thinking in regional policy discourse. Regional Science Policy & Practice, 1(1), 3-13. doi:10.1111/j.1757-7802.2008.00003.x Mohajeri, N., Gudmundsson, A., & French, J. R. (2015). CO2 emissions in relation to street-network configuration and city size. Transportation Research Part D, 35, 116-129. doi:10.1016/j.trd.2014.11.025 Moomaw, R. L. (2004). An empirical analysis of competing explanations of urban primacy evidence from Asia and the Americas. Annals of Regional Science, 38(1), 149-172. doi:10.1007/s00168-003-0137-x Motamed, M. J., Florax, R., & Masters, W. A. (2014). Agriculture, transportation and the timing of urbanization: Global analysis at the grid cell level. Journal of Economic Growth, 19(3), 339-368. doi:10.1007/s10887-014-9104-x Nunn, N., & Puga, D. (2012). Ruggedness: The Blessing of Bad Geography in Africa. Review of Economics and Statistics, 94(1), 20-36. doi:10.1162/REST_a_00161 OECD. (2012). OECD Urban Policy Reviews, Korea 2012: Paris: OECD Publishing. Oyvat, C. (2016). Agrarian Structures, Urbanization, and Inequality. World Development, 83, 207. doi:10.1016/j.worlddev.2016.01.019 Pholo-Bala, A. (2009). Urban concentration and economic growth: checking for specific regional effects. Center for Operations Research and Econometrics (CORE). Université Catholique de Louvain. Discussion Paper 2009/38. Retrieved from https://www.uclouvain.be/cps/ucl/doc/core/documents/Chapter2COREDP.pdf Portes, A., & Roberts, B. (2005). The free-market city: Latin American urbanization in the years of the neoliberal experiment. Studies in Comparative International Development, 40(1), 43-82. doi:10.1007/BF02686288 Puga, D., & Venables, A. J. (1996). The spread of industry: Spatial agglomeration in economic development. Journal of the Japanese and International Economies, 10(4), 440-464. doi:10.1006/jjie.1996.0025 Putterman, L., & Bockstette, V. (2012). State Antiquity Index (“Statehist”) Version 3.1. Retrieved from http://www.econ.brown.edu/ fac/louis_putterman/ antiquity%20index.htm Romer, P. M. (1986). Increasing Returns and Long-Run Growth. Journal of Political Economy, 94(5), 1002-1037. doi:10.1086/261420 Rosen, K. T., & Resnick, M. (1980). The size distribution of cities: An examination of the Pareto law and primacy. Journal of Urban Economics, 8(2), 165-186. doi:10.1016/0094-1190(80)90043-1 Rosenthal, S., & Strange, W. (2004). Chapter 49 - Evidence on the nature and sources of agglomeration economies. In J. V. Henderson & J. F. Thisse (Eds.), Handbook of Regional and Urban Economics (Vol. 4, pp. 2119-2171). Burlington: Elsevier. Savitch, H. V. (2002). Cities in the international marketplace: the political economy of urban development in North America and West Europe. Princeton: Princeton University Press. Sbergami, F. (2002). Agglomeration and Economic Growth: Some Puzzles. HEI Working Paper No: 02/2002. Retrieved from http://repec.graduateinstitute.ch/pdfs/ Working_papers/HEIWP02-2002.pdf Sekkat, K. (2016). Urban Concentration and Poverty in Developing Countries. Growth and Change. Retrieved from http://onlinelibrary.wiley.com/doi/10.1111/grow.12166/full Short, J. R., & Pinet‐Peralta, L. M. (2009). Urban Primacy: Reopening the Debate. Geography Compass, 3(3), 1245-1266. doi:10.1111/j.1749-8198.2009.00234.x Soo, K. T. (2005). Zipf's Law for cities: a cross-country investigation. Regional Science and Urban Economics, 35(3), 239-263. doi:10.1016/j.regsciurbeco.2004.04.004 Staiger, D., & Stock, J. H. (1997). Instrumental variables regression with weak instruments. Econometrica, 65(3), 557-586. doi:10.2307/2171753 United Nations. (2014). World Urbanization Prospects: The 2014 Revision. Retrieved from http://esa.un.org/unpd/wup/ Venables, A. J. (2005). Spatial disparities in developing countries: cities, regions, and international trade. Journal of Economic Geography, 5(1), 3-21. doi:10.1093/jnlecg/lbh051 Wheaton, W. C., & Shishido, H. (1981). Urban Concentration, Agglomeration Economies, and the Level of Economic Development. Economic Development and Cultural Change, 30(1), 17-30. doi:10.1086/452537 Williamson, J. G. (1965). Regional Inequality and the Process of National Development - A Description of the Patterns. Economic Development and Cultural Change, 13(4), 1-84. doi:10.1086/450136 World Bank. (2009). World Development Report 2009. Reshaping Economic Geography. Washington, D.C.: Author. Zipf, G. K. (1949). Human behavior and the principle of least effort: an introduction to human ecology. Cambridge, Mass.: Addison Wesley.
ACKNOWLEDGEMENTSWe are grateful to Arun Agrawal, the editor of the journal, and to the anonymous reviewers for their incisive comments and suggestions to earlier versions of the paper. Participants at conferences and workshops in Beijing, Cambridge, Chicago, Loja and London also provided valuable insights. The usual disclaimer applies.
NOTES* Susanne A. Frick and Andrés Rodríguez-Pose, Department of Geography and Environment, London School of Economics and Political Science (email: a.rodriguez-pose@lse.ac.uk) 1. The inclusion of a country in the dataset was driven by two factors: a) the availability of census data for multiple time periods and b) the size of the country. City states, such as Singapore and Hong Kong, and small island states were not included in the dataset in order to avoid a potential bias of the overall results linked to the special nature of their urban structures, i.e. full concentration of the population in one city in the case of, for example, Singapore. 2. The website www.citypopulation.de collects census data from countries around the world and makes them accessible for researchers and the general public. The side has been widely used in research on cities and urbanization (Cuberes, 2011; Henderson & Wang, 2007; OECD, 2012; Savitch, 2002). 3. Some countries are not included for the entire period of analysis as only few census years are available. 4. Numbers sourced from Brinkhoff (no date). 5. It has become possible to identify the different administrative cities which lay within the contiguous boundaries of an agglomeration using Google Maps‘s satellite view. The numbers for each city within these boundaries were added up to represent the population of the agglomeration. We compared these numbers with official data for agglomerations where these are available (e.g. in France) and found an almost perfect (100%) match with these numbers. 6. Henderson and Wang (2007) point to similar practical considerations for the collection of data on city size. 7. For the purpose of this study, we define developed countries as European countries, US, Australia and New Zealand. Japan and Canada are not included in our dataset as the required data are not available for a sufficiently long time horizon. 8. Numbers based on World Development Indicators. 9. We initially also included controls for a country’s education level as well as openness to trade. However, both controls were consistently insignificant (which is not surprising in a panel setting, see for example Durlauf, Johnson, and Temple, 2005). We therefore decided to exclude them from the analysis to preserve predictive power. 10. We re-ran the regressions excluding China and India to test whether the results are driven by the experience of these somewhat exceptional countries. There are no changes to the results. Similarly, we tested whether excluding countries of the former Soviet Union makes a difference. The results hold throughout. 11. Please note that in order to pass the standard test for the relevance of the instruments, we use ruggedness as an instrument for the world and the developing countries sample. For the developed countries sub-sample, we rely on both soil quality and ruggedness. APPENDIX 1 - City population dataset
APPENDIX 2 - Correlation between primacy and HHIs
APPENDIX 3 - Data sources for control variables
APPENDIX 4 - Fixed effects results
APPENDIX 5 - First-stage IV regression results
Note: This Research Bulletin has been published in World Development, 105 (2018), 156-170 |
||