GaWC Research Bulletin 449 |
|
|
IntroductionOn September 15, 2008, we witnessed the collapse of Lehman Brothers, one of the largest investment banks in the world. This was the most significant sign of the impending collapse of the world economy into a long-term recession. The liquidity of the global financial market was squeezed, which quickly put pressure on the real economy. The gross world product's annual growth rate recorded a substantial decrease from 5.3% in 2007 up to -0.4% in 2009 (IMF, 2014). Although it rebounded slightly in the next year, the slowdown continued until 2013. Furthermore, total investment in fixed assets measured by gross fixed capital formation also decreased, recording below 19% of the GDP averaged among the OECD countries in 2010 (The World Bank, 2014). Most banks were unwilling to raise their credit because of unexpected losses in financial asset, which resulted in the reduction of investment in the real economy. The real economy sunk into a deep stagnation. Certainly, there seems to be no consensus on the nature of this crisis, particularly in terms of their uniqueness, for they are certainly comparable to other world-economic crises, such as the 1970s crisis that resulted in the restructuring of capitalism. In the first stage of the 2008 financial crisis, on the one hand, Reinhart and Rogoff (2008) argued that this crisis was not unique through a comparison of the 2008 crisis with previous crises that have taken place since World War II. On the other hand, Harvey (2011) emphasised that the 2008 crisis was the peak point among a series of crises since the 1970s, which, he thought, came from contradictions in capitalism. Although it might be too early to draw conclusions on the nature of these crises, what we need to do now is investigate the subtle changes in the world economy brought about by the financial crisis in order to predict and prepare for what it could lead to in the near future. According to Castells et al. (2012), without North America and Europe taken into consideration, the world did not experience the severe hardships brought about by this crisis. Thus, the 2008 crisis should be considered as a nonglobal global crisis of capitalism (Castells et al., 2012: 13).' The fact that neoliberalism appeared to exist robustly, despite the recent economic failure, implies that there have been some adjustments made to cope with these unfavourable shocks, and these adjustments should be manifested in intercity relations, because, as argued by Donald et al. (2014), the city was the epicentre of all these crises. Although Peter Taylor and his colleagues from the Globalization and World City (GaWC) research network emphasized in a preliminary study the need for a careful analysis of the geo-economic transition after the 2008 financial crisis, they questioned whether a new economic globalization [will] be created in which the discarding of neoliberalism leads to less geographical concentration of command and control (Taylor et al., 2009: 12).' Alderson et al. (2010) analysed the changing patterns of intercity economic globalization through the organisational structure of transnational corporations (TNCs) from 1981 to 2007 and claimed that the control functions of the world economy [ ] are argued to have become more geographically centralized (Alderson et al., 2010: 1916).' This paper empirically explores the changing patterns of the world city network before and after the 2008 financial crisis. We ask three important questions: (a) does the distribution of city centralities in the network become more hierarchical or more dispersal? (b) which cities have obtained more power and centrality during this period? (c) how has the overall network structure changed during this period? Answering these questions, we argue that the command and control functions and investment attractions in the world city network (WCN) had concentrated on fewer cities than before the 2008 financial crisis, although the power of New York has slightly decreased by the aftermath of this shock. Similar to Alderson and Beckfield (2004) and Wall and van der Knaap (2011), I focus on TNCs, which are the key agents forming intercity relations at a global scale. Based on the previous literature, we address the headquarter-subsidiary network in Fortune Global 500 companies as one of the intercity network formations. However, there is relatively fewer studies concerned with the internal organisation of TNCs compared to those by the GaWC on advanced producer services (APS) firms. In fact, world city network as practised by APS firms' is the network of world cities' (Beckfield and Alderson, 2006) that only consist of the top cities in the world economy. However, given the tendency of APS firms to locate their offices in a few of large cities over the world, other cities excluded from the map of top cities could not be a primary analytical focus (Short, 2004). In contrast to the GaWC, the WCN as formed by TNCs is the world network of cities', which is the concept of the network of all cities across the world (Beckfield and Alderson, 2006). Crisis does not only result in the competition among the strong. Rather, we should pay more attention to the power struggles for survival between the stronger and the weaker. Therefore, the actions of maintaining the WCN, which is the manifestation of capital and value circulation among cities, should not be confined to few top cities in the world. The remainder of this paper is organized as follows: in the next section, we briefly review the relation between WCN studies and financial crisis, arguing crisis is a time point to uncover the qualitative change in the nature of intercity relations and the world economy. Then, our data and methodology are described. In the fourth section, we empirically examine the changing patterns of intercity corporate networks from 2006 to 2013 using centrality scores. Finally, we represent the findings and the future research agenda. World city network and financial crisisSince the writings of Hymer (1972), Friedmann (1986) and Sassen (2001) linking the city-centred organization of world economy with the international organization of multinational enterprises and global service firms, researches on world city theory had been one of the most important themes in urban studies. Although there had been some critiques about the tendency of these studies to fall into patterns of structuralism and econo-centrism (Therborn, 2011; Smith, 2014), they have contributed to a better understanding of the spatial organization of the world economy. Now, I think that the background of world city theory needs to be revisited to explain the relation between the world city and economic crisis. Friedmann and Wolff (1982) focused on a few cities being the foundation for capital: this was based on the capitalistic, economic restructuring brought about by the 1970s global economic crisis. Based on the debates about globalisation and capitalism, they argued that since the 1970s crisis, the new international division of labour (NIDL)' necessarily required agglomerated places for the spatial fix of capitalism. While Friedmann (1986) emphasized TNCs as the key agents of the globalised world economy, Sassen (2001) paid more attention to APS firms. She thought that APSs (i.e., banking/finance, advertising, insurance, accountancy, management consulting, and law) are the inputs for producing and practicing the capabilities for global control, operation and coordination of TNCs. Thus, the global city was not merely a highly concentrated place of global APS firms, but also it was the production centre of capabilities to control the world economy. From her perspective, the time at which the importance of city scale to the spatial organisation of the world economy surfaced also occurred after the oil shocks and the following recession in the 1970s. Increase in the need for APS in international business resulted from the behaviours of firms under the restructuring process. Before this recession, most large companies internalized the function of producer services in order to reduce their transaction costs (Dunning and Rugman, 1985). However, given the high volatility of economic conditions, the internalisation strategies were not appropriate anymore (Buckley and Casson, 2009). Under this circumstance, producer services had been rapidly outsourced, leading to the emergence of specialized service firms (Sassen, 2001). According to Sassen, it is necessary that TNCs require producer services to obtain capabilities for global operation, co-ordination, and control (Sassen, 2001: xxii) ' in a globalised world economy. This trend put pressure on APS firms to transform into global service firms in order to meet the demands of TNCs (Parnreiter, 2014). Thus, the formation of world city and its evolution have resulted from the responses of economic agents to crises. The literature on world city theory since the 2000s, under the trend of the relational turn' in social science, has concentrated on the relations among world cities, which has led to developing diverse concepts, such as the world city network (Taylor, 2004), global urban hierarchy (Alderson and Beckfield, 2004), and global intercity relation (Beckfield and Alderson, 2006). The introduction of the network concept to world city research came from recognising the importance of external-relations among cities and internal assets within cities for their prospects (Beaverstock et al., 2002; Taylor et al., 2010). Interestingly, this motivation of applying the network concept to world city theory started with the study on the changing status of London after the 1997 East Asian economic crisis (Watson and Beaverstock, 2014). The work of Beaverstock et al. (2002) is an early study on WCN, depicting the 1997 East Asian crisis as a good starting point for explaining global intercity relations. For them, this crisis was the first significant crisis of contemporary globalisation (Beaverstock et al., 2002: 121).' Through the examination of the actions of main attendants' (i.e., firms, states, sectors and cities) to the formation of WCN, they put forth that these attendants could be exposed to different dangers and situations, which had led to different ways of reacting. Differences of reaction to the crisis resulted in different consequences in connectivity and direction. After the East Asian crisis, Hong Kong experienced a severe economic failure because it lost its connection with the world, whereas Singapore raised its status in the world economy through an increase of connectivity with the UK (Beaverstock and Doel, 2001; Clark and Wójcik, 2001). Conclusively, they argued that it is at times of systemic crisis that the work of attending to global network becomes much more explicit (Beaverstock et al., 2002: 121).' The network of cities at a global scale, which is the result of all these reactions, should also be considered as the product of struggling against crises. Likewise, Alderson and Beckfield argue, any revision of the global hierarchy is likely to be manifest first in the alteration of relations between cities (Alderson and Beckfield, 2004: 842, original emphasis).' As Williams (2012) noted, crisis has in its nature the power of disclosure. As such, crisis is not a trigger of problems, but rather a catalyst for revealing the latent contradictions in our society. Thus, the analysis of intercity relations before and after the crisis could help us to better explain the changes in the spatial organization of the world economy and the reaction of capitalism to this crisis. Recently, there has been some studies on the 2008 crisis from a geographical perspective (Indergaard, 2011; Aalbers, 2013). WCN studies dealing with a period after the recent crisis (Liu et al., 2014; Taylor et al., 2014) have been mostly performed using the data from the GaWC, except for the work of Csomós (2013), which uses the revenue and profit data from Forbes Global 2000 companies. Unfortunately, there might have been too little concern about TNCs to analyse the changing patterns of the WCN after the crisis. As mentioned above, the WCN formed by TNCs is crucial for revealing the changes in command and control functions, as well as for disclosing how the whole structure of the network mirrors the real economy. I investigate the changes in the WCN, which was formed by and evolved from the TNCs' decision-making, following the description of our data and methods in the next section. Data and methodsIn this study, I adopt the corporate organization solution' for the lack of relation data between cities (see Rozenblat and Pumain, 1993; Taylor, 2006). As in the studies by Alderson et al. (2010) and Wall and van der Knaap (2011), I focus on an intercity network as formed by the TNC's location decisions. The TNCs I am concerned with here are the Fortune Global 500 companies, whose total revenues are equivalent to 37% of gross world product in 2010. The data on the organisational structures of TNCs are collected from LexisNexis Corporate Affiliations, which has information on more than 210,000 companies' organisational structure, economic status and their geographic locations. This paper uses three time points: 2006, 2008, and 2013. The year 2006 was the peak time of the world's prosperity before the dawn of the financial crisis, and the year 2008 was the time we saw significant sign of the impending crisis. The year 2013 was the most recent year I could collect confidential data on TNCs1. For 2006 and 2008, I use LexisNexis' publications for 2006 and 2008, respectively (LexisNexis, 2007; 2009), and the on-line database in LexisNexis Academic for 20132. After merging the companies characterised by M&A or spin-off during this period and excluding those that do not provide reliable information3, total 615 companies are considered in our analysis. Meanwhile, the metropolitan scale is employed as a spatial unit. Derudder (2006) clarified the difference in the concepts of world city, global city and global-city region and argued that the appropriate geographical scale for world city was the metropolitan scale because it could also account for production activities. Through this procedure of joining suburbs into a core city based on metropolitan scale, the number of cities is reduced into 3,278 cities4. To transform corporate organization data into intercity relations, a projection method introduced by Wall and van der Knaap (2011) is used, which considers TNCs' hierarchical differentiation. The way to make a city-by-city matrix is as follows:5 If a city A has the headquarters of a firm, city B has a subsidiary of this firm and city C has a subsidiary of the subsidiary located in city B, cities A and B have only one outdegree to the city B and C, respectively. Through this procedure, all ties in the city matrix have direction and values. This method is useful for two reasons. First, it is good at identifying a city with a strategic role in the organisational structure of TNCs. Second, it helps scholars insulate against overestimating the power of a headquarter-located city. This is significant because previous methods seemed to put all subsidiaries on the same layer (Hennemann et al., 2015). I use three centrality measures from a social network analysis which can reveal which kind of cities are more powerful or prestigious and play a unique role within the corporate network (Alderson et al., 2010). Degree centrality consists of outdegree and indegree centrality. Outdegree centrality refers to the number of controlled subsidiaries. Indegree centrality indicates the level of attractiveness of a city. Alderson and Beckfield (2004) called it prestige' of cities. Closeness centrality refers to how much a city is close to all other cities. Betweenness centrality identifies the cities that play a brokerage role in the network6. Given that the two centrality measures are only applied to binary data (0 or 1), an appropriate criterion for dichotomization is needed. According to the work of Neal (2008) and Liu et al. (2014), the value of tie are considered 1 only if the value is higher than 10% of the highest tie value in the network. The Gini coefficient is also used as an indicator of inequality in the distribution of centralities by which we capture how hierarchical the WCN becomes after this crisis. ResultsGeographical Expansion of the World City NetworkWe are able to find from the Fortune Global 500 list each year that the importance has shift from the US to China. While the number of firms headquartered in the US has decreased, the number of firms headquartered in China has increased continuously. Although US firms are still important, this result implies that Asia and Europe have had their significance uptick in the world economy. When we divide these firms into four regions (i.e., Europe, Asia/Oceania, America and Africa), the share of America in 2007 was 37.8%, while the shares of Europe and Asia were 36.4% and 24.2%, respectively. However, in 2013, Asia raised its portion up to 37.2%, while the shares of America and Europe was recorded as 30.8% and 30.4%, respectively. This decrease in shares of American firms took place from late 2007 to early 2008, although Europe experienced it from 2009 to 2010, which are the time periods when two subsequent crises occurred. The total number of ties in the network slightly deceased from 25,621 in 2006 to 25,173 in 2008, but increased again in the next period up to 40,991. The geographical range covered by TNCs have expanded during this period. The number of outgoing cities in the network was 558, 558 and 742 for 2006, 2008 and 2013, respectively. The number of incoming cities in the network has also increased from 2,231, 2,249 to 2,925. The annual growth rate of the incoming cities was 0.47% for the first period, but it was up to 5.39% for the next period. Centrality in the World City Network: Towards a More Hierarchical Structure?The top 15 cities in terms of each centrality are presented in Table 1. For outdegree, Tokyo took the top honour followed by Paris, New York and London in 2013, whereas New York was the highest position beyond Paris, Tokyo and London in both 2006 and 2008. In terms of indegree scores in 2006, the top cities were New York, London, Paris and Los Angeles in order. However, Tokyo went beyond Los Angeles in 2008 and became the highest city in 2013. Focusing on in- and outdegree centralities without self-ties (diagonal values in city-by-city matrix), there was rarely ranking changes in outdegree scores (see Supplement A). For indegree scores, however, Tokyo placed on a relatively lower position than expected. For closeness and betweenness centrality, we witnessed a relative decrease in the importance of New York and a relative increase of importance in Paris. Table 1. Centrality scores of cities 2006, 2008, and 2013
Note: ID (including diagonal values) The position of the top 4 cities (New York, Paris, Tokyo and London) was found to be stable. Despite severe shocks, these cities held their positions tightly during this period, as demonstrated by the share of incoming and outgoing ties. While the share of incoming ties raised slightly, the share of outgoing ties of the top 4 cities increased from 27.7% in 2006 to 29.8% in 2013 (Table 2). Given the increase in the number of cities with incoming or outgoing ties, this means that a large portion of ties is still concentrated in these cities. During this period, the expansion and attraction of capital were confined to a few cities. Meanwhile, we find a relative weakness in New York but a strength in Paris and Tokyo. The outdegree centrality of New York followed that of Paris and Tokyo. While this trend seems to be the same in closeness and betweenness centrality, the absolute value of New York's indegree score was still at the top. As such, New York is still an attractive place, despite the relative decrease in power to command and control functions (Wójcik, 2013). Tokyo took 6.82% of the outgoing ties in 2006 but 7.1% and 9.91% in 2008 and 2013, respectively. It also explained 2.06% of the total incoming ties in 2006, increasing to 3.71% in 2013. The expanding strategies of Japanese manufacturing firms and trade companies took account of this phenomenon (Wall and van der Knaap, 2011). It is well known that the status of Tokyo as a world city could be well explained by the contribution of their manufacturing sector (Fujita, 1991). In particular, these companies have intensified their efforts on expansion of intra-city or domestic subsidiary locations rather than on global expansion. This is why some scholars cast a doubt on Tokyo's world city status (Hill and Kim, 2000). However, the status of Tokyo as a global command and control centre is proven by its high outdegree centrality without intra-urban connections (see Supplement A.). Paris experienced an increased status in 2013 and rarely suffer from this crisis. Table 2. Shares of the top 4 cities and the selected countries in outgoing and incoming ties
Note: In top 4 cities, Tokyo (5 th rank, 527) is included instead of Los Angeles (4 th rank, 552) for incoming ties in 2006 At the same time, US cities experienced large decreases in their status. Where twelve US cities in 2006 were on the outdegree list, only six cities from US were on the 2013 list. According to Table 2, the share of US cities in terms of both outgoing and incoming ties decreased surprisingly. However, shares of other countries increased during the same period. Germany increased its portion from 9.64% in 2006 to 15.66% in 2013 for outgoing ties and from 5.98% in 2006 to 8.44% in 2013 for incoming ties. France and Japan also increased their shares by approximately 3%P from 2006 to 2013. Therefore, the lost power of US cities has not been diffused to other emerging countries but shifted to a few developed countries that had been competing with the US previously. Particularly, the rise of German cities is worth noting. While Munich was included among the 2006 and 2008 top 15 cities, it was in 2013 that other German cities, such as Frankfurt, Dusseldorf and Essen, moved into their own positions in the top 15 list. The relative stability of German economy accounted for this phenomenon. Where other European countries suffered due to two recent crises, Germany was relatively robust. Germany recorded -5.6% of the annual growth rate of GDP for 2009 but 4.1% for 2013. In particular, the financial sector in Germany has been affected less than the sector in Britain because of Germany's strong regional and local banking system (Wójcik and MacDonald-Korth, 2015). In Germany, the role of banks in the financial sector, especially saving banks, regional banks and credit unions, is more important than in Britain, and they helped to mitigate the severe shocks from these crises. While Deutche Bank and Commerzbank, two of the biggest banks in Germany, had losses from the crises, Germany could overcome it earlier that other countries because of the low risk of credit crunch, which is the virtue of a sound regional banking system. Under this condition, Deutche Bank raised its capital up to 800 million Euros in 2014 (Wójcik and MacDonald-Korth, 2015). These two banks headquartered in Frankfurt expanded their influences into Dusseldorf, New York and London, which strengthened the command and control functions of Frankfurt. Unlike the increase in outgoing ties from Frankfurt, we cannot find Frankfurt in the top 15 indegree cities. According to Global Financial Center Index by Z/Yen (2014), the rank of Frankfurt rapidly declined from 6 th in 2007 to 16 th in 2014. This means that it is less attractive for foreign investment, whereas it experienced the increasing control function as a result of the expansion strategies of Frankfurt-headquartered financial firms. Cities in Asia also experienced rises in status during this period. Beijing shifted its position of outdegree from 34 th in 2006 to 16 th in 2013. Shanghai also had a higher ranking than before in terms of indegree7. These results come from the rise of Asian TNCs in the Fortune Global 500 list. Hong Kong and Singapore have been the strategic places for foreign investments. Although not in the top 15 outdegree cities, they were at higher positions in the indegree list. In particular, they have obtained more importance than before the 2008 financial crisis. Most of subsidiaries located in these two cities are from Tokyo, Beijing and London for Hong Kong and from Tokyo, London and Paris for Singapore. This might be caused by the influence of geographical proximity, their colonial legacies, and English usage. Table 3. Changes in the Gini coefficients by each centrality
Note: ID (including diagonal values), ED (excluding diagonal values) With the increase in the share of the top 4 cities for all centralities, the WCN's centrality distributison has been more unequal. All of the Gini coefficients, except for closeness centrality, have increased (Table 3). Despite the slight decrease in inequality in 2008, there was an increase of one whole degree of inequality in 2013. Though it is not certain whether this state is on the previous path or on a new trajectory towards more unequal structure, it is clear that most of activities of the TNCs are concentrated in a small portion of cities across the world, as Hymer (1972) and Alderson et al. (2010) have argued. According to the work of Liu et al. (2014), the Gini coefficients from the WCN structure as practised by APS firms have declined from 2000 to 20108. Even if the routine business and service flows have been decentralized, the command and control functions and the brokerage role have been rather concentrated on a few cities. This presented the intensification of the micro-differentiation of space based on the heterogeneity of places (Kim, 1998). World City Network Structure by City-Pair LinkagesTable 4 represents the top 15 city-by-city linkages in the WCN by each year. In 2006, the highest city-paired linkage was the tie from New York to Los Angeles. Additionally, Los Angeles had 38 subsidiaries in New York, summing to a total of 133 flows between the two cities. In addition to Los Angeles, New York had connections with other large cities within its region (e.g., Philadelphia, Chicago, Toronto, Atlanta, etc.). In 2008, the tie from New York to Los Angeles had the largest values, although in 2013 this link was a little behind the link from Frankfurt to Dusseldorf. In the first wave, two of the highest links from Tokyo were towards New York and London, which were accounted for by the location strategies of APS firms. However, we witnessed that Tokyo strengthened the linkages among Asian cities in the next period. Most of ties were from Tokyo to other Asian cities, representing the consolidation of the Asian command and control system centred in Tokyo. Japanese manufacturing companies explained these Asian-oriented linkages. In particular, 60% of the ties to Bangkok, Shanghai and Singapore were connected by these firms. This meant that APS firms have linked Tokyo with the world's biggest capital market, New York and London, while manufacturing firms have made connection with Asian cities, reinforcing the centrality of Tokyo. Paris experienced the weakness of its linkage with New York, rather tightening its relations with European cities, Madrid, Brussels and London. In the first period, it is found that total flows between New York and Paris were the second highest linkages, following that of Paris and London. However, the link from Paris has been delimited to the European boundary in the second period. The tie to Madrid is composed of similar portions of APS and manufacturing, and the ties to London or Brussels can be explained by APS and energy firms. This represented the complementarities among cities (Taylor et al., 2010). More interesting is the rise of Beijing and Frankfurt. Beijing, with the highest connection with Hong Kong, has connected mostly with Asian cities. China, as one of the fast-growing emerging countries, has depended on most of its linkages coming from state-owned companies. State-owned companies played several roles, such as booming the domestic economy, linking the economy with the global market and building up the domestic infrastructure. These allowed them to strengthen domestic linkages. In the case of the Industrial and Commercial Bank of China (ICBC), over half of the profit as of 2010 came, not from the aggressive investment, but instead from the margins between savings and loans rates (ICBC, 2011). As such, this output results, not from the firm's competitiveness, but from the state-led financial system (Yao and Wu, 2011). This strategy resulted in widening connections among cities within Chinese territory. Table 4. Changes in city-paired linkages
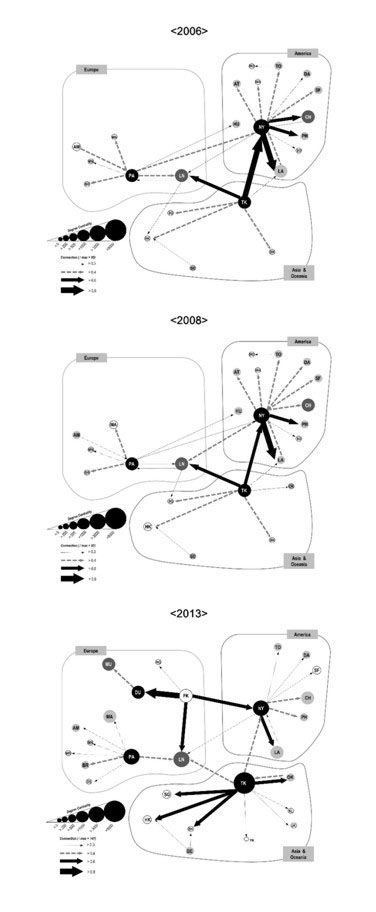
Note: if the two subsequent values are same, they take the same ranking Figure 1 represents the reduced world city network structures during this whole period. The size of circle represents the degree centrality of each city and the width of each link is proportional to the highest link in each year. We can see that New York, London and Tokyo have played the role of global and regional centres. Also, it is found that Paris had lower linkages with cities from other regions than expected, playing an investing role within Europe. In 2013, the strength of the link between Frankfurt and Dusseldorf rose surprisingly, reflecting the robustness of German companies. Figure 1. Reduced world city network structures formed by TNCs, 2006-2013
Note: ties are only presented, whose values exceed 30% of the maximum city-paired linkage value Abbreviation: AM(Amsterdam), AT(Atlanta), BE(Beijing), BK(Bangkok), BO(Boston), BR(Brussels), CH(Chicago), DA(Dallas), DU(Dusseldorf), FK(Frankfurt), HG(Hamburg), HK(Hong Kong), HT(Houston), JK(Jakarta), KL(Kuala Lumpur), LA(Los Angeles), LN(London), MA(Madrid), MN(Milan), MO(Montreal), MU(Munich), NY(New York), OK(Osaka), PA(Paris), PH(Philadelphia), SF(San Francisco), SG(Singapore), SH(Shanghai), SY(Sydney), TK(Tokyo), TO(Toronto), WA(Washington DC), WR(Warsaw), YK(Yokohama) Table 5. Shares of ties by the regional-pairs and the geographical ranges
Note: from top to bottom in each cell, 2006, 2008 and 2013, respectively, and all ranges are not including the lower part of it We witness the consolidation of regional connections. All cities are broadly categorised into four regions: Europe, America, Africa and Asia/Oceania. Table 5 shows the share of ties by the regional-pairs and the geographical ranges. While the connections formed within the national boundary took the largest share in 2006, it decreased in 2013. At the same time, the regional connections have increased continuously, recording 22.07% of total linkages in 2013. However, there is a regional difference in this trend. According to the share of the regional-paired connections in Table 5, we also find that the connections within Asia/Oceania and Europe have increased up to 15.45% and 34.36% of the total linkages in 2013, respectively, whereas the connections within American region has diminished. This implies that the regional preference of TNCs has shifted from America to Asia and Europe, which have been relatively less affected by this crisis. Also, the intra-regional investments have become stronger than before in order to reduce the uncertainty and risks from this crisis. According to US Bureau of Economic Analysis9, the disposable income per capita in the US has decreased since the 2008 financial crisis, while the portion of savings in disposable income has rapidly increased, leading to a decline in the consumption level. This placed pressure on TNCs' investment strategies to favour emerging markets (Donald et al., 2014). However, TNCs have faced a high degree of their liability of foreignness, since the financial crisis, accompanied by an increase in information costs due to a high risk and uncertainty (Goerzen et al., 2013). It might lead TNCs to prefer locating their subsidiaries in more proximate and/or larger cities with high degrees of information diffusion. Analysis of changes in city-paired linkage patterns represents three important things. First, the geographical proximity is still important. We find that most TNC linkages have been connected with their own regional cities or domestic cities. Second, within-regional connections have been more prominent than before. Third, despite the significance of geographical proximity, linkages between regions have been formed by a few cities. Therefore, the evolution of the world city network by TNCs results from the interaction between the geographical proximity and the topological proximity. ConclusionThis paper explores the changes in the world city network structure during the recent financial crises by examinations of three centrality measures of cities and city-paired linkages. Through the analyses on the evolution of the WCN, as formed and evolved by TNCs, we summarize the empirical findings as follows. First, this network has been expanding since the crisis, despite a little decline in the peak time of the crisis. Second, the WCN structure centred on New York has shifted into the triumvirate of New York, Paris and Tokyo. As a result, the top 4 cities' share in both outgoing and incoming ties have increased. Third, with the stability of first-tier cities, second-tier cities from Germany, China and Japan have obtained more important positions in the network. Fourth, through these results listed above, the overall structure of the WCN has been more hierarchical than before. Fifth, given the inequality of the network structure, each of the cities has reinforced the connections with its own regional cities, especially in favour of Europe and Asia. Through various media after the crises, we have already seen the rising importance of China and Germany and the eclipse and recovery of the US. This paper reveals this pattern through the empirical evidences. As was the case in the works by GaWC scholars (Liu et al., 2014; Taylor et al., 2014), the network structure of the routinized business information flows, for example, as practised by APS firms, has been more decentralized. However, the command and control functions, the investment attraction, and the brokerage roles through this control network are still hierarchical and unequal. As concerns the relative stability of positions of the top 4 cities, the stronger shifted the blame on the weaker to survive in the times of crisis, even though these cities were actually key instigators. REFERENCESAalbers MB. (2013) Debate on Neoliberalism in and after the Neoliberal Crisis. International Journal of Urban and Regional Research 37: 1053-1057. Alderson AS and Beckfield J. (2004) Power and position in the world city system. American Journal of Sociology 109: 811-851. Alderson AS, Beckfield J and Sprague-Jones J. (2010) Intercity Relations and Globalisation: The Evolution of the Global Urban Hierarchy, 1981-2007. Urban Studies 47: 1899-1923. Beaverstock JV and Doel MA. (2001) Unfolding the spatial architecture of the East Asian financial crisis: the organizational response of global investment banks. Geoforum 32: 15-32. Beaverstock JV, Doel MA, Hubbard PJ, et al. (2002) Attending to the world: competition, cooperation and connectivity in the World City network. Global Networks 2: 111-132. Beckfield J and Alderson AS. (2006) Reply: Whither the Parallel Paths? The Future of Scholarship on the World City System. American Journal of Sociology 112: 895-904. Buckley PJ and Casson MC. (2009) The internalisation theory of the multinational enterprise: A review of the progress of a research agenda after 30 years. Journal of International Business Studies 40: 1563-1580. Castells M, Caraça J and Cardoso G. (2012) Aftermath: the cultures of the economic crisis: Oxford University Press. Clark GL and Wójcik D. (2001) The City of London in the Asian crisis. Journal of Economic Geography 1: 107-130. Csomós G. (2013) The command and control centers of the United States (2006/2012): An analysis of industry sectors influencing the position of cities. Geoforum 50: 241-251. Derudder B. (2006) On conceptual confusion in empirical analyses of a transnational urban network. Urban Studies 43: 2027-2046. Donald B, Glasmeier A, Gray M, et al. (2014) Austerity in the city: economic crisis and urban service decline? Cambridge Journal of Regions, Economy and Society 7: 3-15. Dunning JH and Rugman AM. (1985) The Influence of Hymer's Dissertation on the Theory of Foreign Direct Investment. The American Economic Review 75: 228-232. Friedmann J. (1986) The World City Hypothesis. Development and Change 17: 69-83. Friedmann J and Wolff G. (1982) World city formation: an agenda for research and action. International Journal of Urban and Regional Research 6: 309-344. Fujita K. (1991) A world city and flexible specialization: restructuring of the Tokyo metropolis. International Journal of Urban and Regional Research 15: 269-284. Goerzen A, Asmussen CG and Nielsen BB. (2013) Global cities and multinational enterprise location strategy. Journal of International Business Studies 44: 427-450. Harvey D. (2011) Roepke Lecture in Economic GeographyCrises, Geographic Disruptions and the Uneven Development of Political Responses. Economic Geography 87: 1-22. Hennemann S, Derudder B and Taylor PJ. (2015) Cutting the Gordian knot of visualizing dense spatial networks: the case of the world city network, 2013. Environment and Planning A 47: 1332-1340. Hill RC and Kim JW. (2000) Global cities and developmental states: New York, Tokyo and Seoul. Urban Studies 37: 2167-2195. Hymer SH. (1972) The multinational corporation and the law of uneven development, New Haven: Yale University. ICBC. (2011) 2010 Annual Report. Industrial and Commercial Bank of China. Indergaard M. (2011) Another Washington-New York consensus? progressives back in contention. Environment and Planning A 43: 286. Kim YC. (1998) The socio-economic implications of the network production system of the small and middle enterprises. Space and Society 10: 28-58. LexisNexis. (2007) 2006 LexisNexis Corporate Affiliations, New Providence: LexisNexis. LexisNexis. (2009) 2008 LexisNexis Corporate Affiliations, New Providence: LexisNexis. Liu X, Derudder B, Witlox F, et al. (2014) Cities As Networks within Networks of Cities: The Evolution of the City/Firm-Duality in the World City Network, 20002010. Tijdschrift Voor Economische En Sociale Geografie 105: 465-482. Neal ZP. (2008) The duality of world cities and firms: comparing networks, hierarchies, and inequalities in the global economy. Global Networks 8: 94-115. Parnreiter C. (2014) Network or Hierarchical Relations? A Plea for Redirecting Attention to the Control Functions of Global Cities. Tijdschrift Voor Economische En Sociale Geografie 105: 398-411. Reinhart CM and Rogoff KS. (2008) Is the 2007 US sub-prime financial crisis so different? An international historical comparison. National Bureau of Economic Research. Rozenblat C and Pumain D. (1993) The Location of Multinational Firms in the European Urban System. Urban Studies 30: 1691-1709. Sassen S. (2001) The Global City: New York, London, and Tokyo: Princeton University Press. Short JR. (2004) Black Holes and Loose Connections in a Global Urban Network. The Professional Geographer 56: 295-302. Smith RG. (2014) Beyond the Global City Concept and the Myth of Command and Control'. International Journal of Urban and Regional Research 38: 98-115. Taylor PJ. (2004) World City Network: A Global Urban Analysis, New York: Routledge. Taylor PJ. (2006) Comment: Parallel Paths to Understanding Global Intercity Relations. American Journal of Sociology 112: 881-894. Taylor PJ, Derudder B, Faulconbridge J, et al. (2014) Advanced Producer Service Firms as Strategic Networks, Global Cities as Strategic Places. Economic Geography 90: 267-291. Taylor PJ, Hoyler M and Verbruggen R. (2010) External Urban Relational Process: Introducing Central Flow Theory to Complement Central Place Theory. Urban Studies 47: 2803-2818. Taylor PJ, Ni P, Derudder B, et al. (2009) The way we were: command-and-control centres in the global space-economy on the eve of the 2008 geo-economic transition. Environment and Planning A 41: 7-12. Therborn G. (2011) End of a paradigm: the current crisis and the idea of stateless cities. Environment and Planning A 43: 272-285. Wójcik D. (2013) The Dark Side of NYLON: Financial Centres and the Global Financial Crisis. Urban Studies 50: 2736-2752. Wójcik D and MacDonald-Korth D. (2015) The British and the German financial sectors in the wake of the crisis: size, structure and spatial concentration. Journal of Economic Geography 15: 1033-1054. Wall RS and van der Knaap GA. (2011) Sectoral Differentiation and Network Structure Within Contemporary Worldwide Corporate Networks. Economic Geography 87: 267-308. Watson A and Beaverstock JV. (2014) World City Network Research at a Theoretical Impasse: On the Need to Re-Establish Qualitative Approaches to Understanding Agency in World City Networks. Tijdschrift Voor Economische En Sociale Geografie 105: 412-426. Williams R. (2012) The rolling apocalypse of contemporary history. In: Castells M, Caraça J and Cardoso G (eds) Aftermath: The Cultures of the Economic Crisis. Oxford University Press, 17-43. Yao X and Wu X. (2011) Transition of China's Financial System after the Global Financial Crisis. The World Economy 34: 792-804. Z/Yen. (2014) The Global Financial Centres Index 15. Z/Yen Group. IMF (2014) World Economic Outlook Database (www.imf.org/external/pubs/ft/weo/2014/02/weodata/index.aspx) The World Bank (2014) The World Bank Database (data.worldbank.org)
NOTES* Kyusang Kwon, The Cho Chun Shik Graduate School for Green Transportation, Korea Advanced Institute of Science and Technology (KAIST) (email: kyusang.kwon@kaist.ac.kr) 1. Analysis including the year 2010 or 2011 would be more appropriate. Unfortunately, these data were not be available for this analysis. 2. These data was collected at Oct. 30 Nov. 8, 2013, and then supplemented at Dec. 4 6, 2013. 3. 11, 22, and 27 firms are excluded in 2006, 2008 and 2013, respectively. Notably, most of the excluded firms in 2013 are Chinese state-owned companies, which implied that Chinese cities could be underestimated in the result for 2013. This limitation should be considered when interpreting the findings. 4. More specifically, we employ each country's metropolitan-equivalent area criteria, such as MSA for the US, NUTS-3 for EU, CA/CMA for Canada, and AU for Australia. However, London and Paris are aligned with NUTS-1 because of the excessive area separation by NUTS-3 in the two cities. In the case where there might be no clear criteria for the metropolitan area, similar to the method of Alderson and Beckfield (2004) and, we supplement it using the online material (MapQuest). Even if this is definitely a subjective procedure, it is more useful in terms of complexity reduction in data analysis (see Alderson et al., 2010: 1918). 5. For more details, see Wall and van der Knaap (2011: 273-276). 6. For more details, see Alderson and Beckfield (2004: 822-824). 7. Considering the number of excluded firms from China in 2013, the status of Chinese cities in the world city network is expected to be higher than this result. 8. This is actually caused by the assumption of the interlocking network model of GaWC when generating a city-by-city matrix. Suppose that KPMG headquartered in Amsterdam locates one office with only 1 service value in Nairobi, Kenya. Nairobi will obtain a substantial increase in flows because an office can gain the sum of all service values in KPMG, whereas, at the same time, the business flows of Amsterdam just increased by five; this is according to the assumption that all offices are connected to each other in proportion to their service values. Therefore, this assumption necessarily leads to the decentralization of connectivity in the network, in the case of an increase in the node's network participation. 9. See http://www.bea.gov/, accessed 19 June 2015.
|
||||||||||||||||||||||||||||||||||||||||||||||||||||||||||||||||||||||||||||||||||||||||||||||||||||||||||||||||||||||||||||||||||||||||||||||||||||||||||||||||||||||||||||||||||||||||||||||||||||||||||||||||||||||||||||||||||||||||||||||||||||||||||||||||||||||||||||||||||||||||||||||||||||||||||||||||||||||||||||||||||||||||||||||||||||||||||||||||||||||||||||||||||||||||||||||||||||||||||||||||||||||||||||||||||||||||||||||||||||||||||||||||||||||||||||||||||||||||||||||||||||||||||||||||||||||||||||||||||||||||||||||||||||||||||||||||||||||||||||||||||||||||||||||||||||||||||||||||||||||||||||||||||||||||||||||||||||||||||||||||||||||||||||||||||||||||||||||||||||||||||||||||||||||||||||||||||||||||||||||||||||||||||||||||||||||||||||||||||||||||||||||||||||||||||