GaWC Research Bulletin 441 |
|
|
|
This Research Bulletin has been accepted for publication in Papers in Regional Science. Please refer to the published version when quoting the paper
INTRODUCTION: the missing link between agglomeration theory and urban dynamics.. .the pattern of population and economic growth in Europe, and especially in northwestern Europe, does not follow exclusively a linear pattern of large city logic. ' (Dijkstra et al., 2013: p. 349). Many modern geography textbooks begin with the observation that more than half of the world's population now lives in cities, and the Urban Age' has begun. True, urban growth has been spectacular in many parts of the world and the development of large megacities has caught the attention of many urban scholars for good reasons. At the same time, the Urban Age' thesis rests on chaotic conceptions (Brenner and Schmid, 2014) and, as it is characterised by this metropolitan bias' (Connolly, 2008), fails to recognise that Europe, and especially the more densely populated parts of the former EU15, has a rather different urban pattern that is furthermore characterised by what appear to be new and contradictory urban dynamics. First, over half of the EU urban population lives in small and medium-sized towns and cities in the 5,000-100,000 range. Only 7% of EU citizens live in megacities of 5 million or more, compared with, for example, 25% in the U.S. (European Commission, 2011). Second, Europe has been highly urbanized for many decades, to a much greater extent than the world average (Hohenberg and Lees, 1985). While the urbanisation rate of the EU is over 70%, many countries in Western Europe have levels of urbanisation of 80% - 90%. This is not however the result of recent urban growth. Third, large cities do not grow faster than small cities in Europe. In the former EU15, the population share accounted for by cities over 200,000 remained almost constant between 1985 and 2005 (Turok and Mykhnenko, 2007). Fourth, the average contribution to GDP by large European metropolitan areas of over 250,000 in the former EU15 increased only marginally by 0.28% between 2000 and 2006 (calculated from Dijkstra, 2009). In the 2000-2007 period, second-tier cities in all but one (Portugal) of the former EU15 countries outperformed their larger capital in terms of annual GDP growth rates (Parkinson et al., 2012) and Europe has actually witnessed shifts from urban to rural and from larger to smaller cities (Dijkstra et al., 2013). Camagni et al. (2015a) document that second-rank cities (between 200.000-1 million) in the former EU15 appear more resilient in periods of economic slowdown. This polycentric urban pattern of small and medium-sized cities, the lack of further urbanisation, the marginal growth of large cities in the EU15 as well as their contribution to GDP are all in marked contrast with the bourgeoning literature stressing the importance of agglomeration for growth (e.g. Glaeser, 2011), and the theoretical models of the New Economic Geography (NEG) that tend to predict the development of fewer and larger cities (e.g. Fujita et al., 1999) because of agglomeration externalities: the range of opportunities, amenities, infrastructure and skills available to firms and people. Generally, the larger a city, the more such externalities are present (Melo et al., 2009). Consequently, the urban dynamics in large parts of Western Europe (and probably elsewhere) require an explanation beyond conventional wisdom. Dijkstra et al. (2013) suggest that, at least since the beginning of the new millennium, large city urbanisation effects have not been the primary economic drivers within the EU15 in the same way they have been elsewhere in the world. It seems that NEG models have until recently been well capable of explaining developments in the urban system, but fail to explain current population and growth dynamics (Glaeser and Kohlhase, 2004), particularly for mature, developed urban systems (Partridge et al., 2009) such as within the former EU15. Perhaps there are alternative pathways to growth that have been overlooked by the focus on mega-cities. Dijkstra et al. (2013) have looked for explanations within Europe's polycentric urban structure, the gradually improved access to services, such as broadband, outside large cities and agglomeration diseconomies in the large cities increasing the appeal of smaller cities. In this regard, McCann and Acs (2011) even argue that at the present day and age national and international urban connectivity is more important for urban performance than urban size. Likewise, Bel and Fageda (2008) reported that global airline networks are a much more important determinant of the location of corporate control functions than urban and national scale, while Ni and Kresl (2010) pose that global connectivity is the most important determinant of the global competitiveness of cities. This not only suggests that nowadays the embeddedness in regional, national and international networks is important for urban performance, but also that small and medium-sized cities have the opportunity to compete with larger ones provided that they are well connected. In this paper, we provide an alternative, novel explanation that could provide the missing link between agglomeration economies and contemporary urban dynamics in Western Europe. This explanation does not question the importance of agglomeration benefits as the underlying driving force of much of the contemporary urban dynamics, but suggests that these agglomeration externalities may not be confined to the borders of cities, as the word agglomeration economies suggests, but instead, may be shared in networks of cities. A good position of cities in networks may allow them to borrow size' (cf. Alonso, 1973; Meijers and Burger, 2015) through these networks from other cities, making that (European) cities may compensate their relative lack of size or mass by being very well embedded in networks of cities. If this were true, agglomeration externalities are turning into, or being complemented with city network externalities' (Camagni and Capello, 2004; Johansson and Quigley, 2004). These may replace, or complement traditional localised externalities. So, we suggest that a combination of two of the three ways to explain current urban dynamics better proposed by Camagni and Capello (2015), namely those focusing on the geographical and macro-territorial foundations, is required. This paper explores whether networks are complementing local factors in the development of what is known as urbanisation economies', where we specifically focus on the presence of higher-order metropolitan functions related to business, science, sports, and culture as proxies of these urbanisation economies. Accordingly, we predominantly focus on the occurrence of agglomeration through sharing (cf. Duranton and Puga, 2004; Puga, 2010). On the one hand, these agglomeration economies through sharing take the shape of the presence of indivisibilities in the provision of amenities such as fairs, universities, and sport and culture venues. On the other, they relate to having access to a wider variety of inputs, such as the overrepresentation of advanced producer services and command and control functions. The main research question is: To what extent does city network connectivity translate into a higher level of metropolitan functions, and how important is this network connectivity vis-à-vis local factors? This question is further refined by 1) examining the importance of networks at different spatial scales, and by exploring the importance of network connectivity vis-à-vis local factors for 2) the occurrence of specific types of metropolitan functions and 3) different size classes of cities. The remainder of this paper is organized as follows. The next section presents the theoretical background, thereby focusing on urbanisation economies in relation to networks. We introduce, elaborate on, and link three key concepts that will constitute our conceptual framework: network externalities', borrowed size' and agglomeration shadows'. Section three provides our methodological approach and data used for the empirical exploration of these concepts. The results of this empirical exercise are discussed in section 4. Section 5 concludes. Related literature: Urbanisation economies from a network perspectiveThe benefits and costs of agglomeration have been extensively discussed for more than a century. Agglomeration externalities derive from a variety of sources (Parr, 2002; McCann, 1995; Van Oort, 2004). Given our focus on (networks of) cities rather than specialized clusters of firms, our focus is on what has been termed urbanisation economies' (Ohlin, 1933) also referred to as spatially constrained external economies of scope', related to the diversity of the agglomeration (Parr, 2002). Larger, denser and more diverse cities allow for cost reductions, output enhancements and utility gains for both firms and households. They profit from larger input markets, larger labour pools, the presence of better infrastructure, public facilities and more specialised business services, all facilitating better matches between supply and demand. Large cities are also more likely to be home to universities, R&D facilities, and other knowledge-generating institutions (Van Oort, 2004) and facilitate the transmission of information and provide a good environment for consumption as well (Jacobs, 1969; Glaeser et al., 2001). In addition, the often diverse industry mix in large cities stimulates the generation, replication, modification and recombination of ideas and applications across different industries by providing better opportunities through face-to-face contact and protects a city from a volatile demand (Frenken et al., 2007). Given all these benefits, Glaeser (2011) even claims that cities are our greatest invention'. According to Duranton and Puga (2004) and Puga (2010), there are three main underlying channels through which firms and households can benefit from co-locating in cities: sharing, matching, and learning. First, firms and households benefit from agglomeration by being able to draw on a common pool of resources that need a minimum community size to be supported. One cannot only think here of sharing indivisibilities such as universities, fairs and amenities, but also of the presence of a wider variety of input suppliers and a large labour pool. In this paper, we will predominantly address sharing of facilities (and to a lesser extent labour pools and suppliers) by focusing on the presence of metropolitan functions in cities. Second, large cities offer the opportunity to match better and faster. Due to larger labour pools, not only workers have often less difficulties to find suitable jobs, but also firms are better able to quickly find good quality labour and intermediary input factors. Third, large cities offer firms and people more opportunities for face-to-face contact, which makes it easier to generate, diffuse and accumulate knowledge. However, one cannot ignore that there is a downside to larger cities as well. The high concentration of jobs and residents increases traffic congestion, competition for centrally located sites, exposure to environmental pollution and crime. Also the scale at which social problems occur is larger, which means that these cannot be controlled easily. In general, evidence suggests that smaller cities have a greater endogenous capacity to keep these social, economic, and environmental costs under control (Capello and Camagni, 2000). While the particularities and significance of these benefits and costs have received ample attention, the spatial range of these agglomeration benefits and costs has been hardly explored. We know that they attenuate with distance (Rosenthal and Strange, 2004; Viladecans-Marsal, 2004; Van Oort, 2007) and some scholars have argued that their spatial range has been extending (e.g. Coe and Townsend, 1998; Phelps et al., 2001; Partridge et al., 2008; Burger et al., 2010), but to what extent is unclear. Intriguing is that some scholars have suggested that agglomeration costs are confined more to the city boundaries than are agglomeration benefits (Parr, 2002; Meijers and Burger, 2010) . However, whether urbanisation economies can be shared in networks between cities remains unclear. Of course, there is the more general proposition that network economies may substitute for agglomeration economies (Johansson and Quigley, 2004) and from that perspective it seems likely that these urbanisation economies are increasingly less associated with local factors (such as size and density) and instead, should be framed in a network perspective. To capture such network effects, the concept of urban network externalities' (Capello, 2000; Boix and Trullen, 2007) has been coined, and it emphasises the role that interaction in networks of cities may have on the performance of the places that are linked by these networks. The logic underlying the network cities paradigm is that the spatial organisation in which cities operate is fundamental to understanding their efficiency, growth, factor productivity and sometimes their specialisation (Capello and Camagni, 2000:1484). Although local factors still seem to outweigh network effects by far (Boix and Trullen, 2007), it seems to be likely that the importance of network externalities is growing as the connectivity of places has been rapidly increasing in the past decades. So far, attention has been merely devoted to international connectivity. As pointed out by Iammarino and McCann (2013: 318), international connectivity facilitates the capability of individuals, firms, organizations and institutions to interact, engage, take initiatives and make decisions across different locations and within networks . Particularly the global cities, of which London and Paris are prime examples, are not only characterized by their large size, but also by their centrality in worldwide air, rail and marine networks (Burghouwt, 2005; Jacobs et al., 2010). Indeed, several studies repeatedly show the importance of a city's embeddedness in large-scale networks of all kinds firms, capital, knowledge, people, goods for its performance (Taylor, 2003; Bel and Fageda, 2008; Neal, 2013), and this can be even more important than local factors (McCann and Acs, 2011). Along these lines, urban networks would complement and in some cases replace - traditional agglomeration economies in facilitating sharing, matching, and learning. An early contribution that put urbanisation economies also in a network perspective albeit on a much smaller, regional, scale, is the concept of borrowed size' as proposed by Alonso (1973) . He used the concept of borrowed size' to explain a disconnection between size and function of smaller cities that were part of a megalopolitan urban complex: [t]he concept of a system of cities has many facets, but one of particular interest is the concept of borrowed size, whereby a small city or metropolitan area exhibits some of the characteristics of a larger one if it is near other population concentrations (Alonso, 1973:200). More precisely, he suggested that smaller urban areas borrow' some of the agglomeration benefits of their larger neighbours, while avoiding the agglomeration costs. The phenomenon of borrowed size' demands a network perspective since it transforms the issue of the size and growth of a city by redefining it to include, in some degree, its neighbours (Alonso, 1973:200). Phelps et al. (2001) explored whether small firms in small cities near London are able to borrow size' from their big neighbour and found that these firms can locate in small towns and still access specialised labour and the informational external economies of larger nearby places. Meijers and Burger (2015) make a subdivision of borrowed size into borrowed function' and borrowed performance'. Focusing on cultural amenities, Burger et al. (2015) find that relatively larger places in a region are better able to borrow size than smaller ones, in the sense that they host more functions (borrowed function'). Camagni et al (2015a) find evidence that getting access to these functions and the networks of first rank cities leads to higher average location benefits in second cities, even though these functions and networks are not present locally (which we label borrowed performance'). Despite these exceptions, the concept of borrowed size has received only limited attention, which is remarkable given its promise to explain urban dynamics in Western Europe. Although Alonso (1973) mainly focused on borrowing size of geographically nearby places, in an ever expanding global economy, his argument can be easily extended to city networks in general and not only involve regional network connectivity but also (inter)national network connectivity. While many contributions emphasise the spread of positive urbanisation economies through connectivity in networks, one should note that network connectivity can also be negative due to competition processes. This negative effect is nicely captured by the concept of agglomeration shadows' that is rooted in the New Economic Geography. NEG models predict a shadow effect of agglomerations over their surroundings, which means that growth near (higher -tier) cities will be limited due to competition effects (Dobkins and Ioannides, 2001). Its empirical justification has been questioned by Partridge et al. (2009), who find that population growth in small urban areas is positively related to proximity to a higher-tier urban centre. Burger et al. (2015) show that, on average, larger cities cast a shadow over smaller neighbouring cities in that they exploit their support base rather than vice versa. However, while these small cities face spatial competition effects, they simultaneously gain access to the agglomeration benefits of their larger neighbour, probably leading to faster growth. The latter shows that size' in the concept of borrowed size' is rather imprecise, as it can refer either to a performance level associated with larger cities, or to the functions and economic activities present in larger cities. In our conceptual framework, agglomeration shadows and borrowed size effects are different sides of the same medal called network externalities'. A positive influence of network connectivity on the presence of urbanisation economies is referred to as borrowed size', whereas a negative influence of network connectivity leads to agglomeration shadows'. Methodological approach and dataMeasuring Metropolitan Functions, Network Connectivity and Local FactorsIn this research, we predominantly focus on agglomeration and network effects through the sharing channel by focusing on the presence of metropolitan functions in cities. In other words, we assess whether the presence of metropolitan functions in an agglomeration is related to its size or to its network connectivity. This allows us to evaluate the importance of connectivity at the regional and (inter)national scale vis-à-vis local scale. As explained, network connectivity allows cities to borrow size, but may also imply competition effects referred to as agglomeration shadows'. If network connectivity allows a place to have more metropolitan functions than would be expected given its size, it follows that the place is borrowing size; when this level is less than expected given the size of a place, it is likely to be in an agglomeration shadow. To be able to determine an expected level of metropolitan functions, one should consider a proxy that is historically relatively strongly related to, or determined by, size. In this study, we therefore focus on the presence of metropolitan functions in the domains of international institutions, science, firms, culture, and sports. These indivisibilities stem from the aggregate economic activities of a city, and hence, have always been strongly determined by the local size. It is, for instance, a critical assumption of the Central Place Theory that the presence of such metropolitan or urban functions is directly linked to the size of cities and their hinterland (Christaller, 1933). Various studies have shown the importance of taking stock of heterogeneity (Burger et al., 2014a; 2014b; Van Meeteren, 2013). Hence, it could well be that the degree to which local size and network connectivity matter differs for different types of metropolitan functions. For that reason, we carry out analyses on an aggregated level of metropolitan functions as well as for individual functions. In a similar vein, it could also be that the importance of local size and network connectivity differs for different size categories of cities, an issue that we will also explore. Local size is measured here simply by the number of inhabitants of a city (population size). Network connectivity can be calculated in many ways (Taylor, 2003). In order to use a measure that corresponds somewhat with our measure of local factors (population size), which should enable a fair comparison of the importance of network connectivity and local factors, we opted for a connectivity measure that captures the potential population that can be reached physically through infrastructural networks. Since we are also interested in the importance of networks at different spatial scales, we measure connectivity using contour measures at a regional scale and at a (inter)national scale (see below for details). Using population potential as an indicator for network connectivity suffices here since we are mainly interested in agglomeration economies through sharing', where we focus on metropolitan functions that require minimum population thresholds in order to be supported. In case we would have focused more on agglomeration economies through learning' or matching', other types of inter-urban network data such as co-publication and co-inventor networks (Hoekman et al., 2009), research cooperation in framework programmes (Camagni et al., 2015b), R&D collaboration networks (Scherngell and Barber, 2009), and inter-urban trade and foreign direct investment in high-tech sectors (Thissen et al., 2014) would have been more appropriate. DataFor this study, several databases were combined into a new dataset. First of all, data on metropolitan functions and their location was obtained from the Federal Institute for Research on Building, Urban Affairs and Spatial Development in Germany (BBSR, 2011). We selected metropolitan functions in the domain of international institutions' (including the presence of UN offices, EU institutions, international organisations and NGOs), firms' (presence of Fortune top-500 firms measured according to both turnover and number of employees, advanced producer services, banks, exhibition fairs), science' (presence of major universities, hosting of international research organisations), culture' (subdivided in cultural events, including music concerts, art fairs and film festivals; as well as cultural venues, including top-level theatres, opera houses, galleries and museums), and sports' (including sport stadiums, venues of Olympic summer games, and high level events of major sports). Data on individual metropolitan functions was gathered for a year in the 2004-2009 range, mostly 2008. For an extensive explanation of how this data was gathered, the reader is referred to BBSR (2011). In our analyses we consider both individual indicators in the domains of politics, science, firms, culture, and sports, as well as an index of all metropolitan functions. This index is calculated by normalizing the scores on each variable on a scale from 0 (minimum score) to 100 (maximum), and adding them up within the five domains, dividing them by the number of indicators involved. Following the same procedure, scores for the five domains are transformed into a general index measure of the presence of metropolitan functions. The database on metropolitan functions was gathered at the spatial scale of places (mostly defined at Local Area Unit-2, which is the municipal scale in many European countries) for the whole of Europe. Since this LAU-2 geographical level is too detailed for our study, we linked these LAU-2 codes to territorial delimitations of larger spatial entities as provided by the ESPON research programme. This includes three spatial entities: morphological urban areas' [MUAs], which are contiguous built-up areas, functional urban areas' [FUAs] which include MUAs and their hinterlands as defined by commuter basins, and so-called Potential Urban Strategic Horizons' [PUSH]-areas. The MUA and FUA delimitations are provided by the ESPON 1.4.3 project (IGEAT, 2007), which basically was an update of similar work in the ESPON 1.1.1 project (Nordregio, 2004). The latter project also provided the PUSH-area delimitations. Not for all European countries was it possible to link these territorial definitions in a satisfying way. Incongruences require us to focus on the countries of the former EU15 (with the exception of the UK), also including Norway and Switzerland. MUAs form the unit of analysis in our database, since these resemble the concept of urban agglomerations best. In total, our database contains all 1114 urban agglomerations in these 16 countries. In the remainder of this paper we will simply refer to them as cities, so disregarding that in many cases they are institutionally fragmented. We measure whether the extent to which metropolitan functions are present in cities is dependent on the position of these cities in regional and international/national networks. A city that is well embedded in infrastructural networks will have a much higher population potential than one that is not. Regional network connectivity is captured by the size of the population that can be reached within 45 minute travel time by car from the city (not including the city itself). Hence, it reflects regional connectivity and accessibility. The area within this 45-minute isochrone is known as the potential urban strategic horizon' [PUSH] area in ESPON terminology. To capture (inter)national network embeddeness, we make use of the potential accessibility to population by road, rail, and air (multimodal), taken from the ESPON research reported in University of Tours (2004) and Spiekermann and Wegener (2007), however using Spiekermann's and Wegener's 2009 update (data for the year 2006) available in the ESPON database. This accessibility measure takes into account the population outside of the FUA weighted by the travel time to go there.1 The most accessible regions can be found in the mega-regions with major international airports such as the Rhine-Main (Frankfurt am Main), Central Belgium (Brussels) and the Randstad (Amsterdam); the least accessible regions can be found in peripheral Portugal, Spain and Finland. The indicator, which we refer to as (inter)national network connectivity, expresses how well embedded cities are in international and national road, rail and air networks. Finally, in explaining the presence of metropolitan functions in cities, we include several control variables. At the local scale, we include GDP per capita (measured at the scale of FUAs), since it can be expected that a more affluent local society is able to sustain more metropolitan functions. Furthermore, we add a capital city' dummy, since capital cities are generally endowed with more metropolitan functions based on institutional rather than economic principles such as the support base of a city. Also, we include tourism, as more touristic places are likely to be able to sustain more metropolitan functions because tourists expand the support base. In a way, this indicator also reflects the presence of agglomerations in touristic networks, and is therefore perhaps a control variable that deserves more interest. The indicator is obtained from the BBSR (2011) and is measured as an index that takes in (1) stars that a destination received according to the Michelin travel guides and (2) presence of UNESCO heritage sites. Next to controls at the local level, we include country dummies in our models to capture, among others, institutional differences between countries with regard to the production of metropolitan functions. Descriptive statistics of the main variables included in the model and a correlation matrix are provided in Tables 1 and 2 respectively. Table 1: Descriptive Statistics of Variables included in the Baseline Regression (N=1114)
Table 2: Correlation Matrix (N=1114)
MethodologyTo explain the presence of metropolitan functions in cities, we employ zero-and-one inflated beta regression. Our dependent variable on metropolitan functions is an index, which takes a minimum value of 0 (no metropolitan functions) and a maximum value of 1 (MUA with the highest score on the index). Although it is not uncommon to handle index variables as continuous variables, estimation using Ordinary Least Squares (OLS) can result in inefficient and biased parameter estimates. To account for this characteristic, we make use of a beta regression model (Kieschnick and McCullough, 2003; Ferrari and Cribari-Neto, 2004).2 This type of model utilises the beta distribution, which makes it appropriate for modelling both binomially and non-binomially distributed response variables. In addition, beta regression models provide a natural way to address overdispersion by including an additional parameter (phi) to adjust the conditional variance of the proportion outcome. Because our dependent variable contains both zeros (no metropolitan functions) and ones (highest ranked place in terms of metropolitan functions), we make use of inflated beta regression models. Zero-and-one inflated beta regression involves three parts: a logistic regression model for whether or not the proportion equals 0, a logistic regression model for whether or not the proportion equals 1, and a beta regression model for the proportions between 0 and 1. Because our data particularly suffers from probability masses concentrated at 0, we predominantly focus on the zero-inflated part, herewith also acknowledging that there may be population thresholds for providing certain metropolitan functions. ResultsNetwork ConnectivityThis paper sets out to explore whether city network connectivity translates into a higher level of urbanisation economies, which are proxied with metropolitan functions, and to estimate how important this network connectivity is in comparison to local factors. Table 3 gives us the answer to the first part of this research question. It presents a zero-and-one inflated beta regression in which the presence of metropolitan functions, as measured by our aggregate Metropolitan Function Index, is explained by local variables (size) and network connectivity variables (regional and international/national), as well as our control variables (capital city dummy, tourism index, and GDP per capita). Please note that because we are not only interested in the statistical significance of effects, but also in the substantive and practical significance, we also report the average marginal effects (AMEs in table), which reflect the change in the index (scaled 0 to 1) as a result of an assumed 1 unit increase in the independent variable. Table 3. Zero-and-One Inflated Beta Regression on Metropolitan Functions Index
Robust standard errors in parentheses; **p<0.01, *p<0.05. All models are estimated with intercept. The one-inflated part is not displayed as it is an intercept-only model. AME = Average Marginal Effect. For the dummy variables the average marginal effect refers to a change of the variable from 0 to 1. What follows from Table 3 is that both size and connectivity in (inter)national networks positively contribute to the presence of metropolitan functions. Cities borrow size through being well embedded in (inter)national networks. Interestingly, being well embedded in regional networks does not translate into more metropolitan functions. Hence, scale is important, while network connectivity is clearly positive on an international/national scale, but not necessarily on a regional scale. The latter can perhaps be explained by the fact that opportunities to experience an agglomeration shadow are stronger on a regional scale as many cities will have other cities in their PUSH-area (that is, within 45 minutes distance). When having such neighbours, it may be that a positive borrowed size effect for one city is compensated for by a negative effect (an agglomeration shadow') for another, leading to the insignificant overall effect reported in Table 3. The negative sign suggests even that such agglomeration shadows may dominate over borrowed size effects, or suggest that more cities face agglomeration shadows than that cities experience borrowed size. Such a finding would be in line with Meijers and Burger (2010) who found that more polycentric metropolitan areas in the U.S. enjoy less agglomeration benefits related to size, and Burger et al. (2015) who found that cultural amenities are disproportionally concentrated in the places that are the largest in their FUA, casting an agglomeration shadow over others.3 The average marginal effects for our control variables suggest that the influence of GDP per capita on the presence of metropolitan functions is limited, whereas being the capital increases metropolitan functions substantially. Being a tourist destination also helps to sustain more metropolitan functions. Network Connectivity Versus SizeOur interest is also in comparing the importance of network connectivity with the importance of local size. When we compare the average marginal effects of the variables in Table 3, we see that the average marginal effect of local size appears to be substantially larger than the average marginal effect for (inter)national network connectivity. The average marginal effect ( AME in the table) of the local population size is 0.0077, meaning that an increase in population size by 100,000 increases the high-end amenities (an index with minimum 0 and maximum 1), on average, by 0.0077. The fact that the average marginal effect is low indicates that there is a considerable population threshold that must be achieved to host metropolitan functions. On the contrary, an increase in (inter)national network connectivity by 10 million would, on average, only result in an increase in the Metropolitan Functions Index by 0.0013. Hence, local size seems to be more important for the hosting of metropolitan functions than network connectivity. At the same time, it should be taken into account that the standard deviation of our (inter)national network connectivity measure is much lower than the standard deviation of our local size measure. Therefore, we also evaluate how the Metropolitan Functions Index changes when (1) the local size of the MUA increases from the 25 th percentile (34.000 inhabitants) to the 75 th percentile (112.000 inhabitants) and (2) the (inter)national network connectivity increases from the 25 th (42.3 million people) to the 75 th percentile (69.9 million people). Whereas an increase in local size from the 25 th to the 75 th percentile would result in an average increase of the Metropolitan Function Index by 0.0080, an increase in the (inter)national network connectivity from the 25 th to the 75 th percentile would result in an increase of this figure by 0.0032. This underlines once more that, on average, local size is more important than network connectivity in determining the level of metropolitan functions in cities. Heterogeneity: The Importance of Networks and Size for Different Metropolitan FunctionsAt the same time, it could well be that the importance of network connectivity and size differs across metropolitan functions. Where some functions have a more local or regional reach, some functions might have an international reach and therefore their supply is more dependent on urban connectivity rather than urban scale. Accordingly, we re-estimate our baseline model presented in Table 4 using individual metropolitan functions rather than the aggregate index. Table 4: Comparison of importance size versus networks for different Metropolitan Functions
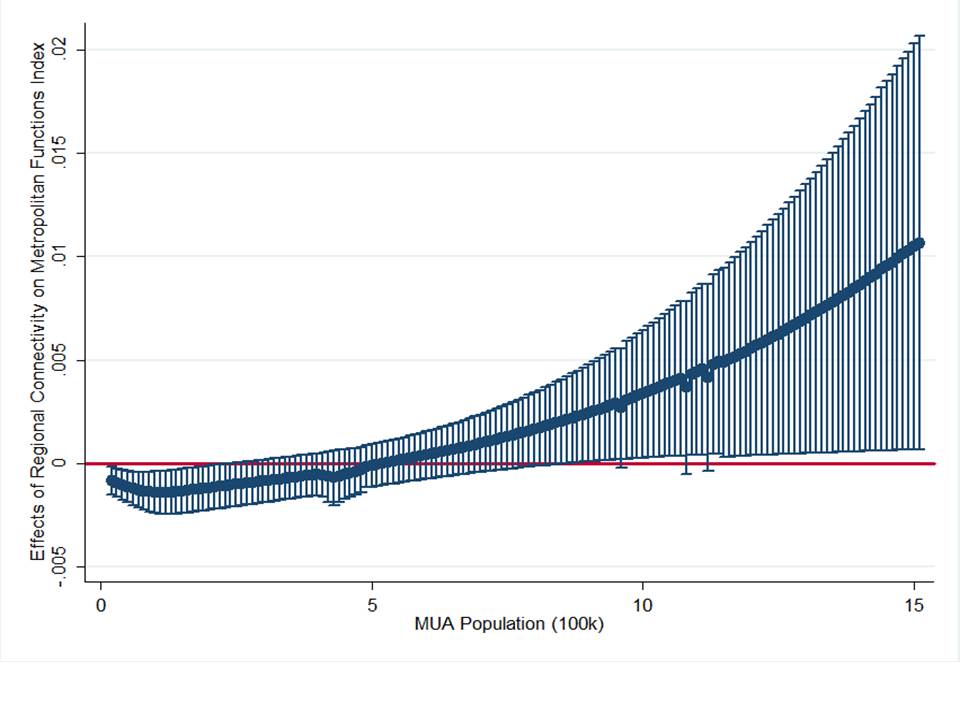
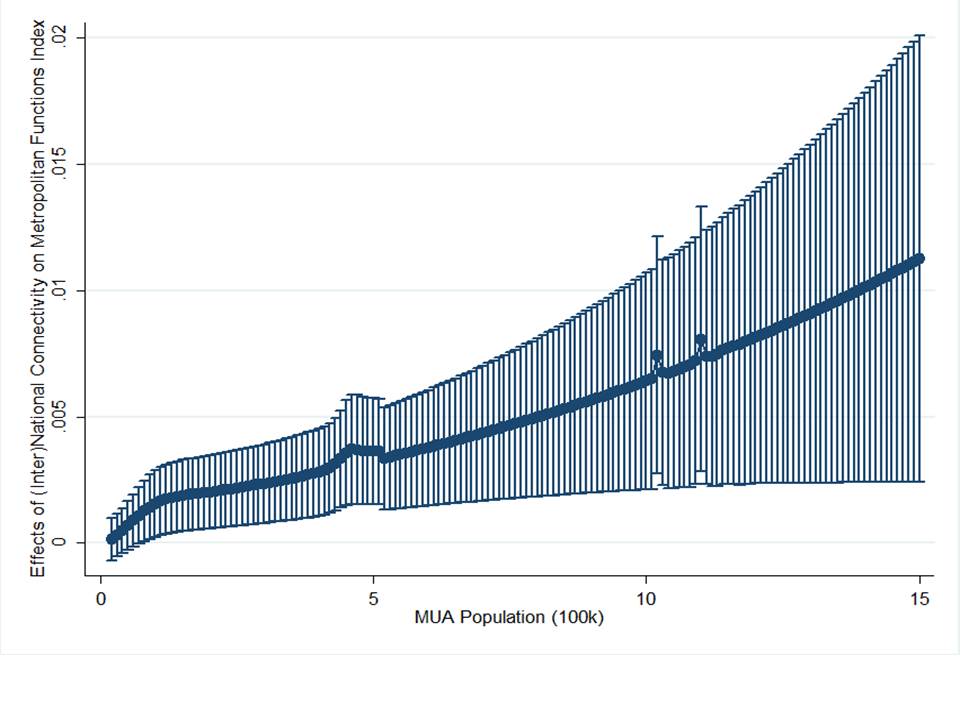
Robust standard errors in curly brackets; 95% confidence interval in square brackets; **p<0.01, *p<0.05, # p<0.10. For all estimations, the intercept, GDP per capita, capital city dummy, tourism index, and country dummies were included. Full models are available on request. AME = Average Marginal Effect. a Marginal effect estimated at the 25 th percentile for the respective variable, holding all other variables at their means. 1 Displayed is an indicator of command and control functions obtained from Csomos and Derudder (2014). Results are similar to the top-500 firms data of the BBSR (2011). In line with our expectations, there is some variety in the importance of network connectivity and local size when considering individual metropolitan functions. Local size is a significant determinant of all metropolitan functions. Network connectivity at the (inter)national scale is an important factor for the majority of metropolitan functions included in our research, but certainly not all. For cultural and sports-related metropolitan functions, we found that only the presence of cultural venues is linked to (inter)national network connectivity. This is not surprising, since culture and sports have often a local support base (see also Burger et al., 2015). For firms and international organisations, this (inter)national network connectivity is of more importance. When tentatively assessing the relative importance of local size vis-à-vis (inter)national network connectivity by comparing (1) a shift in the local size of a city from the 25 th percentile to the 75 th percentile with (2) a shift in the (inter)national network connectivity from the 25 th to the 75 th percentile, we can even conclude that, on average, (inter)national network connectivity is often more important than local size for the presence of functions. In particular, the presence of fairs and international organisations seems to be more dependent on (inter)national network connectivity than on urban size. A similar observation can be made for the metropolitan function related to science. Especially for patents and international conferences, network connectivity is crucial, but it does not explain the presence of universities. These were largely established a considerable time ago, and are far from footloose. At the same time, regional network connectivity does generally not affect the presence of individual metropolitan functions. However, there is a significant, but negative average marginal effect of regional network connectivity on the presence of advanced producer services firms, conferences, the number of patents, cultural venues, and sport events. Most of the signs of the average marginal effects for the other variables are also negative (but statistically insignificant). Like the results presented at the aggregate level in Table 3, a plausible explanation is that cities that are part of a larger metropolitan area, also face more agglomeration shadows through competition with other cities within the same region. Again, it appears that, at a regional level, agglomeration shadows dominate over borrowed size effects, or at least, that there are more cities that face an agglomeration shadow than the number of cities that borrows size. In sum, especially good connectivity in international/national networks benefits cities, whereas a good connectivity in regional networks is likely to benefit only a number of cities and has, on average, a negative effect on the presence of metropolitan functions due to competition effects. Hence, (inter)national network connectivity can be considered to be a more important substitute for urban size than regional network connectivity. Heterogeneity: The Importance of Networks and Size for Different CitiesAt the same time, it can be argued that not for all cities local size, regional network connectivity and (inter)national network connectivity are equally important for the level of metropolitan functions present. In this regard, Burger et al. (2015) found that the largest place in a region is better capable to borrow size through regional and (inter)national networks than lower-ranked places. A reason for this is that agglomeration economies are stronger than the agglomeration diseconomies which attract all activities in a globally connected region to the core. Alternatively, it can be argued that a minimum urban scale is required to profit from (inter)national network connectivity, since some metropolitan functions require both urban scale and (inter)national networks. To test these assumptions, we estimated additional regressions on the Metropolitan Functions Index, including interaction terms between the size and connectivity variables. Since interaction effects are generally difficult to interpret in non-linear models, we graphically show how the average marginal effect of local size, regional network connectivity, and (inter)national network connectivity varies across the size of cities between 15,000 and 1,500,000 inhabitants (all observations that fall approximately within 3 standard deviations of the mean, excluding outliers). Figure 1 shows that although an increase in local size has only a small effect on the presence of the metropolitan functions in cities with more than 150,000 inhabitants (85% of the cities), particularly small cities gain metropolitan functions by increasing scale. At the same time, larger cities profit more from regional and (inter)national connectivity. The average marginal effect of regional network connectivity on the presence of metropolitan functions is positive for cities with over 500,000 inhabitants and for cities with less than 250,000 inhabitants it is generally negative (Figure 2). Likewise, the average marginal effect of (inter)national network connectivity on the presence of metropolitan functions is significantly larger for larger cities (Figure 3). This highlights the importance of a combination of scale and connectivity for the hosting of metropolitan functions. These results underline the relevance of the distinction in town-ness' versus city-ness' made by Taylor et al. (2010). They describe town-ness as a process that links urban places to their hinterlands, generally involving the hierarchical relationships also found here. City-ness' then addresses the more horizontal inter-urban relations beyond the hinterland, and they argue that [g]enerally, the larger urban places are less constituted by town-ness and more by city-ness (Taylor et al., 2010:2810). Figure 1: Fitted equation and 95% confidence interval for metropolitan function index and local population size (average marginal effect)
Figure 3: Fitted equation and 95% confidence interval for metropolitan function index and (inter)national network connectivity by local population size (average marginal effect) |
||||||||||||||||||||||||||||||||||||||||||||||||||||||||||||||||||||||||||||||||||||||||||||||||||||||||||||||||||||||||||||||||||||||||||||||||||||||||||||||||||||||||||||||||||||||||||||||||||||||||||||||||||||||||||||||||||||||||||||||||||||||||||||||||||||||||||||||||||||||||||||||
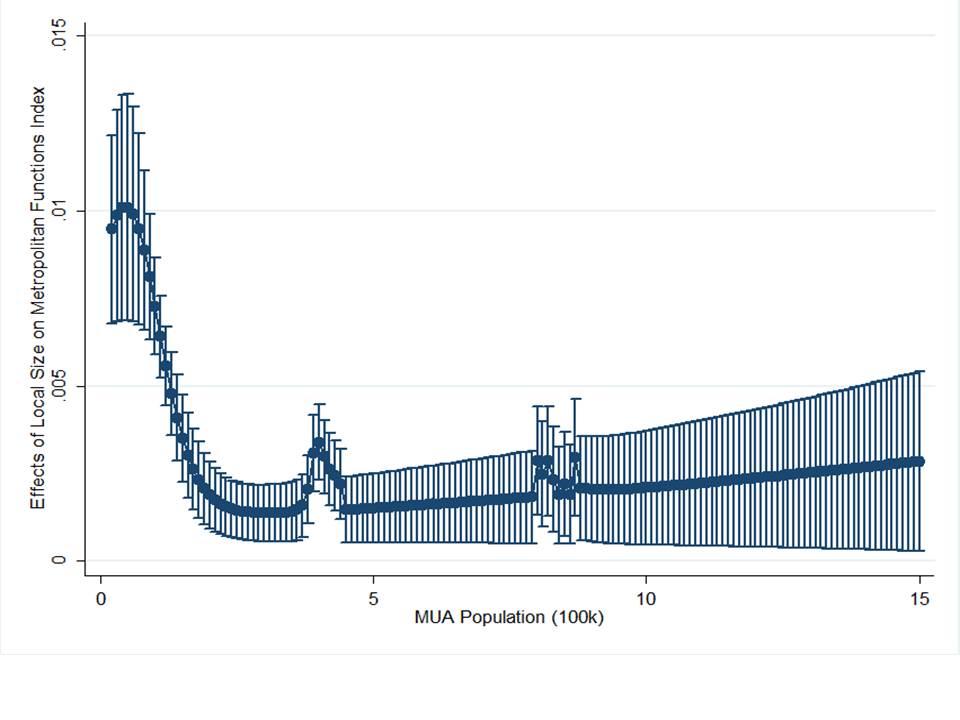 Figure 2: Fitted equation and 95% confidence interval for metropolitan function index and regional network connectivity by local population size (average marginal effect)