GaWC Research Bulletin 430 |
|
|
|
This Research Bulletin has been published in Geoforum, 50, (2013), 241-251. doi:10.1016/j.geoforum.2013.09.015 Please refer to the published version when quoting the paper
INTRODUCTIONSince the mid-1980s, it has become common – especially thanks to the works of Friedmann (1986) and Sassen (1991) – to demonstrate the current globalization of economy through cities (see, for instance, Friedmann, 1986; Sassen, 1991; Taylor, 2004; Castells, 2010; Taylor et al., 2011). The majority of these works focus on the command and control function of the major cities of the global economy, which is often determined on the basis of location of the headquarters of the leading multinational companies (see, for instance, Godfrey and Zhou, 1999; Alderson and Beckfield, 2004; Zhao et al., 2004; Taylor et al., 2009; Csomós, 2011; Taylor and Csomós, 2012; Liu and Derudder, 2012). These publications are primarily concerned with two geographical regions: the Asia-Pacific region, which is the most dynamically developing region of the global economy, with China being a focus of interest (see, for instance, Smith and Timberlake, 2001; Poon and Thompson, 2001; Yulong and Hamnett, 2002; Sim et al., 2003; Olds and Yeung, 2004; Wu and Ma, 2006; Jiang and Shen, 2010; Mahutga et al., 2010; Lai, 2012; Lee et al., 2012) and Europe, which has suffered the most from the effects of the recent global financial crisis (see, for instance, Derudder et al., 2011; Taylor et al., 2012; Csomós and Derudder, 2013). While Asian cities have begun to take on crucial command and control functions, the leading cities of European countries are characterized by stagnation. At the same time, current research has not been focused on the United States because its role in economic control – in contrast to the Asia-Pacific region and Europe – has remained relatively constant. In the case of the leading economies of the Asia-Pacific region, the major command and control functions are concentrated in the Beijing-Shanghai-Hong Kong triad in China (Lin, 2004; Taylor, 2004; Lai, 2012a; Lai, 2012b), the Tokyo-Osaka-Nagoya triad in Japan (Rimmer, 1986; Hill and Fujita, 1995) and the Mumbai-New Delhi-Kolkata triad in India (Panagariya, 2008; Nijman, 2012). By contrast, the European Union is bipolar due to the dominant position of the London-Paris city pair (Halbert and Pain, 2009; Taylor and Csomós, 2012). Moreover, it is also worth noting that Europe contrasts with China, Japan and India in that its second-tier cities (e.g., Amsterdam, Madrid, Milan, Moscow, Munich, Stockholm, and Zurich) also have important global and regional command and control functions. This means that the European Union has a more complex system than the leading economies of the Asia-Pacific region. In the United States, on the other hand, the most important command and control center is New York, whose leading global position – as a symbol of the economic power of the United States – has been solid for decades (see, for instance Noyelle and Stanback, 1984; Friedmann, 1986; Harper 1987; Sassen, 1991; Abu-Lughod, 1995; Knox, 1995; Knox, 1997; Beaverstock et al., 1999; Beaverstock et al., 2000; Taylor et al., 2009; Lee et al., 2012). However, economic control is most complex in the United States – compared to China, Japan, India, and the European Union – where there are several cities in addition to New York that fulfill crucial command and control functions (Lyons and Salmon, 1995). These cities (e.g., Atlanta, Boston, Chicago, Dallas, Houston, Los Angeles, San Francisco, and San Jose) play an important role in the economy of the United States and also are the leading cities of the world economy in certain industry sectors (e.g., Houston and Dallas in the Energy sector and San Jose in the Information Technology sector). However, since 2007, the world economy has been affected by a financial crisis, which was then followed by an economic crisis. Problems in the financial sector had a negative impact on consumption, particularly in Western economies leading to a poor performance by the Consumer Discretionary and Consumer Staples sectors. This then had a negative effect on all other sectors, including the Industrials sector, the Materials sector and the Energy sector. Consequently, the position of cities with a role in economic control has radically changed: some lost their significance after their major banks and other companies went bankrupt, ceased to exist, or were acquired, whereas others ended up in a better position because the companies determining their industrial profile were more resistant to the effects of the crisis. In some cases, they have even become more powerful due to the bankruptcy or acquisition of their competitors. This has, in turn, resulted in significant changes in the command and control functions of cities. Because the European Union, or more precisely the Eurozone, remains in crisis, while the United States has already emerged from it (De Grauwe and Ji, 2013), I use the latter to illustrate how the structure of economic control has changed. In this work, I examine the command and control function of 128 cities in the United States from 2006 to 2012, while combining the crucial financial parameters of the global companies of these cities. In the first part of the paper, I introduce the Command and Control Index (CCI) to measure the functions mentioned above in a precise manner. I calculate the CCI by integrating revenues, assets, profits and market value – which I took from Forbes 2000 – into a single measure. The CCI enables us to place the cities not only in a national but also in a global context. The positive (growth of Asia) and negative changes in the global economy have had different effects on different industrial sectors, which was reflected in the shifting position of cities. Therefore, in the second part of the paper, I examine what industrial sectors determine the industrial profile of the leading cities. Furthermore, I show how the position of cities, as calculated on the basis of their CCI, has shifted as a result of the economic crisis. The research background of command and control functionsIn his seminal work entitled The World Cities, Hall (1966) provided a detailed list of the factors that create world cities. For instance, he considered whether a city is a major center of political power, a seat of the most powerful national governments, a widely known international organization, a transportation center or an integral part of global commerce. In addition, he also considered whether or not a given city plays a crucial role in the global economy. This attribute is reflected mainly in the size of production in the city, the number of those employed and whether the city is an important headquarters of multinational industrial concerns that have crucial impacts on the global economy. Hall’s research on cities is an important milestone, as it made clear that the role of world cities is critical in the global economy and that the concentration of multinational companies in those cities is of central importance. Accordingly, since the beginning of the 1970s, a number of works have determined the global significance of a city based on the number of headquarters it hosts and the performance of its multinational companies (see Hymer, 1972; Heenan, 1977; Cohen, 1981; Friedmann and Wolff, 1982; Friedmann, 1986; and Glickman, 1987, among others). At the same time, many developed countries experienced important economic restructuring and technological transformation between 1970 and 1990, which led to a reduction in manufacturing employment in almost all countries (Castells, 2010). These changes naturally had an impact on cities. According to Sassen (1995: 65), the formation of a new urban economic core of banking and service activities came to replace the older, typically manufacturing-oriented core. The introduction of Sassen’s (1991) notion of a global city was also crucial. Since then, the major cities of the global economy have been investigated in a different manner, with advanced producer services at the forefront of attention. Sassen describes global cities – such as New York, London, Tokyo, Paris and Frankfurt – not only as headquarters of large corporations and large commercial banks but also as the centers of finance, global servicing and management. They are the most prominent sites of postindustrial production. Taylor (2004: 24-25) claims that Sassen’s purpose is nothing less than to seek to displace the focus of attention from the familiar issues of the power of large corporations. Global cities are more than “command centres,” they are the first “global service centres” in urban history. Sassen (2006:108) notes that the producer-services complex – although strongly geared toward the corporate sector – is far more likely to remain concentrated in urban centers than are the multinational headquarters they serve. Furthermore, Godfrey and Zhou (1999) argue that headquarters functions are a poor way of measuring the “global urban hierarchy,” and suggest more emphasis be given to first-level regional subsidiaries that reflect strategic location decisions rather than simply where a company first started. Since the mid-1970s, we have observed a new tendency – especially in the United States: Large corporations tend to relocate their headquarters to smaller cities with improving infrastructure and lower costs (Lyons and Salmon, 1995). In addition, Sassen (2006: 107) shows that more and more large cities now have only secondary headquarters for highly specialized functions. Therefore, while the advanced producer services are still located in major cities, the command and control functions are distributed to regional and subregional centers of the urban network. From the perspective of command and control functions, some regional centers occupy a better position in the urban hierarchy than world cities (Godfrey and Zhou, 1999; Alderson and Beckfield, 2004). On the basis on the performance of their companies, these regional centers can eventually become focal points of the global economy in certain industry sectors (Taylor and Csomós, 2012). In this paper I examine the position of cities in the economy of the United States exclusively on the basis of their command and control functions. Research on world cities looking at advanced producer services shows that the group of the most important cities has not changed substantially in the past two decades (see Beaverstock et al., 1999; Taylor, 2011 among others). By contrast, the fluctuation of command and control functions in cities shows quite clearly the current economic processes of restructuring. Data and methods in the analysis of command and control functionsIn this analysis, I have used data from the Forbes “The Global 2000” database from the years 2006 and 2012. These data correspond to the main financial data (revenue, market value, asset, debt, cash on hand and profit) of the 2,000 largest public companies of the world. I have identified the headquarters of these companies on the basis of Bloomberg’s Company Profile (http://www.bloomberg.com/markets/companies/). To examine the shifting position of the individual cities in the Forbes 2000 data more thoroughly, I look at the data through the prism of metropolitan areas, thereby integrating information on revenue, assets, profits and market values into a single measure (Csomós, 2012). First, I define my units of analysis as metropolitan areas as demarcated by the respective national statistical offices and the Office of Management and Budget in the United States. For instance, in my framework, “New York” corresponds to the New York-Northern New Jersey-Long Island, NY-NJ-PA Metropolitan Statistical Area, which includes the principal cities of New York, Newark, Edison, White Plains, Wayne, Union and New Brunswick. Florida and Jonas (1991), Lyons and Salmon (1995) and Sassen (2006) all stress that in the United States, the relocation of headquarters from large cities to suburban areas has become quite common since the 1970s. This phenomenon is what Florida and Jonas refer to as the decentralization of corporate organizations. According to Garreau (1991), Brenner (2002), and Ross and Levine (2012), this development has resulted in a significant change in the suburban network of metropolitan areas: suburbs began to have an active role in the economy, as has been mentioned above. This change may be illustrated by the New York-Northern New Jersey-Long Island MSA, where 53 companies out of 82 are located in New York City, whereas 29 companies are based in 24 smaller or larger cities within the metropolitan area. A similar organization of headquarters may be observed in the case of all major cities including Atlanta, Boston, Chicago, Dallas, Detroit, Houston, Los Angeles, Minneapolis, Seattle, St. Louis, and Washington. In this analysis, I identify these metropolitan areas with a central city given the dominance of such cities. By contrast, some urban agglomerations are polycentric in terms of the location of headquarters. In other words, they do not have a “central city” in this regard. This finding is exemplified by the San Jose-Sunnyvale-Santa Clara, CA Metropolitan Statistical Area (also known as the Silicon Valley), where the major headquarters cities (San Jose, Sunnyvale, Santa Clara, Palo Alto, Mountain View and Milpitas) have similar headquarters functions. I identify such polycentric agglomerations with their most populous city. Second, instead of merely counting the number of Forbes 2000 headquarters in the metropolitan areas, I integrate information on the key indicators of firm size and performance, as specified in GaWC Data Set 26 (Csomós, 2012). The level of command and control is expressed by the Command and Control Index (CCI). CCIx,y of a given city x in a given year y is calculated as follows:
Where:
The Forbes Global 2000 classifies corporations into 80 industry categories on the basis of their activity profiles. In the analysis, I have reclassified the companies operating in these industry categories into the 10 basic sectors (Consumer Discretionary, Consumer Staples, Energy, Financials, Health Care, Industrials, Information Technology, Materials, Telecommunication Services, and Utilities) of the Global Industry Classification Standard (GICS) developed and used by Morgan Stanley Capital International (MSCI) (http://www.msci.com/resources/pdfs/MK-GICS-DIR-3-02.pdf) and Standard & Poor’s (S&P). A global outlookThe United States is the world’s largest economy. Its GDP equals the cumulative GDPs of China, Japan, and Germany, which rank directly below the United States’ economy, which alone constitutes one-fifth of the global GDP (IMF, 2011). As Table 1 illustrates, the command and control function of the United States in the global economy is even more striking: In 2012, 27% of the headquarters of the companies examined here were located in the United States, whose cumulative CCI was almost 31% of the global index, i.e., the cumulative CCI of China’s, Japan’s, the United Kingdom’s, and France’s CCI. At the same time, however, the period between 2006 and 2012 was characterized by a new global tendency: the leading economies – the United States, Japan, and the countries of Western Europe – tended to lose their global command and control functions to the emerging economies, especially Brazil, Russia, India, and China (which are also referred to as BRIC countries) (Bianconi et al. 2013). The number of headquarters in the United States decreased by 162 between 2006 and 2012, which is by itself more than the decline in the headquarters located in the United Kingdom and France combined. This is the second most significant decrease after Italy. As for its CCIs, the United States showed an average decrease. China showed the biggest increase in all respects. Concerning the number of headquarters, it came third after the United States and Japan and, as for its CCI, in 2012 it became the second most significant command and control country in the world, outranking Japan. Comparatively, Brazil, India, and Russia also showed a significant increase in their CCI, albeit much less than what China, while, among developed countries, only Australia and South-Korea were characterized by a considerable increase. Table 1: The relevant data of the major economies in 2006 and 2012
A shift in production from west to east is not a novel tendency – at least as far as countries are concerned. Table 1 highlights that it is not only the volume of production but also the command and control functions that have shifted from west to east. However, our characterization of national economies is too general to inform us about patterns of spatial restructuring. The data above do not apply in a straightforward manner to the regional location of the command and control centers of the global economy. Table 2 illustrates that in 2012, the leading cities were more or less those that topped the ranking in 2006. Changes occurred mainly in the position of cities. New York, Tokyo, and London were the most important command and control cities of the global economy in both years despite the fact that the CCI decreased in all three cities (in the case of New York the decrease of the CCI surpasses the cumulative index of Seoul, which came sixth in 2012). In the case of the leading cities of the developed economies, the significant decrease of the CCI is primarily due to the crash of the financial sector. Largely as a result of the economic crisis that started in 2007/2008, the CCI of New York, London, Tokyo, Paris, and Zurich, which led the financial sector in 2006, showed an average decrease of 23.5% in 2012. As a consequence of global restructuring, new cities appeared in the 2012 ranking: important command and control centers of emerging economies, such as Moscow, Mumbai, and Rio de Janeiro, became leading cities of the global economy. However, it was Beijing that showed the most significant increase, growing by 337% since 2006. It became the fourth most important command and control center of the world economy, outranking Paris. The cumulative CCI increase of Beijing was primarily due to the Financial and Energy sectors. On the one hand, the growth of giant Chinese banks (Industrial & Commercial Bank of China, China Construction Bank, Bank of China, and Agricultural Bank of China) means the CCI of Beijing’s financial sector has come close to that of New York, which has ranked first for many years. In 2006, New York had a CCI 12.5 times higher than the CCI of Beijing, whereas in 2012, this difference between the two cities shrank to 1.05. As a result, Beijing has become the second-largest financial command and control center of the global economy, outranking London, Tokyo, and Paris. However, the companies in the energy sector (PetroChina, Sinopec, and CNOOC) serving the industrial production in China (Crompton and Wu, 2005) and the rapidly developing car manufacturing sector (Wang et al., 2011) have also shown rapid growth, leading Beijing to become the biggest command and control center of the world in this sector. It is for similar reasons that there has been a significant CCI increase in the leading cities of the emerging countries mentioned above: Moscow’s and Mumbai’s changing positions are primarily due to the companies in the Energy sector (Gazprom, Lukoil, Rosneft, and Reliance Industries), whereas Rio de Janeiro’s position change is due to companies in the Materials sector (Vale) in addition to the Energy sector (Petrobas). Table 2: Cities with the highest CCI in 2006 and 2012
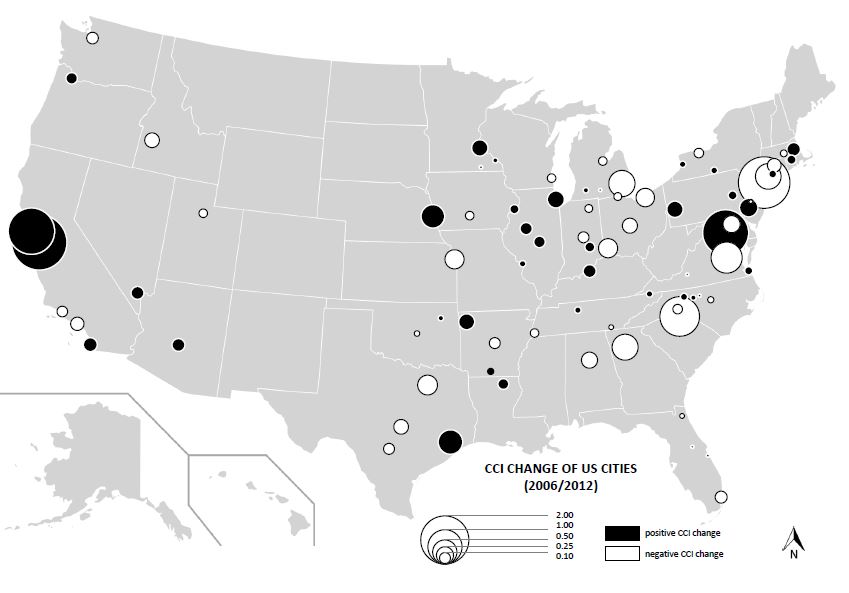
The command and control centers of the United StatesThe number of Forbes 2000 companies in the United States decreased by 23% between 2006 and 2012, and the CCI of the Unites States also decreased by almost 18%. In 2006, 695 headquarters were located in 116 cities, whereas in 2012, only 533 headquarters were mentioned in the Forbes ranking, which belonged to 105 cities (Figure 1). The number of headquarters cities has decreased by less than 10% since 2006 (in contrast to the 23% decrease in the number of companies mentioned above), which leads us to the conclusion that the decrease in the number of companies is concentrated in leading command and control centers. In other words, the majority of the companies that are no longer listed in Forbes 2000 are headquartered in the leading cities. Figure 1: The CCI change of the command and control centers in the United States between 2006 and 2012
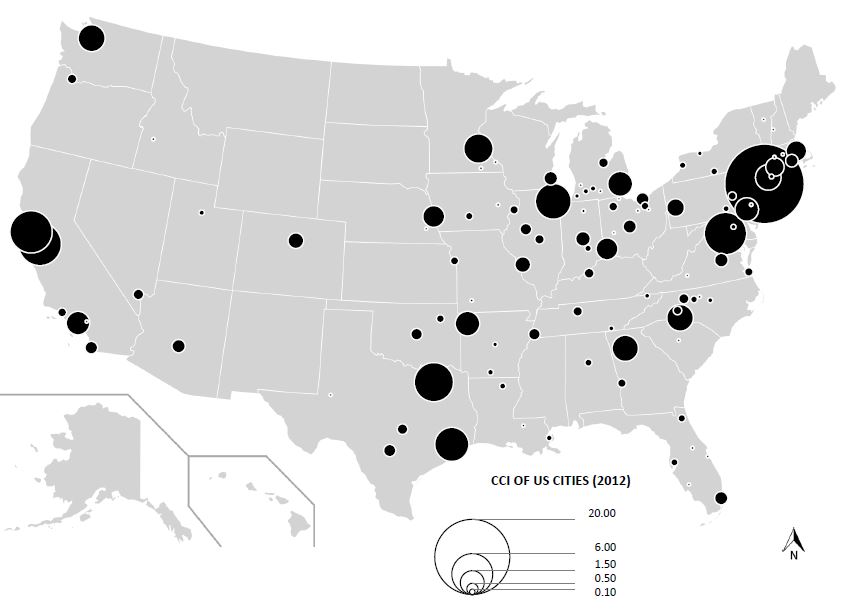
Table 3 shows that in both 2006 and 2012, the primary command and control center of the United States was New York, which accounted for one fifth of the CCI of the United States in both years. The decrease of New York’s CCI had a strong impact on the CCI of the United States: the national CCI decreased by 34%, primarily because of the decrease of New York’s CCI. In spite of this change, New York was still undoubtedly the major command and control center of the United States in 2012, and its position is not challenged by any other city (Figure 2). In 2006, the CCI of New York was 4.3 times as much as that of Dallas, which ranked second, whereas in 2012, the CCI of New York was only 3.4 times as much as that of San Jose, which ranked second in that year. This finding is indicative not only of the decrease of the CCI of New York, but also to the increase of the CCI of the cities below New York in the ranking in both relative and absolute terms, as illustrated in Section 6. Whereas in 2006 the CCI of New York was surpassed by the cumulative CCIs of the six cities, Dallas, Washington, San Francisco, Chicago, Charlotte, and San Jose, that came after New York, in 2012 it only took four cities, i.e., San Jose, Washington, San Francisco, and Dallas, to achieve this. San Jose, Washington, and San Francisco showed the largest increase in their CCI among the leading command and control centers in the United States (Figure 1) despite the fact that the number of Forbes 2000 companies’ headquarters decreased in all three. Table 3: Major command and control centers in the United States with the highest CCI in 2006 and 2012
There were 93 command and control cities in the United States that had a CCI in 2006 and 2012: in 43 cases, the CCI showed an increase, in 10 cases there was no significant change (+/-1%) in the CCI, and in 40 cities, the CCI decreased by greater or lesser degrees. Figure 2: The CCI of the command and control centers in the United States in 2012
To understand and explain the changes, we must examine the GICS sectors that have been affected by the economic crisis to varying degrees. This approach is important because the CCI of individual cities is influenced by what industrial sectors characterize the industrial profile of a city. The GICS sectors influencing the command and control function of citiesIn 2006 and 2012 it was the Financial sector that had the highest CCI in the United States. One third of the cumulative CCI was due to this sector in 2012 (Table 4) in spite of the fact that it has decreased by 11% since 2006 and, out of all sectors, has shown the greatest decrease in absolute value (-3.6795). Although the CCIs of the individual cities have changed to different extents since 2006, the decrease was primarily due to the decrease of New York and Charlotte (Table 5). In spite of this finding, the CCI of New York’s financial sector was outstandingly high (12.0949) in 2012: it was close to the cumulative CCI of San Jose and Washington, which ranked second and third (Table 3). In 2012, New York was the only city in the United States whose companies appeared in the Forbes database in all GICS sectors, and yet almost 56% of its CCI was due to the Financial sector (This was 61% in 2006.). In spite of the decrease of the CCI, New York remains the financial center of the United States. The Financial sector of Charlotte was driven by only one company (as opposed to New York’s 30 financial organizations), Bank of America, which had an outstandingly successful year in 2006. In 2012, however, both Washington and San Francisco ranked more highly in this sector than Charlotte, and, as Table 5 shows, where the CCI of all sectors decreased. At the same time, the increase in the cumulative CCI of Washington is due to the Financial sector. This increase was surpassed only by the performance of the Information Technology sector of San Jose between 2006 and 2012. This rather significant increase occurred because the assets of Fannie Mae (Federal National Mortgage Association) and Freddie Mac (Federal Home Loan Mortgage Corporation) increased by almost 200%, due to the financial support of the Treasury of the United States, which was necessary to offset Fannie Mae’s and Freddie Mac’s liabilities. Prior to this, the two government-sponsored enterprises (GSE) were put into conservatorship in 2008. Table 4: The main data of GICS sectors in 2006 and 2012
The CCI of the Financial sector also showed a significant increase in San Francisco. However, this increase only partially contributed to the increase of the city’s cumulative CCI and in a less significant manner than in Washington. The reason for this is that San Francisco has more GICS sectors involving major companies and that its CCI increased (albeit minimally) even without the significant increase of the Financial sector. Table 5 shows that the increase of the CCI was primarily due to the Energy sector and the Information Technology sector in addition to the Financial sector (Wells Fargo, Visa, and Prologis). The Bay Area agglomeration (especially the San Jose agglomeration) has long been characterized by a strong Information Technology sector (Walker, 2006). Leading IT companies such as Autodesk, Oracle (which was the 6th most valuable company in 2012 in the world, and ranked 8th among IT companies in terms of revenues) and Salesforce.com all operate in the San Francisco agglomeration. Nevertheless, the performance of the Energy sector is due to a single company: Chevron, the giant oil company, is among the ten leading companies in the world in terms of all financial indices, except assets. The Energy sector – as illustrated by Table 4 – showed a significant increase in terms of both the number of companies (six new companies since 2006) and its CCI (+2.2786). This increase is due to the strikingly positive financial performance of the traditional oil companies, as after a low point in 2009. Oil prices in 2012 were close to those of 2008 (see U.S Energy Information Administration, Gasoline and Diesel Fuel Update 2013, Full History: http://www.eia.gov/petroleum/gasdiesel). The strong position of two major cities in Texas, Houston and Dallas – and also that of San Francisco, with its more complex industrial profile – is largely due to oil companies. Both cities had similar CCIs in terms of their Energy sector (Dallas: 3.2620, Houston: 3.4687) in 2012, and both ranked among the top cities exclusively due to this sector. As for the command and control centers of the Unites States, the Energy sector is concentrated, as 75% of the CCI of this sector was attributable to San Francisco, Dallas, and Houston in 2012. It is clear that this sector has a more important role in Houston: 19 out of the 27 Forbes companies operated in the Energy sector (including one of the world’s biggest oil companies, ConocoPhilips), and 86% of the CCI of Houston was due to the Energy sector. By contrast, Dallas’s position in this sector is due to only four companies. More specifically, it is due mainly to the giant oil company, ExxonMobil in Irving, Texas, which was the second most valuable company in the world in 2012. In addition, it ranked third in terms of turnover and had the greatest profit in this year. The Information Technology sector, which has shown the greatest (+2.9303) and most dynamic (+26.40%) increase, is also rather concentrated, similar to the Energy sector: In 2012, San Jose, Seattle, New York, and San Francisco, which had the highest CCIs in this sector, provided almost 83% of the sector’s CCI. In the United States, the center of the Information Technology sector is San Jose, which provided 39% of the sector’s CCI in 2006. In 2012, this share was 52%. The significant increase was due to Apple, Google, Intel, and Cisco, with Apple being the world’s most valuable company in 2012, outranking ExxonMobil, which had ranked first in previous years. Only New York and Seattle have a significant CCI in the Information Technology sector, outside of the Bay Area agglomeration (San Jose, San Francisco) which constitutes the leading center in this sector. It is characteristic of both cities that the CCI of the Information Technology sector is primarily determined by a single company, which is IBM (Armonk) in the case of New York and Microsoft Corporation (Redmond) in the case of Seattle. Both in 2006 and 2012, the Consumer Discretionary sector ranked second in the ranking of the sectors’ cumulative CCI, and the second most companies also operated in this sector (Table 4). The Consumer Discretionary sector is the most complex sector because it comprises approximately 20 industries, which have different profiles (including Auto & Truck Manufacturers, Broadcasting & Cable, Casinos & Gaming, and, Department Stores). Although New York had the highest number of companies in the sector in both years (15 in 2006, 17 in 2012), it was outranked by both Fayetteville and Detroit in terms of CCI. However, the industries of the Consumer Discretionary sector of the three cities are rather different (thanks to the peculiarity of the classification), which accounts for their position in the ranking. New York is the center of the media industry in the United States (and the world) (Hoyler and Watson, 2012). Two thirds of the companies in the Consumer Discretionary sector CCI operated in the media industry. The CCI of New York increased (albeit moderately) even during the recession thanks to the relatively stable performance of the media industry. The second position in the sector’s ranking is occupied by Fayetteville, which came 14th in the ranking of cities in 2012 thanks to a single company. Wal-Mart Stores, which operates in the retail sector, is located in Bentonville (Arkansas) in the Fayetteville-Springdale-Rogers Metropolitan Area. Wal-Mart Stores ranks second in turnover and is the world’s 11th most valuable company. The sector’s ranking was topped by Detroit in both 2006 and 2012, but its CCI showed a constant decrease. This finding is due to the fact that every company in Detroit’s Consumer Discretionary sector operates in the car manufacturing industry, which suffered serious losses during the recession (General Motors, which is one of the world’s biggest car-manufacturing company, continues to operate thanks to governmental reorganization and previous loans). As Sassen (2006: 107) argues, some of the largest firms in the world remain manufacturing firms, and many of these firms have their main headquarters in proximity to their major factory complex. This attribute characterizes Detroit, where the auto industry, the local government and the residents remain caught in a crisis. Therefore, it is not surprising that the city went bankrupt in 2013 (Bloomberg, 2013). In terms of CCI, the sector’s most dynamically developing city is Seattle, which is due to the development of retail companies such as Amazon.com, Costco Wholesale, Nordstrom, and Starbucks. Although Seattle’s CCI decreased, it ranked 9th in 2012 as opposed to its 13th position in 2006. The decrease was primarily due to the crash of the financial sector, which was partially offset by the increased performance of the Consumer Discretionary and the Information Technology sector (Microsoft Corporation). In both years, the Industrial sector had the third most companies. In 2006, it ranked third regarding the sectors’ CCI, whereas in 2012 it was outranked by both the Energy and Information Technology sectors. The leading command and control center of the sector is Bridgeport, with its four industrial companies. The city’s CCI was primarily determined by General Electric, headquartered in Fairfield (Connecticut), which was the world’s 10th most valuable company and also the largest in the Industrial sector in terms of all indices. In 2006 New York ranked second after Bridgeport, whereas in 2012 it was outranked by the increasing Chicago because New York’s CCI in this sector decreased significantly. Although Chicago had six industrial companies in the ranking, the increase of its CCI was primarily due to Boeing. In spite of the small increase in its CCI, Washington ranked third, with its position determined by Lockheed Martin, General Dynamics, Northrop Grumman, and SAIC, which mainly produce for the United States Army (Bitzinger, 2009). The Telecommunication Services sector and the Utilities sector showed the largest decrease in CCI in the United States. Although the two sectors are rather different regarding their industrial profile, they are also similar in that none of the cities associated with these sectors has more than two Forbes companies. Moreover, both sectors are characterized by having the smallest cumulative CCI, which is reflected in the fact that in 2012, the cumulative CCI of the 40 companies of the two sectors was less than the CCI of San Francisco. Therefore, neither the Telecommunication Services sector nor the Utilities sector has a major impact on the CCI of the leading cities. The Telecommunication Services sector had a somewhat significant CCI only in Dallas and New York among leading cities, but it is only in the former where it has a more significant impact on the economy. Whereas the world’s second-largest telecommunications company, AT&T, contributes 18% of Dallas’s CCI, New York’s telecommunications companies (Verizon Communications, Virgin Media) contribute only 3% to its CCI. It is in Chicago and New York where the Utilities sector has the highest CCI. However, their contribution is small (5.9% and 1.1%) compared to the CCI of other sectors in the two cities. Regarding its CCI, the Materials sector is also relatively small. The cumulative CCI of the sector has shown a minimal decrease since 2006. However, among the leading cities, this CCI has actually increased. The two biggest command and control centers are Philadelphia and Midland (Michigan), which have the most companies. However, the Materials sector contributes 22% of the former’s CCI and 100% of the latter’s. The Health Care sector has also changed only minimally and came sixth in the ranking of sectors in both years on the basis of its CCI. Among the leading cities, New York’s CCI decreased most radically, but it contributes one third of the sector’s CCI and is the most important center of the Health Care sector both nationally and globally. The CCI of New York in the Health Care sector is by itself higher than the cumulative (Health Care sector) CCI of Minneapolis, Chicago, Indianapolis, and San Francisco, which come after New York in the ranking. In the case of the leading cities, the Health Care sector contributes 14% of New York’s CCI (in contrast to the Financial sector, which contributes 56% of the CCI), with New York alone providing 35% of the Health Care sector’s cumulative CCI. The most significant industrial sector in Minneapolis, which has seven GICS sectors, is the Health Care sector, which contributes 27% of the city’s CCI. The Health Care sector is also the most important sector in Indianapolis, as far as the major cities are concerned, as it provides 75% of the city’s CCI. The Consumer Staples sector has shown the third-largest increase regarding its CCI. Its most important command and control center is New York, which has seven companies in this sector and whose CCI with respect to this sector is primarily determined by PepsiCo and Philip Morris International. Cincinnati comes second, but with only two companies (Kroger and Procter & Gamble) still outranks Chicago, which has six companies. As far as the CCI is concerned, Cincinnati showed a rather small increase, whereas Chicago came second (after New York), due primarily to Kraft Foods and Walgreens. The entry for the sector is Atlanta, which is among the major cities showing the most significant decrease in CCI. However, this decrease was primarily due the Consumer Discretionary sector, the Information Technology sector, and the Telecommunications Services sector and not the Consumer Staples sector. In 2012, after New York and Dallas, it was Los Angeles that had the second-highest number of GICS sectors (9) out of the cities with the highest CCIs. Nevertheless, Los Angeles, which has a very complex industrial profile (Finney, 1998), only ranks 16th in the CCI. This city has shown a decreasing in CCI since 2006. Moreover, it does not have a significant CCI in any of the sectors, either. The CCI of Los Angeles is largely determined by the Consumer Discretionary sector (Directv and Walt Disney), which the leading sector of the city, and the Energy sector (Occidental Petroleum). Their cumulative CCI is 56% of the city’s CCI. One of most important local and global command and control centers within the United States is Chicago. The city’s CCI has increased relatively, although it has lost eight companies since 2006. Table 5 shows that this increase in CCI was due primarily to the Consumer Staples sector and, to a lesser extent, the Industrials, Health Care, and Materials sectors, which managed to compensate for the CCI decrease in the other sectors. Although Chicago topped the Utilities sector in the United States in 2012, the CCI of the city was not highly influenced by this development, as the sector contributed only 5.9% of the city’s overall CCI. In 2012, the increasing Industrial sector (0.9852) had the highest CCI among the sectors of Chicago. This sector outranked the Consumer Staples sector with a similar CCI, which showed the second most dynamic increase after New York within the sector (0.9297). The Industrial sector, which features six major companies, is very complex due to the nature of the industrial classification. However, the CCI of Chicago is determined primarily by Boeing and United Continental Holdings, the world's largest airline, as measured by capacity (CAPA, 2012). Although most leading companies of Chicago operated in the Financial sector, the CCI of this sector lagged behind the Industrial sector and the Consumer Staples sector and has shown a decrease since 2006. This phenomenon is partly because Aon Insurance Company moved to London in 2012 (The Wall Street Journal, 2012), and its financial results no longer affect Chicago. Table 5: The CCI change of the leading cities in the United States by GICS sectors (2006/2012)
Discussion and conclusionIn this paper, I examined the command and control functions of the leading cities of the United States in 2006 and 2012, primarily from a national perspective. The financial crisis, which began in 2007, and the economic recession that ensued, have called our attention to the fact that international trends affecting the industrial sectors of the economy have a major impact on the command and control function of cities. Previous studies (Taylor and Csomós, 2012; Csomós and Derudder, 2013) showed that cities with complex industrial sectors have globally significant command and control functions. Therefore, in this paper, I focused on which industrial sectors determine the position of the command and control centers of the United States and which sectors influence the changing position of cities within the United States. My analysis shows that the command and control centers of the United States may be classified into three groups. The first group includes cities with a complex industrial sector structure. The command and control functions of these cities are determined by several (at least four) sectors, none of which are especially dominant regarding their CCI. This group of cities includes San Francisco, Chicago, Minneapolis, Atlanta, Philadelphia, Los Angeles, Boston, Hartford, Pittsburgh, Denver, St. Louis, and Richmond. The second group includes cities whose profile is determined by several (at least four) industrial sectors, with one of these sectors being dominant, contributing more than 50% of the city’s CCI. This group includes San Jose (Information Technology CCI 93.86%), Washington (Financials CCI 79.46%), Dallas (Energy CCI 62.07%), Houston (Energy CCI 86.05%), Seattle (Information Technology CCI 56.20%), Charlotte (Financials CCI 83.60%), Bridgeport (Industrials CCI 84.65%), and Cincinnati (Consumer Staples CCI 71.54%). New York also belongs to this group and is unique given that it is the only command and control center of the United States that contains all ten GICS sectors. Although New York’s industrial profile is the most complex, its position is primarily determined by the Financial sector, which provides 55.55% of the city’s CCI. Nevertheless, the significance of New York’s command and control function is clear, given that the CCIs of all its sectors occupy one of the first ten positions in the rankings. Moreover, in addition to the Financial sector, both the Consumer Staples sector and the Health Care sector rank first in the United States. (The Financial and Health Care sectors are also ranked first globally.) The third group includes cities with one to three major industrial sectors. Only a few of these cities have an important command and control function by virtue of the fact that they are associated with a globally significant company. Some of the leading cities in this group are the center of the car manufacturing industry, Detroit (Consumer Discretionary CCI 96.49%), the Fayetteville metropolitan area, where Wal-Mart is headquartered (Consumer Discretionary CCI 94.55%), as well as Omaha (Financials CCI 79.37%) and Indianapolis (Health Care CCI 75.65%). In 2012, 21 cities had two sectors, and 52 cities had only one sector. In the case of the latter, it was usually only one company which represented the sector. Although these cities – exclusive of Detroit, the Fayetteville metropolitan area, and Indianapolis – do not have a significant command and control function, they play an important role in various sectors, e.g., Peoria, Illinois (headquarters of Caterpillar Inc.) in the Industrial sector or Midland, Michigan (headquarters of the Dow Chemical Company) in the Material sector. It is clear that certain cities occupy a much better position in a hierarchy that is based on command and control functions and not headquarters or advanced producer services. This phenomenon is best illustrated by San Jose (representing Silicon Valley), which was the second-largest command and control center in 2012 in the United States (it ranked 7th globally). Although the information technology industry began in the mid-20th century in Silicon Valley (Kenney, 2000), the number of companies and their performance began to grow significantly only in the 1990s. In fact, almost half of the 21 IT companies in the hierarchy began their operations after 1990. For instance, Google Inc. (which was the 13th most valuable company in 2012 in the world) was founded in 1998. However, cities whose industry profile is based on a single sector may easily fall prey to negative economic effects (even if the sector is associated with a number of companies). For example, in the Internet sector, many companies have ceased to exist or ended up being acquired due to the dot-com bubble bust in 2001 (Cooper et al., 2005). In addition, the market value of IT companies that were not directly involved in the Internet sector decreased substantially. Godfrey and Zhou (1999: 279) argue that Washington D.C. is a preeminent center of political decision making, although it is not an important headquarters city. Beaverstock et al. (1999) and Alderson and Beckfield (2004) do not lend much importance to this city, whereas in Oner’s (2011) analysis, it ranks fourth in the United States in terms of global network connectivity. In my analysis, I show that Washington was the third-largest command and control center for publically listed companies in the United States in both 2006 and 2012. On the one hand, in contrast to Godfrey and Zhou’s (1999) findings, Washington is one of the most significant headquarters cities of the United States. Its major companies operate in six industry sectors. On the other hand, in spite of the city’s rather strong Industrial sector, Washington’s position is mainly determined by two government-sponsored enterprises (Fannie Mae and Freddie Mac), without which Washington would rank only 17th. This findings means that although Washington’s headquarters function is relatively strong, its command and control function is primarily due to its connection to government. In contrast to Washington, Bentonville — which is located in the Fayetteville-Springdale-Rogers Metropolitan Area — is associated with a single major company, Wal-Mart Stores, which is the largest retailer in the world. Perhaps it is not surprising that in other analyses (see, for instance, Oner, 2011), the Fayetteville metropolitan area is not even mentioned because its role in the global economy is not significant. However, due to the enormous size of the American market (see Courtemanche and Carden, 2011), the command and control function of Walmart is by itself as significant as that of all Forbes 2000 companies in Philadelphia and Los Angeles together. One may of course ask whether the command and control function of a company that mainly operates in the domestic market (albeit one with subsidiaries on all continents) may be treated on a par with the command and control functions of world cities. However, the most important characteristic of command and control functions is that they consider only the financial parameters of headquarters companies and that they disregard global connections and market size. On the basis of the former, the Fayetteville metropolitan area (Bentonville) is a major command and control center in the United States due to Walmart, which employs 2.2 million people. Finally, I have examined how the positions of the major command and control centers of the United States have changed since 2006 and how this development has been determined by the various industrial sectors. The analysis clearly shows that New York is the most important command center of the United States despite the significant decrease in its command and control functions. There is not one city whose position is even close to that of New York. Nevertheless, the Financial sector, which is a dominant sector of New York with its highly complex industrial profile, has suffered serious losses during the economic crisis. In contrast, the leading cities whose industrial profile is determined by only a few thriving sectors are becoming more significant. This phenomenon may best be illustrated by San Jose (Silicon Valley), as it has been turned into one of the world’s most important command and control centers by the Information Technology sector. Likewise, the Energy sector may be credited with the fact that Houston has become a major command city and has also contributed to Dallas’s growth, which is also due to Telecommunication Services. The economic developments of the past few years have evidently had a very positive impact on certain industry sectors (e.g., the Information Technology sector and the Energy sector) while having damaged others, as illustrated by the Financials sector and the Consumer Discretionary sector, which had major companies (e.g., AIG Inc. in New York and General Motors Co. in Detroit) receive an enormous amount of support from the government to fend off the crisis. It is clear that the decreasing or increasing performance of a sector may have a significant impact on the command and control functions of a city, especially when the sector has a dominant role in the city’s industry profile. ACKNOWLEDGEMENTSI thank Ben Derudder for helping me work out the mathematical model of the analysis and I also thank Padraig Carmody for his useful comments.
REFERENCESAbu-Lughod, J.L., 1995. Comparing Chicago, New York, and Los Angeles: testing some world cities hypothesis. In: Knox, P.L. and Taylor, P.J. (Eds.) World cities in a World-system. Cambridge University Press, Cambridge, pp. 171-191. Abu-Lughod, J. L., 1999. New York, Chicago, Los Angeles: American's Global Cities. University of Minnesota Press, Minneapolis. Alderson, A.S. and Beckfield, J., 2004. Power and Position in the World City System. American Journal of Sociology 109, 811-51. Beaverstock, J.V., Taylor, P.J. and Smith, R.G., 1999. A roster of world cities. Cities 16 (6), 445-458. Beaverstock, J.V., Smith, R.G. and Taylor, P.J., 2000. World-City Network: A New Metageography? Annals of the Association of American Geographers 90 (1), 123-134. Bianconi, M., Yoshino, J.A., de Sousa, M.O.M., 2013. BRIC and the U.S. financial crisis: An empirical investigation of stock and bond markets. Emerging Markets Review 14, 76-109. Bitzinger, R.A., 2009. The Modern Defense Industry: Political, Economic, and Technological Issues. ABC-CLIO, Santa Barbara. Bloomberg, 2013. Only Wall Street Wins in Detroit Crisis Reaping $474 Million Fee by Preston, D. and Christoff, C. (http://www.bloomberg.com/news/2013-03-14/only-wall-street-wins-in-detroit-crisis-reaping-474-million-fee.html) Brenner, N., 2002. Decoding the Newest “Metropolitan Regionalism” in the USA: A Critical Overview. Cities, 19 (1), 3-21. CAPA – Centre for Aviation, 2012: United ends 2012 as world's biggest airline, Emirates third. (http://centreforaviation.com/analysis/united-ends-2012-as-worlds-biggest-airline-emirates-third-turkish-and-lion-air-the-biggest-movers-93047) Castells, M., 2010. The Rise of the Network Society: The Information Age: Economy, Society, and Culture. 2nd Edition. Wiley-Blackwell, Oxford. Cohen, R. B., 1981. The new international division of labour, multinational corporations and urban hierarchy. In: Dear, M., Scott. A. (Eds.) Urbanization and Urban Planning in Capitalist Societies. Methuen, London-New York, pp. 287-316. Cooper, M. J., Khorana, A., Osobov, I., Patel, A., Rau, P. R., 2005. Managerial actions in response to a market downturn: valuation effects of name changes in the dot.com decline. Journal of Corporate Finance, 11(1-2), 319-335. Crompton, P., Wu, Y., 2005. Energy consumption in China: past trends and future directions. Energy Economics 27 (1), 195-208. Csomós, G., 2011. Analysis of Leading Cities in Central Europe: Control of Regional Economy. Bulletin of Geography. Socio-Economic Series 16 (1), 21-33. Csomós, G., 2012. GaWC Data Set 26: Global Command and Control Centres, 2006/2009/2012 (http://www.lboro.ac.uk/gawc/datasets/da26.html) Csomós, G. and Derudder, B., 2013. European Cities as Command and Control Centres, 2006-11. European Urban and Regional Studies, doi: 10.1177/0969776412453149 (in press) Courtemanche, C. and Carden, A. (2011) Supersizing supercenters? The impact of Walmart Supercenters on body mass index and obesity. Journal of Urban Economics, 69 (2), 165-181. De Grauwe, P., Ji, Y., 2013. Self-fulfilling crises in the Eurozone: An empirical test. Journal of International Money and Finance, 34, 15-36. Derudder, B., Hoyler, M. and Taylor, P.J., 2011. Goodbye Reykjavik: international banking centres and the global financial crisis. Area 43 (2), 173-182. Finney, M., 1998. The Los Angeles economy. Cities 15 (3), 149-153. Friedmann, J., Wolff, G., 1982. World city formation: an agenda for research and action (urbanization process). International Journal of Urban & Regional Research, 6 (3), 309-344. Friedmann, J., 1986. The World City Hypothesis. Development and Change 17, 69-84. Florida, R. and Jonas, A., 1991. U.S. Urban Policy: The Postwar State and Capitalist Regulation. Antipode, 23 (4), 349-384. Garreau, J., 1991. Edge City. Doubleday, New York. Glickman, N. J., 1987. Cities and the international division of labour. In: Smith, M. P. and Feagin, J. R. (Eds.) The Capitalist City. Blackwell, Oxford, pp. 66-86. Godfrey, B.J., Zhou, Y., 1999. Ranking World Cities: Multinational Corporations and the Global Urban Hierarchy. Urban Geography 20 (3), 268-281. Halbert, L. and Pain, K., 2009. PAR-LON – Doing Business in Knowledge-Based Services in Paris and London: A Tale of One City? GaWC Research Bulletin No. 307. (http://www.lboro.ac.uk/gawc/rb/rb307.html) Hall, P., 1966. The World Cities. Heinemann, London. Harper, R.A., 1987. A functional classification of management centers of the United States. Urban Geography 8 (6), 540-549. Heenan, D.A., 1977. Global cities of tomorrow. Harvard Business Review 55(May/June), 79-92. Hill, R.C. and Fujita, K., 1995. Osaka’s Tokyo problem. International Journal of Urban and Regional Research 19 (2), 181-193. Hoyler, M., Watson A., 2012. Global Media Cities in Transnational Media Networks. Tijdschrift voor economische en sociale geografie 104 (1), 90-108. Hymer, S., 1972. The multinational corporation and the law of uneven development. In: Bhagwati, J. (Ed.) Economics and World Order from the 1970s to the 1990s. Collier-MacMillan, New York, pp 113-140. IMF – International Monetary Fund, 2012. World Economic and Financial Surveys, World Economic Outlook Database, October 2012 Edition. (http://www.imf.org/external/pubs/ft/weo/2012/02/weodata/index.aspx) Jiang, Y., Shen, J., 2010. Measuring the urban competitiveness of Chinese cities in 2000. Cities, 27 (5), 307-314. Kenney, M. (Ed.), 2000. Understanding Silicon Valley: the anatomy of an entrepreneurial region. Stanford University Press, Stanford. Knox, P.L., 1995. World cities in a world-system. In: Knox, P.L. and Taylor P.J. (Eds.) World cities in a world-system. Cambridge University Press, Cambridge, pp. 3-20. Knox, P.L., 1997. Globalization and urban economic change. Annals of the American Academy of Political and Social Science 551, 17-25. Lai, K., 2012a. Differentiated Markets: Shanghai, Beijing and Hong Kong in China’s Financial Centre Network. Urban Studies 49 (6), 1275-1296. Lai, K., 2012b. Shanghai, Beijing and Hong Kong within a financial centre network. In: Derudder, B., Hoyler, M., Taylor, P.J. and Witlox, F. (Eds.) International Handbook of Globalization and World Cities. Edward Elgar Publishing, Cheltenham, pp. 429-436. Lee, E.K.S., Zhao, S.X., Xie, Y., 2012. Command and Control Cities in Global Space-economy Before and after 2008 Geo-economic Transition. Chinese Geographical Science, 22(3), 334-342 Lin, G.S.C., 2004. The Chinese globalizing cities: National centres of globalization and urban transformation. Progress in Planning 61 (3), 143–157. Liu, X. and Derudder, B., 2012. Analyzing urban networks through the lens of corporate networks: A critical review. Cities, doi: 10.1016/j.cities.2012.07.009 (in press) Lyons, D. and Salmon, S., 1995. World cities, multinational corporations, and urban hierarchy: the case of the United States. In: Knox, P.L., Taylor, P.J. (Eds.) World cities in a World-system. Cambridge University Press, Cambridge, pp. 98-114. Mahutga, M.C., Ma, X., Smith, D. and Timberlake, M., 2010. Economic Globalization and the Structure of the World-City System: The Case of Airline Passenger Data. Urban Studies 47 (9), 1925-1947. Nijman, J., 2012. Mumbai as a global city: theoretical essay. In: Derudder, B., Hoyler, M., Taylor, P.J. and Witlox, F. (Eds.) International Handbook of Globalization and World Cities. Edward Elgar Publishing, Cheltenham, pp. 447-454. Noyelle, T.J. and Stanback, T.M. 1984. The Economic Transformation of American Cities. Rowman and Allanheld, Totowa, NJ. Olds, K. and Yeung, H.W.-C., 2004. Pathways to global city formation: A view from the developmental city-state of Singapore. Review of International Political Economy (11) 3, 489-521. Oner, A. C. (2011) US Cities. In: Taylor, P. J., Ni, P., Derudder, B., Hoyler, M., Huang, J. and Witlox, F. (Eds.) Global Urban Analysis: A Survey of Cities in Globalization. Earthscan, London, pp. 256-266. Panagariya, A., 2008. India: The Emerging Giant. Oxford University Press, Oxford. Poon, J.P.H., Thompson E.R., 2001. Effects of the Asian financial crisis on transnational capital. Geoforum 32 (1), 121-131. Rimmer, P.J., 1986. Japan's World Cities: Tokyo, Osaka, Nagoya or Tokaido Megalopolis? Development and Change 17 (1), 121-157. Ross, B. H., Levine, M. A., 2012. Urban Politics: Cities and Suburbs in a Global Age. M.E. Sharp, New York. Sassen, S., 1991. The Global City. Princeton University Press, Princeton. Sassen, S., 1995. On concentration and centrality in the global city. In: Knox, P.L. and Taylor P.J. (Eds.) World cities in a world-system. Cambridge University Press, Cambridge, pp. 63-78. Sassen, S., 2006. Cities in a world economy. 3rd Edition. Pine Forge Press, Thousand Oaks. Sim, L.L., Ong, S.E., Agarwal, A., Parsa, A. and Keivani, R., 2003. Singapore’s competitiveness as a global city: development strategy institutions and business environment. Cities 20 (2), 115-127. Smith D.A. and Timberlake M., 2001. World city networks and hierarchies, 1977-1997: An empirical analysis of global air travel links. American Behavioral Scientist 44 (10), 1656-1678. The Wall Street Journal, 2012. Aon Shifts Headquarters to London (http://online.wsj.com/article/SB10001424052970204542404577158633936346056.html) Taylor, P. J., Catalano, G. and Walker D. R. F., 2002. Exploratory Analysis of the World City Network. Urban Studies 39 (13), 2377-2394. Taylor, P. J., 2004. World City Network: A Global Urban Analysis. Routledge, London-New York, 1997. Taylor, P. J., Ni, P., Derudder, B., Hoyler, M., Huang, J., Lu, F., Pain, K., Witlox, F., Yang, X., Bassens, D., Shen, W., 2009. The way we were: command-and-control centres in the global space-economy on the eve of the 2008 geo-economic transition. Environment and Planning A 41 (1), 7-12. Taylor, P. J., Ni, P., Derudder, B., Hoyler, M., Huang, J. and Witlox, F. (Eds.), 2011. Global Urban Analysis: A Survey of Cities in Globalization. Earthscan, London. Taylor, P. J., 2011. Advanced Producer Service Centres in the World Economy. In: Taylor, P. J., Ni, P., Derudder, B., Hoyler, M., Huang, J. and Witlox, F. (Eds.) Global Urban Analysis: A Survey of Cities in Globalization. Earthscan, London, pp. 22-39. Taylor, P. J. and Csomós G., 2012. Cities as Control and Command Centres: Analysis and Interpretation. Cities 29 (6), 408-411. Taylor, P. J., Hoyler, M. and Sánchez-Moral, S., 2012. European Cities in Globalization: A Comparative Analysis based on the Location Strategies of Advanced Producer Services. GaWC Research Bulletin No. 416. (http://www.lboro.ac.uk/gawc/rb/rb416.html) Walker, R.A., 2006. The boom and the bombshell: The new economy bubble and the San Francisco Bay area. In: Vertova, G. (Ed.) The Changing Economic Geography of Globalization: Reinventing Space. Routledge, New York, pp. 121-147. Wu, F., Ma, L.J.C., 2006. Transforming China's globalizing cities. Habitat International 30 (2), 191-198 Wang, Y., Teter, J., Sperling, D., 2011. China’s soaring vehicle population: Even greater than forecasted? Energy Policy 39 (6), 3296-3306. Weiss, N. E., 2013. Fannie Mae’s and Freddie Mac’s Financial Status: Frequently Asked Questions. CRS Report for Congress, Congressional Research Service, R42760. Yulong, S., Hamnett, C., 2002. The potential and prospect for global cities in China: in the context of the world system. Geoforum 33 (1), 121-135. Zhao, S.X.B., Zhang, L., Wang, D.T. (2004) Determining factors of the development of a national financial center: the case of China. Geoforum 35(5), 577-592. NOTES* György Csomós, Faculty of Engineering, University of Debrecen, Hungary, email: csomos@eng.unideb.hu
Note: This Research Bulletin has been published in Geoforum, 50, (2013), 241-251 |
|||||||||||||||||||||||||||||||||||||||||||||||||||||||||||||||||||||||||||||||||||||||||||||||||||||||||||||||||||||||||||||||||||||||||||||||||||||||||||||||||||||||||||||||||||||||||||||||||||||||||||||||||||||||||||||||||||||||||||||||||||||||||||||||||||||||||||||||||||||||||||||||||||||||||||||||||||||||||||||||||||||||||||||||||||||||||||||||||||||||||||||||||||||||||||||||||||||||||||||||||||||||||||||||||||||||||||||||||||||||||||||||||||||||||||||||||||||||||||||||||||||||||||||||||||||||||||||||||||||||||||||||||||||||||||||||||||||||||||||||||||||||||||||||||||||||||||||||||||||||||||||||||||||||||||||||||||||||||||||||||||||||||||||||||||||||||||||||||||||||||||||||||||||||||||||||||||||||||||||||||||||||||||||||||||||||||||||||||||||||||||||||||||||||||||||||||||||||||||||||||||||||||||||||||||||||||||||||||||||||||||||||||||||||||||||||||||||||||||||||||||||||||||||||||||||||||||||||||||||||||||||||||||||||||||||||||||||||||||||||||||||||||||||||||||||||||||||||||||||||