GaWC Research Bulletin 424 |
|
|
|
This Research Bulletin is forthcoming in Regional Studies
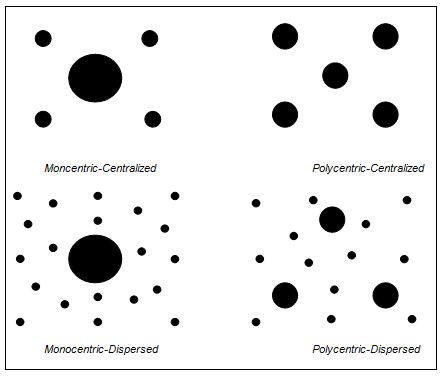
INTRODUCTIONContemporary urban studies put emphasis on the significance of networked structures in explaining the economic, social and cultural functioning and performance of cities and regions. In this, it is recognized that no city is an island, but part of a functionally interdependent system of cities. While there has been an emphasis on studying the external, global linkages of world cities (e.g., ALDERSON and BECKFIELD, 2004; TAYLOR, 2004; WALL and VAN DER KNAAP, 2011), many social-economic processes such as commuting and shopping are still local (BURGER et al., 2013). Hence, there is an increasing need for studying interdependencies between centres at lower spatial scales. This is fuelled by a broadly underpinned rise of a new regional form, in which cities are part and parcel of a larger urban region which comprises more than a central city and its direct hinterland. Such regional spatial structure can be characterized by multiple, interacting concentrations of jobs and people, with a spatial division of functions between them (VAN OORT et al., 2010). Many concepts for these new regional types circulate; an important common denominator being their more polycentric and more dispersed spatial structure (SCOTT, 2000; KLOOSTERMAN and MUSTERD, 2001; TAYLOR and LANG, 2004; MEIJERS, 2005; HALL and PAIN, 2006; HOYLER et al., 2008; LAMBREGTS, 2009; BURGER and MEIJERS, 2012). Polycentricity is here understood as a balanced distribution with respect to the size of cities or centres in a region, where several cities are located within close proximity of each other. The more the largest centres in a region are equally sized in terms of population or employment, the more polycentric the region is (MEIJERS, 2008a)1. The concept of polycentricity should not be confused with the concept of multicentricity. Multicentricity refers to the existence of multiple centres, while polycentricity refers to the lack of an urban hierarchy (BURGER and MEIJERS, 2012). Dispersion refers to the situation in which the population is sprawled across a region in a non-concentrated pattern. It is not necessarily similar to urban sprawl, as this is often equated with low-density residential development, whereas dispersion concerns the issue of whether this development is taking place in centres or not, leaving aside the question of density. Accordingly, dispersion refers to the absence of urbanization. Both polycentricity and dispersion inevitably draw attention to the interdependencies between the different parts of a region. Despite awareness of the importance of these interdependencies for regional competitiveness and cohesion (MEIJERS, 2005; HOYLER et al., 2008), these intra-regional and inter-city relationships constitute a so-far little developed field of research. Although attention has been paid to the regional spatial structure of commuting (see e.g., AGUILERA and MIGNOT, 2004; NIELSEN and HOGVESEN, 2005; VAN NUFFEL and SAEY, 2005; GREEN, 2008), other types of economic interaction (most notably, consumer- and producer-oriented trade) within urban systems have received limited attention2. Calls for further empirical research into the effects of regional spatial structure on the performance of regions are widespread (see e.g. KLOOSTERMAN and MUSTERD, 2001; PARR, 2004; TUROK and BAILEY, 2004; CHESHIRE, 2006; DAVOUDI, 2007; MEIJERS, 2008b; HOYLER et al., 2008; LAMBREGTS, 2009). This paper sheds some light on how the spatial organization of regions affects their performance. More explicitly, we base our judgement of performance of a region on the presence of (specialized) retail amenities. Retail amenities are known to be strongly dependent on the size of local population (BERRY and PARR, 1988). The presence of a large quantity of specialized retail outlets is strongly associated with the size of a city, and as such, a manifestation of the presence of urbanization economies through consumption (GLAESER et al., 2001). Our point of departure is the renewed interest in the relationship between regional spatial structure and regional performance. MEIJERS (2008b) found for Dutch regions that a more polycentric settlement pattern is related to the presence of fewer cultural, leisure and sports amenities. MEIJERS and BURGER (2010) obtained for US metropolitan areas with a more polycentric settlement pattern that the positive influence of metropolitan size on labour productivity diminishes. Although urbanization economies are not necessarily confined to a single urban core anymore, but increasingly shared among a group of functionally linked settlements (CAPELLO, 2000; PHELPS and OZAWA, 2003), travel, commodity and knowledge flows do not circulate as easily as in a single larger city (PARR, 2004). Hence, polycentric regions ‘lack the critical mass of large cities with agglomeration economies’ (LAMBOOY, 1998: 459). The aim of this paper is not just to test whether these findings also hold for the presence of retail amenities in Dutch regions, but innovates in that we also explore ways to overcome these negative effects of polycentricity and dispersion on the presence of urbanization economies. We analyse two strategies that may lead to a stronger presence of specialized retail in more polycentric and more dispersed regions. These include: A) overcoming the barriers of distance by improving accessibility between cities and B) concentrating top retail functions in one city. Exploring these factors also contributes to the empirical justification of two typical regional planning and development policies for regional urban systems. The first concerns the policy idea that improving connections between the cities may overcome the barriers to economic exchange. The second relates to the debate whether strategies should aim for concentration of specialized urban functions or for a spread of these functions over the constituent cities in a complementary way (EVERS, 2002). The Dutch retail structure is characterized by a high density of shops. Most of these are concentrated in city and town centres, but even rural areas have good shop accessibility in comparison to countries such as Germany, Canada, or the United States (EVERS 2008). This situation is reflected in the transport modes used for shopping: in 1990, for example, the share of walking and cycling in the total distance travelled was 12% in the Netherlands, as compared to 4% for Western Europe as a whole (SCHWANEN et. al. 2004). Remarkably, these non-motorized transport modes accounted for over half of all shopping trips in the Netherlands, which is unparalleled in Western Europe. Another oddity is the fact that, despite a population of over 16 million, there is no American-style out-of-town shopping mall and very few French-style hypermarkets in the country. This suggests the relative importance of spatial structure alongside that of institutional (planning) strategies in order to better understand how both factors jointly influence retail amenities in regions. This paper focuses on the impact of spatial structure, and leaves the impact of institutional comparative differences for later research. The remainder of this paper is organized as follows. The next section provides a discussion of the literature on agglomeration, regional spatial structure and retail amenities, which culminates in a set of propositions that will be investigated. Section 3 provides more background on our case study of retail geography in the Netherlands. Section 4 presents the data and research approach, including a quantification of regional spatial structure. Empirical results are presented in section 5. We conclude with a discussion of our findings in section 6. AGGLOMERATION, REGIONAL SPATIAL STRUCTURE AND RETAIL AMENITIESAgglomeration Economies and ConsumptionIn economic geography and urban economics, it is now widely accepted that the urban environment adds to the productivity of firms (ROSENTHAL AND STRANGE, 2004; PUGA, 2010). Productivity of firms located in large cities is thought to be higher because of larger input markets, larger labour pools, and the presence of a better infrastructure and public facilities. Large cities allow for better matching between employers, employees and business partners and are also more likely to be home to universities, R&D facilities, and other knowledge-generating institutions (VAN OORT, 2004). In addition, the often diverse industry mix in large cities stimulates the generation, replication, modification and recombination of ideas and applications across different industries and protects a city from a volatile demand (FRENKEN et al., 2007). A recent meta-analysis of the empirical literature on agglomeration economies indicates that doubling of city size increases productivity by on average 5.8% percent (MELO et al., 2009). However, the relationship between city size and productivity typically depends on the area, sector and time period under observation (see also ROSENTHAL AND STRANGE, 2004). In this respect, optimal city size tends to vary according to the functions and sector of the cities in question (RICHARDSON, 1972). Cities do not only facilitate production, but also provide a good environment for consumption. As indicated by TABUCHI and YOSHIDA (2000), nominal wages increase by city size, but the costs of living (e.g., housing costs) increase even more. Hence, citizens seem to be willing to give up real wage in order to take pleasure in consumption amenities. According to GLAESER et al. (2001), one can here think of the aesthetic properties of large cities and the provision of some public services in large cities (e.g., specialized schools) that are not available elsewhere, as well as the presence of more specialized goods and services in large cities (e.g., theatres and specialized stores). In large cities hospitals, restaurants, stadiums, theatres, zoos and higher-order retail functions such as clothing stores, furniture stores, and specialized food stores are found, while consumers in small towns lack these amenities. In addition, a city offers speed of interaction facilitated by urban density, reducing transport costs and travel times. The ‘average’ consumer saves costs when shops are concentrated3, including time savings and other sorts of cost savings such as having to pay for parking or public transportation only once. A similar train of thought is found in urban economic and new economic geography models, where the firms’ proximity to consumers in combination with the consumer benefits of the greater variety of goods and services offered in large cities induces spatial agglomeration (Fujita, 1988). Consumption possibilities as source of agglomeration are reflected in higher growth of high-amenity cities compared to low-amenity cities (GLAESER et al., 2001; CLARK et al., 2002; MARKUSEN and SCHROCK, 2009) as well as the recent increase in exchange commuting in many Western societies, i.e. people living in the more expensive central cities and working in the suburbs (VAN DER LAAN, 1998; BURGER et al., 2011). Central Places, Regions and Retail AmenitiesOther demand-side explanations of agglomeration, which focus on the match between specific demands and suppliers, can be found in the central place and urban systems literature of the second half of the 20th century, which build on the work of CHRISTALLER (1933) and LÖSCH (1944). Although this literature has been on the wane the last two decades (COFFEY et al., 1998), it has still relevance for understanding the relationship between city size and consumption benefits. As indicated by Berry and Parr (1988), central place theory is occupied with the study of the distribution, size and functions of cities and towns and originally focused on city-hinterland relationships and consumer-oriented trade. Assuming that consumers use the nearest centre to acquire goods and services (minimization of transportation costs), and that goods and services of a given level can be found in the same centre, central place theory predicts a hierarchy of centres, where the size of a centre and the variety of goods and services it provides are thought to be perfectly correlated (BERRY and GARRISON, 1958; DAVIES, 1967). In this, it is conjectured that each good and service has a minimum demand threshold to support suppliers as well as a fixed geographical domain beyond which consumers are unwilling to travel (BERRY and GARRISON, 1958). For specialized goods and services the demand threshold and spatial range is generally larger. Central place theory predicts that all urban systems are rather monocentric, containing one large principal centre and several smaller subordinate centres that are part of the principal centre’s market area resulting in a clear urban hierarchy (HAGGETT, 1965). In this, subordinate centres are dependent on the principal centre for the provision of specialized goods and services for which they do not meet the minimum demand threshold4. Only a small proportion of the centres will be self-contained in that they offer the full range of goods and services. At the same time, the provision of specialized goods and services in the principal centre is often facilitated by its control over the wider region as a trade area for these specialized goods and services. In other words, through functional linkages with higher-order centres, subordinate centres can help providing the minimum demand threshold for supporting some retail functions (WENSLEY and STABLER, 1998). Extensions of the central place model, which relax some of its underlying assumptions and provide a more sophisticated treatment of consumer behaviour, provide additional explanations of retail agglomeration. Although one of the underlying themes of original central place theory is that competitors try to avoid each other, PARR and DENIKE (1970) and EATON and LIPSEY (1979) showed that the agglomeration of similar stores can be explained by the tendencies of consumers to compare products and prices on sale in a variety of stores. Likewise, the agglomeration of stores selling different goods and services can be explained by savings on travel, search, and transaction costs associated with multi-purpose shopping (EATON and LIPSEY, 1982; GHOSH, 1986). Obviously, the benefits of co-location of retailers for consumers – who avoid smaller centres – imply that agglomeration is to their advantage as well. Anticipating on consumer behaviour, a store that shares its location with other competing and complementary stores is more likely to attract customers than an otherwise identical store located on its own. Accordingly, agglomeration of stores creates advantages for both consumers and retailers (MULLIGAN, 1984). In this, it can be expected that some store types profit more from clustering than other store types. First, comparison shopping is more common for infrequently purchased, heterogeneous and expensive goods. One can think here of personal goods such as clothing and jewellery and household goods such as furniture and cars, where there can be considerable quality and price variations between the different products. Customers of stores selling convenience goods (supermarkets, bakeries, butchers) do not often engage in search as quality and price variations are often too small compared to the associated search costs (WEST et al., 1985). Second, although multipurpose shopping is both found for convenience and comparison goods, it can be argued that multipurpose shopping is most beneficial for specialized stores that sell infrequently purchased goods and require a larger customer base. This is reflected in that multipurpose trips are more common for non-grocery shopping (O’KELLY, 1981), consumers are willing to travel longer distances for infrequently bought goods (JONES and SIMMONS, 1990) and in particular smaller, specialized retailers profit from additional traffic that is generated by larger anchor retailers in a centre such as supermarkets and department stores that offer a wide variety of products (INGENE and GHOSH, 1990; YEATES et al., 2001). Third, stores drawing on both multipurpose and comparison shopping will profit more from clustering than stores drawing only on multipurpose shopping. Some even argue that multipurpose shopping by itself generally leads to a dispersion of similar, competing retail establishments (MCLAFFERTY and GHOSH, 1986), while stores relying on single-purpose comparison shopping do not need to be located in proximity of stores selling different goods or services (WEST et al., 1985). Regional Spatial Structure and Market FragmentationTwo important dimensions of a regional spatial structure stand central in this paper – polycentricity and dispersion. A polycentric spatial structure refers to the situation in which the cities in a region are relatively equal in size. A dispersed spatial structure refers to the situation in which a large part of the population is not living in cities but spread out across the territory in a non-concentrated pattern (see Figure 1). Although polycentric and dispersed spatial structures have always been existent, the process of decentralization and dispersion has accelerated the past decades and functional linkages are formed at increasingly higher levels of scale than those of the ‘traditional’ city. The reader is referred to SCOTT, 2001, CHAMPION, (2001), HALL and PAIN (2006), LAMBREGTS (2009), and DE GOEI et al. (2010) amongst others for discussions of the drivers of these changes. Figure 1: Dimensions of Regional Spatial Structure
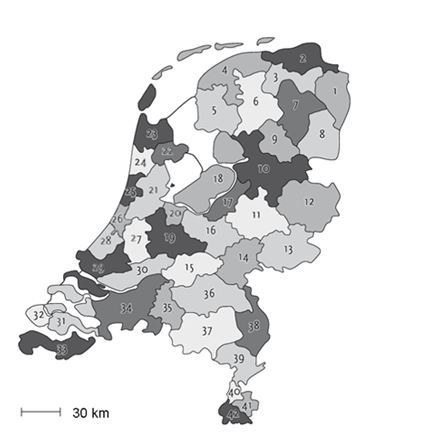
As was indicated in the previous subsections, present day retailing is based on agglomeration and the potential for multipurpose and comparison shopping. Accordingly, the different spatial structures in Figure 1 vary in the extent to which they support retail. Theoretically, it can be argued that a monocentric and centralized spatial structure is more efficient for retailing than is a polycentric and dispersed spatial structure. Empirically, it remains unclear how regional spatial structure has an effect on the retail amenities present in a region (HENDERSON et al, 2000). On the one hand, it can be expected that retail establishments are more frequently found in more polycentric and dispersed regions. WENSLEY and STABLER (1998) indicate that due to higher transportation costs in sparse populated areas, demand thresholds in these areas are generally lower in that less population is required to support a retail function. In turn, less spatial competition between retail establishments in sparse populated areas increases the number of retail establishments (MUSHINSKI and WEILER, 2002; THILMANY et al., 2005). Accordingly, it can be expected that the frequency of retail establishments in sparse populated areas is higher and it can be expected that an isolated place of 25.000 inhabitants is home to more retail establishments per inhabitant than a metropolitan-proximate place of the same size. At the regional level, this would mean that polycentric and dispersed regions are characterized by a higher frequency of retail establishments, holding everything else constant. However, physical and socio-cultural barriers to the movement of consumers in more polycentric and rural regions also result in the relative absence of urbanization economies in more polycentric and dispersed regions (BUCKWALTER, 1990; HENDERSON et al., 2000; TUROK and BAILEY, 2004; MEIJERS and BURGER, 2010). Although agglomeration-inducing spatial competition may hamper the multiplication of retail establishments, threshold demand levels in more polycentric and dispersed regions for some specialized goods and services may sometimes not be met, despite the fact that at the regional level the minimum demand threshold to support these functions would be adequate (BUCKWALTER, 1990). Indeed, although it is often argued that geographical processes are widening and urbanization economies are not confined to a single place, but shared among a group of functionally linked settlements – taking the form of urban network externalities (cf. CAPELLO, 2000) – the geographical scope of shopping is still very local and travel flows in a polycentric region do not circulate as easily as in a monocentric city. Accordingly, polycentric regions lack the demand externalities associated with large cities. This ‘lack of critical mass’ in polycentric and dispersed regions is reinforced by existing political structures and lack of coordination in planning retail functions. A related point is made by HENDERSON et al. (2000), who argue that especially those goods and services that profit from urbanization economies do not need the demand advantages originating from competitive protection of spatial isolation to survive. One can think here especially of specialized goods and services that draw to a large extent on multipurpose and comparison shoppers, and are therefore more often found in densely populated areas. Propositions to be InvestigatedOn the basis of the discussion above, five propositions on the relationship between regional spatial structure and the presence of retail amenities can be derived. Proposition 1: The more polycentric or dispersed a region, the less retail amenities are present.Although stores in polycentric and dispersed regions face less spatial competition, at the same time stores profit less from urbanization economies as travelling time limits interaction possibilities in comparison to the denser monocentric and centralized regions, undermining the support for specialized retailing which often requires a large demand threshold. Overall, we expect a negative effect of polycentricity and dispersion on the presence of retail amenities. Proposition 2: The more polycentric or dispersed a region, the less specialized retail amenities are present.While the first proposition considers the quantity of retail present in regions, this second proposition is about the qualitative dimension of the retail, more precisely, the extent to which specialized retail is present. It can be expected that individual branches of stores are to varying degrees affected by the regional spatial structure, as the demand thresholds for some goods and services are larger than for others. A polycentric and dispersed regional spatial structure would have especially a negative influence on those specialized goods and services that require greater demand in order to achieve minimum efficient scale as well as those goods and services drawing on comparison shoppers. Accordingly, a region consisting of four nearby towns of 25.000 inhabitants each will probably accommodate less specialized retail establishments per inhabitant compared to a region consisting of one city of 100.000 inhabitants. Proposition 3: A polycentric or dispersed region in which the main cities are located more closely hosts more, and more specialized, retail amenities.Distance is the barrier to overcome if both polycentric and dispersed regions want to exploit their critical mass, and it is therefore of interest to explore whether the spacing of cities with retail matters in determining a region’s retail amenities. As indicated by MEIJERS and SANDBERG (2008), polycentric and dispersed regions in which the different cities are located in close proximity of each function more like a monocentric region than polycentric and dispersed regions in which the spacing between the different cities is large. Exploring this proposition will shed light on the question whether improving infrastructure linkages (accessibility) between the cities and towns of a polycentric or dispersed region is of help in organizing agglomeration advantages at the level of the joint size of the constituent places. Proposition 4: A polycentric or dispersed region in which (specialised) retail is relatively concentrated in once centre, hosts more, and more specialised, retail amenities.In this paper, we base our judgment of a region’s extent of polycentricity and dispersion on the spread of population. Even though there is a strong relation between city size and retail present, this may not necessarily mean that retail amenities follow an equally polycentric or dispersed pattern. Here, we explore whether a more concentrated distribution of specialised retail in polycentric and dispersed regions implies the presence of more retail amenities. Proposition 5: A polycentric or dispersed region with a relative net outflow of consumers, hosts less and less specialised retail amenities.Analyses relating to the previous propositions evaluate the effect of regional spatial structure on the number of stores in a region. In this, we have treated regions as spatially fixed. However, regions are not spatial entities that operate on their own and certainly in the present day economy, most regions interact at least to some extent. In this, it can be expected that polycentric and dispersed regions which are relatively isolated host more and more specialised retail amenities as these regions face less spatial competition from neighbouring regions, which would result in lower demand thresholds for retailing functions. DUTCH RETAIL STRUCTUREThe benefits of co-location of retail do not necessarily imply that shops are located centrally, as in many countries they have decentralized to out of town locations, albeit still generally being co-located with other shops, for instance in malls. Reasons for this centrifugal process are the costs involved in a central location, such as high rents, lack of space and, for consumers, and higher parking costs. These new shopping locations are increasingly less connected to pockets of employment (LANG, 2003) which limits the possibilities for trip chaining. This centrifugal process of retail, however, has not appeared to a large extent in our case study regions in the Netherlands. This brings us to the role of institutions in shaping the micro-level location behaviour of retailers, and consequently consumers. Several authors have provided good syntheses of Dutch retail planning (BORCHERT, 1998; WELTEVREDEN et al., 2005) that show how restrictive planning policies have had a strong mark on Dutch retail geography in that they have long not allowed for decentralization of shopping towards the urban fringe in order to protect the inner cities (EVERS, 2002). It makes Dutch retail geography stand out from most other countries, such as for instance the United States, Spain and France, where shopping has most often decentralized to greenfield locations way beyond the city centre (GARREAU, 1991). In contrast, the inner cities of Dutch cities still top the retail hierarchy (BORCHERT, 1998), even though competition from peripheral shopping locations – resulting from slightly lessened planning control for some space-extensive retail segments in response to retail dynamics (EVERS, 2002) - and, increasingly, e-retailing or e-commerce has been rising (WELTEVREDEN et al., 2005). However, except for the clustering of stores specialized in garden supplies, cars, furniture and building materials, out-of-town hypermarkets or shopping malls as found in many other European countries are relatively uncommon in the Netherlands. This pays off in terms of the large share of sustainable transport modes as cycling or walking for shopping trips (DIELEMAN et al., 2002) and greater attractiveness of city centres and increased possibilities for multipurpose shopping. The decentralization of some segments of retail has often been more than compensated for by the growth or emergence of other sectors in the inner city. WELTEVREDEN et al. (2005:831) describe the outcome of this sorting process for the traditional inner city shopping area as a ‘transformation from daily and heavy, space consuming goods to non-daily, recreational goods’. Part of the explanation for inner cities topping the retail hierarchy is also that the limited number of retail developers have strong and vested interests in inner city retail real estate and that space in the Netherlands, one of the most densely populated countries in the world, is limited (EVERS, 2002). This means that the spatial structure of a region might influence retail geography mainly through the degree of agglomeration. RESEARCH APPROACHRetail Amenities and Store Types in Dutch WGR-RegionsTo examine the relationship between spatial structure and urban and regional retail amenities, we focus on retailing in 42 Dutch WGR regions (see Figure 2), which together cover the entire Netherlands. The delimitation of WGR-regions is based on administrators' and councillors’ perceptions of the scale on which issues need to be regionally coordinated. In practice, such issues often include economic development, tourism, recreation, housing, employment, traffic and transport, spatial development, nature and environmental affairs, welfare and social affairs. Accordingly, these regions constitute an indirect proxy of functionally coherent regions and coincide fairly well with what are believed to be travel-to-work areas. In order to examine retail structure, data on establishments and employment in retail were obtained from the LISA (Landelijk Informatie Systeem Arbeidsplaatsen – National Information System of Employment) database, an employment register that covers all establishments in the Netherlands for the period 2000-2008 (see VAN OORT, 2004). For each retail establishment, we were able to retrieve detailed information about the number of employees, economic activity and geographic position. On the basis of the NACE sector classification and information of the Central Industry Board for the Retail Trade (HBD) in the Netherlands, we distinguish between 51 different types of retailing functions. Figure 2: WGR Regions in the Netherlands
To assess how specialized these retailing functions are, we focus on two dimensions: urbanism and consumer orientation. First, retailing functions can be classified on the basis of their ‘urbanism’ or the extent to which they profit from being located in a densely populated environment. In this, the finding that some store types are overrepresented in large cities (measured by means of a location quotient) indicates that they profit from being located in a densely populated environment. Second, we use the consumer orientation of stores as outlined by West and colleagues (WEST et al., 1985; WEST, 1992; GOLOSINSKI and WEST, 1995). These scholars distinguish between the following store categories on the basis of the extent to which these types benefit from multipurpose and comparison shopping5:
Yet some M stores, such as book and music stores, require a larger customer base in that these types of goods are more infrequently sold.
Table 1: Store Type by Degree of Urbanism and West Classification
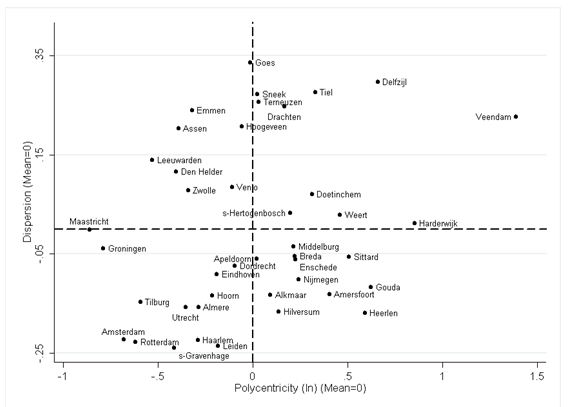
Table 1 indicates the extent to which stores profit from a densely populated environment (“urban loving”, “urban neutral”, “urban avoiding”) based on location quotients, as well as the extent to which they profit from multipurpose and comparison shopping based on the classifications by West and colleagues (WEST et al., 1985; WEST, 1992; GOLOSINSKI and WEST, 1995). So, “urban loving” stores are store types that are strongly overrepresented in large cities. On the contrary, “urban avoiding” stores are store types that are underrepresented in larger places. From Table 1 it can be obtained that in particular the MC stores (for instance clothing, luggage and leather goods, telecommunication, and jewellery) and more specialized M stores (for instance foreign food, tobacco, book and music stores, and perfumery) are relatively more frequently present in large cities. Not surprisingly, C stores (for instance do-it-yourself and garden supplies), which often require large floor spaces, are underrepresented in large cities. Although there are some specialized M store types that are not overrepresented in large cities (especially those selling frequently bought convenience goods) there are hardly any combination M stores (supermarkets, department stores, drug stores) strongly overrepresented in large cities (see also Appendix A). Provided that the store types more frequently found in large cities are more dependent on urbanization economies, it can be expected that these store types are less frequently found in polycentric and dispersed regions. Quantifying Regional Spatial StructureBuilding on the work of ANAS et al. (1998), we distinguish between two morphological aspects of the spatial organization of regions (recall Figure 1). First, the monocentricity-polycentricity dimension reflects the degree to which the urban population is concentrated in one city or spread over multiple cities in the region. Second, the centralization-dispersion dimension reflects the degree to which the regional population is centralized in cities or dispersed over smaller non-urban places in the area in a non-centralized pattern. The degree of polycentricity is related to the balance in the size distribution of these cities in regions. The more equally sized the largest cities in a region are, the more polycentric a region is (KLOOSTERMAN and LAMBREGTS, 2001; PARR, 2004; MEIJERS, 2005). The rank-size distribution of the regional urban system provides information on this hierarchy and is therefore a useful indication of the extent of mono- or polycentricity (PARR, 2004). Following MEIJERS (2008) and BURGER and MEIJERS (2011) and using information on the population size of the incorporated places, we calculated the slope of the regression line of the rank-size distribution of incorporated places in each Dutch WGR region for different number of places per WGR region (2, 3 and 4 largest incorporated places)6. Subsequently, the average of these three scores was used to assess the degree of monocentricity-polycentricity in a region. Given that these slopes were normally distributed, it can be argued that most regions cannot be considered completely monocentric or polycentric, but are somewhere in between these two extremes; only the most polycentric WGR regions can be considered polycentric regions proper. A more detailed description of the construction of the polycentricity measure can be found in Appendix B. The degree of dispersion is related to the share of the regional population not living in urban centres. In this, the degree of centralization-dispersion in a region is estimated as the share of the population living in non-urban places, which are, following the classification of Statistics Netherlands (CBS), defined as places with less than 500 addresses per km2. Accordingly, we look at the share of the region’s population that is not located in urban centres. Figure 3 indicates the presence of polycentric and dispersed patterns for the different Dutch WGR regions. The demarcation lines represent the average degree of polycentricity and dispersion respectively. Regions such as Amsterdam and Rotterdam score low on both the degree of polycentricity and dispersion and can therefore be characterised as monocentric-centralized regions. On the contrary, polycentric and dispersed regions such as Veendam and Delfzijl score high on both dimensions. All possible combinations (polycentric-dispersed; polycentric-centralized; monocentric-dispersed; monocentric-centralized) are present. Figure 3: Regional Spatial Structure in the Netherlands
Estimation StrategySince our dependent variable – the number of stores – is a count, we examine the relationship between regional spatial structure and retail amenities using negative binomial regression models. A more detailed discussion of these issues is provided by GREENE (1994), LONG (1997) and BURGER et al. (2009)7. Besides our indicators for regional spatial structure and in line with previous research on retail structure (e.g., HARRIS and SHONKWILER, 1993; SHONKWILER and HARRIS, 1996; HENDERSON et al., 2000; MUSHINSKI and WEILER, 2002; THILMANY et al., 2005), control variables such as regional population size, average household income, age and household demographics, and the number of hotels as indicator of tourism are included in the model. These control variables are important to include in the model because they are all related to the demand for retail and can affect the relationship between spatial structure and retail amenities. Although the degree of dispersion and number of stores can be negatively correlated, in reality, the degree of dispersion and number of stores may only be correlated with each other because they are both correlated with a third factor, e.g. average household income. More rural areas tend to be poorer and therefore can be characterized by less retail amenities, and accordingly, the observed correlation between dispersion and retail amenities may be attributed to average household income instead of the degree of dispersion. Hence, these control variables reduce the likelihood that the observed relationships between our regional spatial structure variables and our dependent variable are spurious. As the regional presence of retail amenities is best represented by the number of stores per inhabitant, we constrain the parameter of population size to be equal to 18. An overview of the variables included in our regression models is provided in Table 2. Table 2: Descriptive Statistics of Control Variables (N=378, all measured by region-year (2000-2008))
To assess proposition 3, 4 and 5, we calculated the spacing between the cities in a region, specialized retail concentration and the net outflow of consumers for each Dutch WGR region (i.e. ‘spillovers’). In line with our definition of polycentricity, spacing is defined as the average distance (as the crow flies) between the four largest cities in a region. The lower the average distance between the cities, the more the cities are geographically clustered. Polycentric and dispersed regions with a high degree of clustering in one part of the region would behave more like a monocentric region compared to the situation in which the cities are spread over the region (MEIJERS and SANDBERG, 2008). Retail concentration is measured as the share of the stores in a region concentrated in the largest retail center. The degree of retail concentration is estimated for the different store types and also obtained from the LISA database. Finally, the net outflow of consumers of a region is estimated as the difference between the number of shopping trips originating from the region that are targeted at another region minus the shopping trips from outside the region targeted at that region divided by the total number of shopping trips targeted and originating from that region (including intra-regional shopping trips). Data on shopping trips is obtained from Mobiliteitsonderzoek Nederland (National Travel Survey) for the period 2004-2008. The scores of these variables by WGR region are presented in Table 3. Table 3: Spacing, Retail Concentration and Net Outflow of Consumers by WGR region
ECONOMETRIC TESTINGRegional Spatial Structure and Retail AmenitiesTable 4 shows the results of the negative binomial estimation of regional spatial structure variables on the number of stores in a region, including year fixed effects and controlling for other region-specific characteristics that may have an impact on our spatial structure parameters. All models are estimated using robust standard errors to correct for clustering of observations in regions. The statistically significant likelihood-ratio test of alpha (α) indicates that the negative binomial specification is preferred over its Poisson counterpart because of the presence of overdispersion. Turning to the regression results, and limiting our discussion to the variables of our interest, we find no effect of the degree of polycentricity and dispersion on the number of stores in a region, holding everything else constant. This is in contrast with our first proposition that polycentricity and dispersion would negatively affect the presence of retail. However, we find a negative and significant effect for the interaction between dispersion and polycentricity on the number of stores in a region. This indicates the presence of less retail amenities in regions that are characterized by both a polycentric and dispersed spatial structure, such as Delfzijl and Veendam as well as the presence of more retail amenities in regions that are characterized by both a monocentric and centralized spatial structure, such as Amsterdam and Rotterdam (see Figure 3). Table 4: Negative Binomial Pseudo Maximum Likelihood (NBPML) Estimation on Number of Stores in Retail
Our second proposition stated that more specialized retail would be less present in polycentric or dispersed regions. Indeed, there are considerable differences across store types. Models 3-14 in Tables 5 and 6 present the estimates for the store type-specific models. Models 3-8 show regressions by store urbanism. We find that more polycentric regions are characterized by a more limited presence of “urban loving” store types, which tend to be more specialized. Similarly, also a more dispersed spatial structure leads to significantly less “urban loving” –store types. However, dispersion has a positive effect on the presence of “urban avoiding” store types. Regions that are both polycentric and dispersed tend to have a more limited presence of all these store types. Models 9-14 analyse the determinants of the number of stores by store orientation. If the degree of polycentricity increases by 1%, the number of stores that cater to multipurpose and comparison shoppers (MC) decreases by about 0.08%. On the contrary, polycentricity has no effect on the number of stores that rely on externalities generated by multipurpose (M) or comparison (C) shoppers only. Likewise, dispersion has a stronger negative effect on the number of stores that attract multipurpose and comparison shoppers than on the number of stores that attract solely multipurpose or single-purpose comparison shoppers. Interestingly, single-purpose comparison shops tend be more present when a region is more dispersed, while multipurpose and comparison shopping is less present in the same urban circumstances. The effect of the interaction between dispersion and polycentricity is negative for all store orientation categories, but is more strongly negative for the MC and C store types. Accordingly and in line with the second proposition, it can be concluded that more polycentric and dispersed regions are home to less specialized retail amenities. Table 5: Negative Binomial Pseudo Maximum Likelihood (NBPML) Estimation on Number of Stores in Retail by Store Urbanism
Table 6: Negative Binomial Pseudo Maximum Likelihood (NBPML) Estimation on Number of Stores in Retail by Store Type
Spacing, Retail Concentration and Retail AmenitiesThe third proposition stated that having more proximate centres in a polycentric or dispersed region would be beneficial compared to the situation in which they were more spread out. Examining the interaction between spacing and the regional spatial structure variables in Table 7, we find no main effect of the degree of spacing between centres in a region on the number of stores in a region (Model 15). However, there is a negative effect of the interaction between spacing and polycentricity and the interaction between spacing and dispersion. These negative and significant interaction terms can be interpreted as the fact that retail amenities in polycentric and dispersed regions are more negatively affected by large distances between the centres than that is the case in monocentric regions. Alternatively, this confirms our expectations based on the third proposition that the larger the spacing between centres in a region, the more negative the effect of polycentricity and dispersion on the number of stores in a region is. However, the interaction effect between spacing and dispersion differs across store types (Model 16-21) and is significantly lower for “urban loving” and MC store types than for the other store types9. The interaction effect between spacing and polycentricity varies less drastically across store types, although it is significantly more negative for MC and C store types than for M store types. Accordingly, it can be inferred that spacing between the centres has especially a negative effect on the number of specialized stores in a region. Table 7: NBPML Estimation on Number of Stores in Retail – Spacing Effect
Our fourth proposition concerns the question whether concentration of retail in one centre of a polycentric or dispersed region would be beneficial. Table 8 shows the results on retail concentration, regional spatial structure and the number of stores in a region10. For a region with an average level of polycentricity and dispersion, we find no effect of retail concentration of stores on the number of stores in a region11, as well as no effect of the interaction term between retail concentration and polycentricity. However, the interaction effect between retail concentration and dispersion is positive and significant. This means that, in line with our fourth proposition, more retail amenities are present in dispersed regions in which retail is concentrated. Parameter estimates differ across store types and especially the specialized store types that cater to multipurpose and comparison shoppers (Model 26) profit from retail concentration. This also makes sense from a theoretical point of view as these stores profit from the concentration of similar types of stores. To compare, for stores that only draw on multipurpose shoppers (Model 27), we find a negative effect of retail concentration (although not significantly so) and the interaction effect between retail concentration and polycentricity. This is in line with the prediction by MCLAFFERTY and GHOSH (1986) that multipurpose shopping by itself generally leads to a dispersion of similar, competing retail establishments. Nevertheless, more disaggregated analysis by retailing function is needed here to validate this claim. We also find a positive interaction effect between retail concentration and dispersion for the urban avoiding stores, meaning that in dispersed areas we find more of such stores in case these are concentrated. However, this does not necessarily mean that these store types profit from concentration in large cities as it is well known that the retailing functions such as garden centres and furniture stores cluster together on industrial sites at the fringe of the city. Table 8: NBPML Estimation on Number of Stores in Retail –Retail Concentration Effect
Regional Spatial Structure and Outward OrientationThe foregoing analyses implicitly assumed that retailing functions outside a certain region do not have any effect on the retailing functions within that region. Although on average 93% of all Dutch shopping trips take place within the own region, there are considerable differences across regions, and especially in polycentric and dispersed regions. For example, Delfzijl in the north of the Netherlands can be considered a second-order region within some first-order region at a higher geographical scale with Groningen (see also Figure 2) as principal centre. This is reflected in the large share of shopping trips (13.6%) that originate from the Delfzijl region and are targeted at Groningen. At the same time, few people living in Groningen (0.9%) do their shopping in the Delfzijl region. Comparable regions that are also characterised by a net outflow of consumers to neighbouring regions are Gouda (large net loss of consumers to Rotterdam and The Hague), Goes (net loss to cities as Bergen op zoom, Roosendaal and Breda), and Sneek (large net loss to Drachten and Leeuwarden). There exists a moderately strong correlation between the degree of polycentricity and the net outflow of consumers (0.24) and the degree of dispersion and the net outflow of consumers (0.52) in the sense that more polycentric and more dispersed regions are characterised by higher net outflows of consumers. In actual fact, monocentric regions with large principal cities such as Amsterdam, Rotterdam and Groningen experience a net inflow of consumers. Yet, some polycentric and/or dispersed regions such as Middelburg and Terneuzen that are relatively spatially isolated, face less competition from neighbouring regions, and, hence, do not experience a large loss of consumers to neighbouring regions. Table 9 shows the regression results of the net outflow of consumers on the number of stores in a region. Although this specification faces some serious endogeneity problems given that the direction of the relationship between consumer mobility and retail amenities is far from clear (in that the absence of retail amenities in a region can also lead to the generation of shopping trips to other regions), we find a negative and significant relation between the net outflow of consumers and the number of stores in a region (Model 29). This is in line with our fifth proposition, in which a net outflow of consumers was considered to lead to less, and in particular less specialised retail. For a region with an average level of polycentricity and dispersion, a 1 percentage point increase in the net outflow of consumers translates into a decrease in the number of stores by 0.61%, holding everything else constant. The interaction effects between the net outflow of consumers and the regional spatial structure variables are also negative12. This means that the larger the net outflow of consumers to other regions, the more negative the effect of polycentricity and dispersion on the number of stores in a region is. Especially stores that profit from a densely populated environment and cater to multipurpose and comparison shoppers are affected by a relatively large net outflow of consumers (Model 30-35). This is in line with our expectations, as these are more specialised stores for which consumers are willing to travel longer distances and which require a large demand threshold. Table 9: NBPML Estimation on Number of Stores in Retail – Net Outward Consumers Effect
CONCLUSIONS AND DISCUSSIONIn this paper, we have researched the relationship between regional spatial structure and the presence of retail amenities in a region. It was found that there is no relationship between polycentricity or dispersion and the overall number of stores, but regions that are both polycentric ánd dispersed are characterised by relatively less retail amenities. In addition, it was found that polycentric and dispersed regions host less specialised retailing functions that cater to multipurpose and comparison shoppers and/or demand an urban environment. This paper subsequently explored ways to overcome these negative effects of polycentricity and dispersion. It was obtained that the effect of polycentricity and dispersion is dependent on (1) the spacing between cities in a region, (2) retail concentration, and (3) spatial competition from neighbouring regions. Polycentric or dispersed regions that fared better than other polycentric or dispersed regions were characterised by (a) its constituent centres being located more proximally, (b) a relative strong concentration of retail in one centre, and (c) less competition from centres outside the region. These findings have important implications for regional policy. First, as polycentric and dispersed regions in which the distances between the different cities are relatively small perform generally better in the sense that they host more (specialised) retail amenities, it would make sense to limit these distances. Although one cannot change physical distance between cities in a region, investments in infrastructure and public transportation could be targeted to limit the distance in terms of travel time. This overcomes barriers to consumer trade and, hence, allows to ‘organise’ critical mass in a region to generate urban network externalities. This does, however, not necessarily mean that all cities within the region will be better off in terms of retail amenities. In some situations, investments in transportation will assist the largest or most central cities in the network to acquire more agglomeration advantages, resulting in agglomeration rather than spatial dispersal of economic activities (MCCANN and SHEFER, 2004). Second, polycentric and dispersed regions in which retail is relatively concentrated perform generally better in terms of having more specialised retail amenities that cater to multipurpose and comparison shoppers, as well as store types that normally flourish in larger cities. Here, regional coordination between the different cities in a region can play an important role in realising concentration of specialised retail. Such coordination should aim at avoiding duplications in local retail development strategies in a situation where cities are often pursuing the same policy to promote their distinctiveness to increase local prosperity (TUROK, 2009). It is not necessary, if not undesirable, to concentrate all retailing functions: those stores that sell frequently bought convenience goods and only cater to multipurpose shoppers do not need to be concentrated. Yet, reducing intra-regional spatial competition by means of concentration of retail to maximise retail amenities at the regional level will also be beneficial to battle competition from retail centres in neighbouring regions. However, improving regional coordination with respect to retail planning is easier said than done, as the benefits and costs of such a strategy accrue to different stakeholders and appear at different moments in time. This calls for trade-off mechanisms, as well as (planning) tools, such as regional spatial visioning processes, to raise understanding of the ‘regional’ common good among local decision-makers. At the same time, future research should compare the relative importance of spatial structure with that of institutional (planning) strategies (EVERS 2008) in order to obtain a better understanding of how both factors jointly influence retail amenities in regions. This should also extend the analysis to non-retail amenities, as these face similar issues in spatial structure, agglomeration economies and shifting market demand as retail amenities do. ACKNOWLEDGEMENTSWe would like to thank two anonymous reviewers and the participants of the Workshop on Urban Systems 2.0 in Delft for useful suggestions and comments on earlier versions of this paper. All errors remain ours. REFERENCESADOLPHSON, M. (2009): ‘Estimating a polycentric urban structure. Case study: urban changes in the Stockholm region’, Journal of Urban Planning and Development 135: 19-30. AGUILERA, A. and MIGNOT, D. (2004): ‘Urban sprawl, polycentrism and commuting. A comparison of seven French urban areas’, Urban Public Economics Review 1: 93-113. ALDERSON, A. and BECKFIELD, J. (2004): ‘Power and position in the world city system’, American Journal of Sociology109: 811-851. BERRY, B.J.L. (1964): ‘Cities as systems within systems of cities’, Papers of the Regional Science Association 13: 146-163. BERRY, B.J.L. and GARRISON, W.L. (1958): ‘A note on central place theory and the range of a good’, Economic Geography 34: 304-311. BERRY, B.J.L. and PARR, J.B. with EPSTEIN, B.J., GHOSH, A. and SMITH, R.H.T. (1988):Market Centres as Retail Locations. Prentice Hall, Englewood Cliffs, NJ. BORCHERT, J.G. (1998): ‘Spatial dynamics of retail structure and the venerable retail hierarchy’, GeoJournal 45: 327-336. BUCKWALTER, D.W. (1990): ‘Diverse retail structure and Christaller’s separation principle in medium-sized metropolitan areas’, Growth and Change 21, 15-31. BURGER, M.J., DE GOEI, B., VAN DER LAAN, L. and HUISMAN, F.J.M. (2011): ‘Heterogeneous development of metropolitan spatial structure: evidence from commuting patterns in English and Welsh city-regions, 1981-2001’, Cities 28: 160-170. BURGER, M.J. and MEIJERS, E.J. (2012): ‘Form follows function? Linking morphological and functional polycentricity’, Urban Studies 49: 1127-1149. BURGER, M.J., VAN DER KNAAP, B. and WALL, R.S. (2013): ‘Polycentricity and the multiplexity of urban networks’, European Planning Studies, forthcoming. DOI:10.1080/09654313.2013.771619 BURGER, M.J., VAN OORT, F.G. and LINDERS, G.J.M. (2009): ‘On the specification of the gravity model of trade: zeros, excess zeros and zero-inflated estimation’, Spatial Economic Analysis 4: 167-190. CAPELLO, R. (2000): ‘The city network paradigm: measuring urban network externalities’: Urban Studies 37: 1925-1945. CHESHIRE, P. (1999): ‘Trends in sizes and structures in urban areas’, in CHESHIRE, P. and MILLS, E.S. (eds): Handbook of Regional Science and Urban Economics, Volume 3: Applied Urban Economics. Elsevier, Amsterdam, pp 1339-1372. CHESHIRE, P. (2006): ‘Resurgent cities, urban myths and policy hubris: what we need to know’, Urban Studies 43: 1231-1246. CHRISTALLER, W. (1933): Die Zentralen Orte in Süddeutschland. Gustav Fischer, Jena. CLARK, T.N., LLOYD, R., WONG, K.K. and JAIN, P. (2002): ‘Amenities drive urban growth’, Journal of Urban Affairs 24: 493-515. CLARK, W.A.V. and KUIJPERS-LINDE, M. (1994): ‘Commuting in restructuring urban regions’, Urban Studies 31: 465-483. COFFEY, W.J., BOURNE, L.S., RANDALL, J.E., DAVIES, W.K.D. and WHITE, R. (1998): ‘Urban systems research: past, present and future: a panel discussion’, Canadian Journal of Regional Science 21, 327-364. DAVIES, W.K.D. (1967): ‘Centrality and the central place hierarchy’, Urban Studies 4, 61-79. DE GOEI, B., BURGER, M.J., VAN OORT, F.G. and KITSON, M. (2010), ‘Functional polycentrism and urban network development in the Greater South East, United Kingdom: evidence from commuting patterns, Regional Studies, 42: 1149-1170. DIELEMAN, F.M., DIJST, M. and BURGHOUWT, G. (2002): ‘Urban form and travel behavior: micro-level household attributes and residential context'’, Urban Studies 39: 507-527. EATON, B.C. and LIPSEY, R.G. (1979): ‘Comparison shopping and the clustering of homogeneous firms’, Journal of Regional Science 19: 421-435. EATON, B.C. and LIPSEY, R.G. (1982): ‘An economic theory of central places’, Economic Journal 92: 56-72. EVERS, D. (2002): ‘The rise (and fall?) of Dutch retail planning’, Tijdschrift voor Economische en Sociale Geografie, 93, 107-113. Evers, D. (2008): The Politics of Peripheral Shopping Centre Development in Northwest Europe in the 1990s: The Cases of Manchester, Amsterdam, and Oberhausen. Lewiston: Edwin Mellen Press. FRENKEN, K., VAN OORT, F.G. and VERBURG, T. (2007): ‘Related variety, unrelated variety and economic growth’, Regional Studies 41: 685-697. GABAIX, X. and IBRAGIMOV, R. (2011): ‘Rank-1/2: a simple way to improve the OLS estimation of tail exponents’, Journal of Business Economics and Statistics 29: 24-39. GHOSH, A. (1986): ‘The value of a mall and other insights from a revised central place model’, Journal of Retailing 62: 79-97. GOLOSINSKI, D. and WEST, D.S. (1995): ‘Double moral hazard and shopping center similarity in Canada’, Journal of Law, Economics, & Organization 11: 456-478. GOURIEROUX, C., MONTFORT, A. and TROGNON, A. (1984): ‘Pseudo maximum likelihood methods: applications to Poisson models’, Econometrica 52: 701-720. GLAESER, E.L., KOLKO, J. and SAIZ, A. (2001), ‘Consumer city’, Journal of Economic Geography, 1: 27-50. GREEN, N. (2007): ‘Functional polycentricity: a formal definition in terms of network analysis’, 44: 2077-2103. GREEN, N. (2008): ‘City-states and the spatial in-between’, Town and Country Planning, 77: 223-231. GREENE, W.H. (1994): ‘Accounting for excess zeros and sample selection in Poisson and negative binomial models’, Working Paper 94 – 10, Stern School of Business, New York University, New York. HALL, P. and PAIN K. (2006): The Polycentric Metropolis: Learning from Mega-City Regions in Europe. Earthscan, London. HANSSENS, H., DERUDDER, B., VAN AELST, S. and WITLOX, F. (2013): ‘Assessing the functional polycentricity of the mega-city-region of Central Belgium based on advanced producer service transaction links’, Regional Studies, forthcoming. DOI:10.1080/00343404.2012.759650. HARRIS, T.R. and SHONKWILER, J.S. (1993): ‘Application of count data procedures to estimate thresholds for rural commercial sectors. Proceedings of the Western Agricultural Economies Association, pp. 410-415. HENDERSON, J.W., KELLY, T.M. and TAYLOR, B.A. (2000): ‘The impact of agglomeration economies on estimated demand thresholds: an extension of Wensley and Stabler’, Journal of Regonal Science, 40: 719-733. HOYLER, M., KLOOSTERMAN, R.C. and SOKOL, M. (2008), ‘Polycentric puzzles – Emerging mega-city regions seen through the lens of advanced producer services’, Regional Studies 42: 1055-1064. INGENE, C.A. and GHOSH, A. (1990): ‘Consumer and producer behavior in a multipurpose shopping environment, Geographical Analysis 22: 70-93. JONES, K. and SIMMONS, J. (1990): The Retail Environment. Routledge, London. KLOOSTERMAN, R.C. and MUSTERD, S. (2001): ‘The polycentric urban region: towards a research agenda, Urban Studies 38: 623-633 LAMBOOY, J.G. (1998): ‘Polynucleation and economic development: the Randstad’, European Planning Studies 6: 457-466. LAMBREGTS, B. (2009): The Polycentric Metropolis Unpacked: Concepts, Trends, and Policy in the Randstad Holland. Amsterdam: Amsterdam Institute for Metropolitan and International Development Studies. LONG, J.S. (1997):Regression Models for Categorical and Limited Dependent Variables. Sage, Thousand Oaks, CA. LÖSCH, A. (1944): Die Räumliche Ordnung der Wirtschaft. Gustav Fischer, Jena. MARKUSEN, A. and SCHROCK, G. (2009): ‘Consumption-driven urban development’, Urban Geography 30, 1-24. MCCANN, P. and SHEFER, D. (2004): ‘Location, agglomeration and infrastructure’, Papers in Regional Science, 83: 177-196. MCLAFFERTY, S. and GHOSH, A. (1986): ‘Multipurpose shopping and the location of retail firms’, Geographical Analysis 18: 215-226. MEIJERS, E.J. (2005): ‘Polycentric urban regions and the quest for synergy: is a network of cities more than the sum of its parts’, Urban Studies 42: 765-781. MEIJERS, E.J. (2008a): ‘Measuring polycentricity and its promises’, European Planning Studies 16: 1313-1323. MEIJERS, E.J. (2008b): ‘Summing small cities does not make a large city: polycentric urban regions and the provision of cultural, leisure and sports amenities’, Urban Studies 45: 2323-2342. MEIJERS, E.J. and BURGER, M.J. (2010): ‘Spatial structure and productivity in US metropolitan areas’, Environment and Planning A 42: 1383-1402. MEIJERS, E.J. and SANDBERG, K. (2008): Reducing spatial disparities by means of polycentric development: panacea or placebo?, ScienzeRegionali 7: 71-96. MELO, P.C., GRAHAM, D.J. and NOLAND, R.B. (2009): ‘A meta-analysis of estimates of urban agglomeration economies’, Regional Science and Urban Economics 39: 332-342. MULLIGAN, G.F.(1984): Agglomeration and central place theory: a review of the literature, International Regional Science Review 9: 1-42. MUSHINSKI, D. and WEILER, S. (2002):A note on the geographical interdependencies of retail market areas’, Journal of Regional Science 42: 75-86. NIELSEN, T.A.S. and HOVGESEN, H.H. (2005): ‘Urban field in the making: new evidence from a Danish context’, Tijdschrift voorEconomische en Sociale Geografie 96: 515-528. O’KELLY, M.E. (1981): ‘A model of the demand for retail facilities, incorporating multistop, multipurpose trips, Geographical Analysis 13: 134-148. PARR, J.B. (2004): ‘The polycentric urban region: a closer inspection’, Regional Studies 38: 231-240. PARR, J.B. and DENIKE, K.G. (1970): ‘Theoretical problems in central place analysis’, Economic Geography 46: 568-586. PUGA, D. (2010): ‘The magnitude and causes of agglomeration economies’, Journal of Regional Science 50: 203-220. RICHARDSON, H.W. (1972): ‘Optimality in city size, systems of cities and urban policy: a sceptic’s view’, Urban Studies 9: 29-48. ROSENTHAL, S.S. and STRANGE, W.C. (2004): ‘Evidence on the nature and sources of agglomeration economies’, in HENDERSON, J.V. and THISSE, J.F. (eds): Handbook of Regional Science and Urban Economics, Volume 4: Cities and Geography. Elsevier, Amsterdam, pp 2119-2171. SCOTT, A.J. (2000): ‘Economic geography: the great half-century’, Cambridge Journal of Economics 24: 483-504. SHONKWILER, J.S. and HARRIS, T.R. (1998): ‘Rural retail business thresholds and interdependencies’, Journal of Regional Science 36: 617-630. Schwanen, T., M. Dijst and F. Dieleman (2004), Policies for urban form and their impact on travel: the Netherlands experience, Urban Studies 41: 579-603. TABUCHI, T. and YOSHIDA, A. (2000): ‘Separating agglomeration economies in consumption and production’, Journal of Urban Economics 48: 70-84. TAYLOR, P.J. (2004): World City Network: A Global Urban Analysis. Routledge, London. TAYLOR, P.J. and LANG, R.E. (2004): ‘The shock of the new: 100 concepts describing recent urban change’, Environment and Planning A 36: 951-958. THILMANY, D., MCKENNEY, N., MUSHINSKI, D. and WEILER, S. (2005): ‘Beggar-thy-neighbor economic development: a note on the effect of geographic interdependencies in rural retail markets’, The Annals of Regional Science 39: 593-605. TUROK, I. and BAILEY, N. (2004): ’The theory of polynuclear urban regions and its application to Central Scotland ‘, European Planning Studies 12: 371-389 TUROK, I. (2009): ‘The distinctive city: pitfalls in the pursuit of differential advantage’, Environment and Planning A 41: 13-30. VAN DER LAAN, L. (1998): ‘Changing urban systems: an empirical analysis at two spatial levels’, Regional Studies 32: 235-249. VAN NUFFEL, N. and SAEY, P. (2005): ‘Commuting, hierarchy and networks: the case of Flanders’, Tijdschrift voor Economische en Sociale Geografie 96: 313-327. VAN OORT, F.G. (2004): Urban Growth and Innovation. Spatially Bounded Externalities in the Netherlands. Ashgate, Aldershot. VAN OORT, F., BURGER, M. and RASPE, O. (2010): ‘On the economic foundation of the urban network paradigm. Spatial integration, functional integration and economic complementarities within the Dutch Randstad’, Urban Studies 47: 725-748. WALL, R.S. and VAN DER KNAAP, G.A. (2011): ‘Sectoral differentiation and network structure witin contemporary worldwide corporate networks’, Economic Geography, 87: 267-308. WENSLEY, M.R.D. and STABLER, J.C. (1998): ’Demand-threshold estimation for business activities in rural Saskatchewan’, Journal of Regional Science 38: 155-177. WELTEVREDEN, J., ATZEMA, O. and FRENKEN, K. (2005): ‘Evolution of city centre retailing: the case of Utrecht (1974-2003)’, International Journal of Retail and Distribution Management 33: 824-841. WEST, D.S. (1992): ‘An empirical analysis of retail chains and shopping center similarity’, Journal of Industrial Economics 40: 201-221. WEST, D.S., VON HOHENBALKEN, B. and KRONER, K. (1985): ‘Tests of intraurban central place theories’, The Economic Journal 95: 101-117. YEATES, M. (1990): The North American City, 4th edition: New York: Harper & Row Publishers. YEATES, M., CHARLES, A. and JONES, K. (2001): ‘Anchors and externalities’, Canadian Journal of Regional Science 24: 465-484. NOTES* Martijn J. Burger, Department of Applied Economics, Erasmus University Rotterdam, Tinbergen Institute and Erasmus Research Institute for Management (ERIM), Rotterdam. E-mail: mburger@ese.eur.nl ** Evert J. Meijers, OTB Research Institute for Housing, Urban and Mobility Studies, Delft University of Technology. E-mail: e.j.meijers@tudelft.nl *** Frank G. van Oort, Department of Economic Geography, Utrecht University. E-mail: f.vanoort@geo.uu.nl 1. Here we use a morphological approach to spatial structure. A more thorough discussion of the distinction between the morphological and functional approach can be found in HALL and PAIN (2006), GREEN (2007) and BURGER and MEIJERS (2012). 2. Notable exceptions are VAN OORT et al. (2010) and HANSSENS et al. (2013), who study buyer-supplier relations and a number of chapters in HALL and PAIN (2006) that discuss regional office networks. A comparison of the spatial organization of different functional networks is provided by BURGER et al. (2013). 3. This paper focuses on the 'average' or 'representative' consumer, whereas current research on retail emphasises the increasing differentiation, by income and age groups.Unfortunately, the data does not allow us to distinguish between different types of consumers. 4. In this it is assumed that lower-order centres do not provide goods and services to the highest-order central place and trade between centres of similar size is considered redundant as these centres provide the same goods and services. 5. In their original classification, WEST et al. (1985) also mention the existence of S stores, which provide single isolated purchases. These mainly concerns business related to entertainment such as restaurants, bars, movie theatres and arcades. These types of stores are not classified as retail establishments in the Netherlands and therefore beyond the scope of this paper. 6. Here, the parameter values have been estimated using the rank-size regression approach by GABAIX and IBRAGIMOV (2011), which corrects for small sample bias. 7. Here, negative binomial models are preferred over Poisson model due to the presence of considerable overdispersion (see GOURIEROUX et al., 1984). These models can be considered modification of the conventional Poisson regression model (GREENE, 1994), which is the conventional count data model. 8. In regressions in which this parameter is not constrained, the parameter value for Population (ln) is most often very close to 1. 9. The related Wald tests on the equality of coefficients are available upon request. 10. VIF statistics indicated no multicollinearity problem between the spatial structure and retail structure variables. 11. Similar conclusions can be drawn based on a model without interaction terms. 12. Yet we believe that in principal stores follow people and not the other way around. Hence, the net outflow of consumers foremost signifies the opportunities consumers have to shop outside a region.
|
|||||||||||||||||||||||||||||||||||||||||||||||||||||||||||||||||||||||||||||||||||||||||||||||||||||||||||||||||||||||||||||||||||||||||||||||||||||||||||||||||||||||||||||||||||||||||||||||||||||||||||||||||||||||||||||||||||||||||||||||||||||||||||||||||||||||||||||||||||||||||||||||||||||||||||||||||||||||||||||||||||||||||||||||||||||||||||||||||||||||||||||||||||||||||||||||||||||||||||||||||||||||||||||||||||||||||||||||||||||||||||||||||||||||||||||||||||||||||||||||||||||||||||||||||||||||||||||||||||||||||||||||||||||||||||||||||||||||||||||||||||||||||||||||||||||||||||||||||||||||||||||||||||||||||||||||||||||||||||||||||||||||||||||||||||||||||||||||||||||||||||||||||||||||||||||||||||||||||||||||||||||||||||||||||||||||||||||||||||||||||||||||||||||||||||||||||||||||||||||||||||||||||||||||||||||||||||||||||||||||||||||||||||||||||||||||||||||||||||||||||||||||||||||||||||||||||||||||||||||||||||||||||||||||||||||||||||||||||||||||||||||||||||||||||||||||||||||||||||||||