GaWC Research Bulletin 410 |
|
|
|
This Research Bulletin has been published in Environment and Planning A, 45 (5), (2013), 1005-1007. doi:10.1068/a45488 Please refer to the published version when quoting the paper
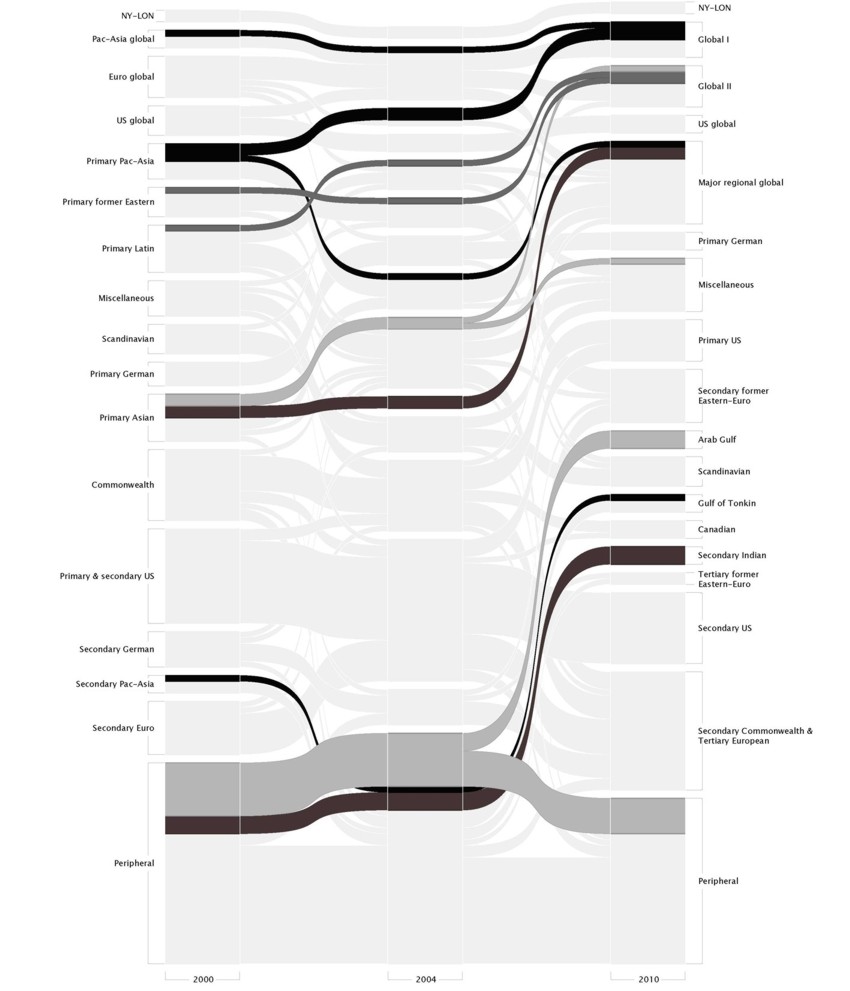
We employ alluvial diagrams (Rosvall and Bergstrom, 2010) to map the evolution of interweaving hierarchical and regional tendencies in the transnational urban networks created by globalizing producer services firms (Derudder et al., 2003; Taylor et al., 2012). We first applied a hierarchical cluster analysis to 139 leading cities for 2000, 2004 and 2010 respectively, whereby cities are grouped based on their portfolio of firms. In the alluvial diagram, individual blocks represent city clusters, and in each year blocks are ranked hierarchically (i.e. from top to bottom based on the average number of firms per member city). Clusters are named after the formative type of member city, e.g. the continued presence of hierarchically ordered and regionally coherent clusters of United States cities. Horizontal streams connect preceding and succeeding clusters based on shared city membership, which allows tracing how individual as well as groups of cities' positions evolve over time. The width of a streamline is proportional to the number of cities with the corresponding membership change. More technical details can be found in Liu et al. (2012).
Overall change in hierarchical and regional tendencies can be discerned from the shifting designation and ordering of clusters. Here we highlight some notable examples of change, i.e. the combination of upward trajectories and regionalized allegiances of key cities in BRIC countries and the Arab Gulf Region. The black streamlines represent Chinese cities (Shanghai, Beijing, Guangzhou, Hong Kong and Taipei), dark grey is used for Indian cities (Mumbai, New Delhi, Calcutta, Chennai and Bangalore), medium grey for leading Russian and Brazilian cities (Moscow and Sao Paulo), and light grey for Arab Gulf cities. The alluvial diagram allows for a straightforward appraisal of how the position of these cities has changed over time:
ReferencesDerudder B, Taylor P, Witlox F, Catalano G, 2003. Hierarchical tendencies and regional patterns in the world city network: A global urban analysis of 234 cities, Regional Studies 37, 875-886. Liu X, Derudder B, Taylor P, 2012, Mapping the temporal evolution of clusters in the world city network, submitted for publication. Rosvall M, Bergstrom C, 2010, "Mapping change in large networks", PLoS One, e8694. Taylor P, Derudder B, Hoyler M, Ni P, forthcoming, New Regional Geographies of the World as Practised by Leading Advanced Producer Service Firms in 2010, Transactions of the Institute of British Geographers. available at: http://www.lboro.ac.uk/gawc/rb/rb392.html SoftwareMatlab 2009, Alluvial Generator (http://www.mapequation.org/alluvialgenerator/index.html) NOTES* Xingjian Liu, Department of Geography, University of Cambridge, UK, email: xl306@cam.ac.uk ** Ben Derudder, Geography Department, Ghent University, Belgium, email: ben.derudder@ugent.be *** György Csomós, Faculty of Engineering, University of Debrecen, Hungary, email: csomos@eng.unideb.hu **** Peter J. Taylor, Department of Geography and Environment, Northumbria University, UK, email: crogfam@yahoo.com
Note: This Research Bulletin has been published in Environment and Planning A, 45 (5), (2013), 1005-1007 |
||