GaWC Research Bulletin 403 |
|
|
|
This Research Bulletin has been published in Urban Studies, 50 (6), (2013), 1277-1291. Please refer to the published version when quoting the paper.
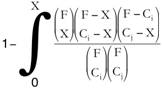
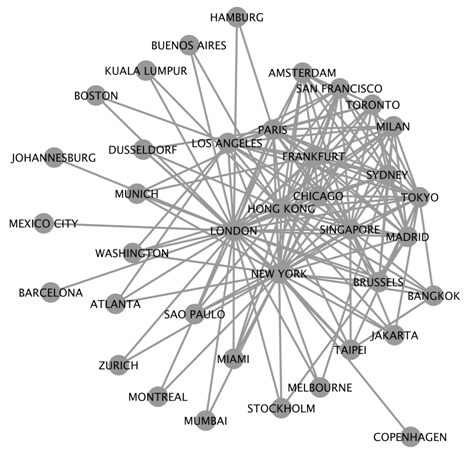
IntroductionTSince its introduction over a decade ago, the interlocking network model (INM) has been widely adopted to explore how advanced producer service firms’ international branch networks lead to the formation of world city networks. In its traditional form, the INM implicitly focuses on a world city network formed through brute force, where intercity linkages are forged by cities’ sheer economic size and dominance. From this perspective, the economically largest cities’ participation in the network is virtually guaranteed; their sheer size makes them well connected by default. Brute force linkages are easy to recognize – for example, the importance of the connection between New York and London (NYLON) is obvious – but can potentially obscure subtler linkages among smaller cities. Thus, to compliment this brute force perspective, I propose an alternative that views world city network formation as the outcome of the process through which specific firms come to operate locations in specific cities, that is, the firms-into-cities sorting process. Although the forces that drive this sorting process are complex and often unknown, I develop a statistical test that permits the identification of intercity linkages that could only have arisen through a sorting process driven by nonrandom forces, and thus warrant particular attention. World city networks formed by brute force and by sorting processes present different views of global urban system that can be examined separately and compared, or can be combined into a composite network. I begin by reviewing the theoretical foundations and methodological implementation of the INM, and describe the widely analyzed Globalization and World Cities (GaWC) dataset 11, which I use throughout the paper as an example. In the second section, I apply the traditional INM to these data, explaining why it yields a network of brute force linkages and considering some limitations to this approach. In the third section, I describe the notion of a firms-into-cities sorting process and introduce a statistical test of the significance of linkages arising from such a process, which I use to construct a complementary world city network. The presence of expected patterns of interaction (e.g. among U.S. federal reserve cities) that are obscured in the brute force network highlights the utility of this method and the resulting network. In the fourth section I examine two composite networks that combine intercity linkages arising from brute force and sorting processes. I conclude by discussing the limitations of the proposed method, and future directions for studies adopting this approach. The Interlocking Network Model and GaWC Dataset 11The INM begins with the relatively uncontroversial assumption that conducting business across multiple cities and countries is difficult. There are many potential sources of difficulty, including differing currencies, differing contract laws, differing languages, and differing cultural practices. To manage such complexities, multinational corporations that produce goods or services for consumers (hereafter, corporations) frequently turn for assistance to advanced producer service firms that provide services to corporations (hereafter, firms), such as international law firms and banks. Many conceptions of world cities have focused on those places that serve as homes to corporate headquarters (e.g. Alderson and Beckfield 2004), but the INM takes a notably different approach, observing that corporations cannot (or do not) directly interact with one another. Instead, this model highlights the critical role of firms to mediate and facilitate corporations’ interactions. Because corporations cannot interact without the assistance of firms, it contends that firms, and not the corporations they serve, make intercity and transnational business possible, and thus are the essential building blocks of world cities and the world city network (Sassen 2001; Taylor 2001). Beyond highlighting the importance of advanced producer service firms, the INM also specifies how “the behavior of firms within and across cities…creates world cities as nodes of the network” (Taylor 2001: 182). Specifically, it contends that the world city network arises as firms facilitate intercity economic transactions through their branch office networks. When a single firm operates branch offices in two different cities, this facilitates the exchange of information between these cities, and enables the firm to provide its corporate clients with seamless service and reduced transaction costs when transacting business between these cities. Thus, a firm’s branch office co-location in a pair of cities is viewed as forging a linkage – here, representing the potential for information and economic exchange – between them. To take a specific example, the global accounting firm, PricewaterhouseCoopers (PwC), maintains branch offices in more than 700 cities worldwide, including both New York and London. PwC’s co-location in these two cities reduces the transaction costs involved when a corporation headquartered in New York must interact with a corporation headquartered in London. By both relying on PwC, whose branch office network seamlessly links these two cities, corporations in these two cities are able to “speak the same language” and interact more readily. By extension, when many different firms in addition to PwC also co-locate in New York and London, this still further increases the capacity or likelihood for economic transactions between these cities. In the most general terms, then, the INM views the potential for interactions between two cities as a function of the number of firms that maintain branch locations in each. In addition to this theoretical specification, the INM also provides a quantitative method capable of constructing a corresponding interlocking world city network. A firm location matrix, F, records the location of firms’ branches in cities throughout the world, where the value of cell Fij indicates the importance of firm i’s branch office in city j. From F, a city network matrix, N, is defined as N = FF¢. In the resulting matrix, cell Nij provides an estimate of the capacity for economic transactions between i and j1. This method has been most extensively applied to the GaWC dataset 11 (GaWC11), which is the empirical foundation of the majority of claims derived from applications of the INM. These data were collected in 2000, and record the importance of 100 firms’ branch offices in 315 cities in a firm location matrix; they are available to researchers at http://www.lboro.ac.uk/gawc/datasets/da11.html (Taylor, Catalano, and Walker 2002). Although these data are now somewhat outdated, they are useful for demonstrating the method proposed below because they allow the results to be assessed in the context of past studies and with the benefit of hindsight. In the firm location matrix, each firm-city pair was assigned a value ranging from 0 to 5, where a 5 indicated that the firm maintained its global headquarters in the city, smaller values indicated that the firm maintained a correspondingly smaller office in the city, and a 0 indicated that the firm did not maintain an office in the city. At first glance, these data provide a wealth of information because they record not only where firms are located, but also the size or importance of their locations. However, this level of detail also introduces a number of complications. First, the assignment of a specific value to a firm-city pair is partly subjective, which introduces unknown error and bias. Taylor, Catalano, and Walker (2002) suggested that “particular differences are likely to be ironed out in the aggregate analysis” (p. 2371), but this claim has only been verified in the context of city connectivity rankings (Liu and Taylor 2011), which do not measure world city network structure or cities’ positions within it (Neal 2012). Second, the formula used to transform F into N relies on multiplication, although there is no evidence that the capacity for interaction between cities is a multiplicative function of firm size. For example, suppose firm X operates a global headquarters in London (Fx,London = 5) and a minor office in New York (Fx,New York = 2). According to the INM, this firm provides 10 units of interaction capacity between London and New York (i.e. 5 ´ 2 = 10), but an alternative additive model might suggest that it provides 7 units of interaction capacity (i.e. 5 + 2 = 7), while an alternative “weakest link” model might suggest that it provides 2 units of interaction capacity (i.e. min(2,5) = 2). Third, the formula used to transform F into N assumes that the values are measured on an interval scale, where the difference between adjacent values is equal. However, in these data the values are measured on an ordinal scale: a global headquarters (5) is larger than a regional headquarters (4), which is larger than a major city office (3), but the difference between a global headquarters and a regional headquarters is not necessarily the same as the difference between a regional headquarters and a major city office. To avoid these complications, it is useful to first transform the original valued data into simpler binary data reflecting merely the presence or absence of a given firm in a given city, such that Fij = 1 if firm i maintains an office in city j, and otherwise is 0. This dichotomization avoids each of the issues discussed above, and transforms the data into what is known variously in the network analysis literature as a two-mode, bipartite, or affiliation network. This is particularly useful because an extensive set of methods exist for the analysis of such data, and because it allows the city-to-city network produced by the INM to be viewed as a special case of what is known as a one-mode projection (Breiger 1974; Latapy, Magnien, and Del Vecchio 2008). When the INM is applied to binary data, intercity linkages in the resulting network are simply the number of firms operating branch offices in both cities i and j. To obtain a binary version of F, one key decision is necessary: how large must a firm’s branch office be to count the firm as present in a given city, or more substantively, how large must a firm’s branch office be to meaningfully contribute to a city’s global connectivity? Different answers to this question represent slightly different understandings of what is necessary for cities to interact with one another, and thus should be guided by theoretical considerations that go beyond the scope of this paper. However, different answers do not affect the operation of the methods this paper is intended to demonstrate. For the purposes of illustrating methods for obtaining two different perspectives on the world city network, I treat a firm as present in a city if it maintains an office with a value of at least 3, which focuses attention on a firm’s atypically large offices. World City Network Formation through Brute ForceThe empirical measurement of the world city network first requires some theory concerning how such networks form, and thus of what should count as an intercity linkage. Although never explicitly stated, the traditional INM implicitly adopts the perspective that the world city network is formed in large part through the brute force of economically large cities, where “economic size” refers to the size of a city’s firm population. A simple example serves to illustrate why. In the GaWC11 data, London hosts 83 of 100 firms and New York hosts 74 of 100 firms. No matter which specific 83 firms are located in London or which 74 are located in New York, based on these cities’ economic sizes alone, the strength of their linkage as estimated by the INM must be at least 57 (i.e. 83 – (100 – 74)). Compare this to the actual strength of this linkage estimated by the INM: 63. More than 90% (i.e. 57/63) of the strength of the NYLON linkage estimated by the INM can attributed to the sheer economic sizes of London and New York, rather than to their specific populations of firms. To generalize from this example, by implicitly adopting a brute force perspective on world city network formation, INM-estimated linkages between big cities will tend to be stronger than those between small cities simply because they are bigger. A second example serves to highlight the extent to which the “brute force” effect drives the estimation of linkages by the INM. The INM uses a sophisticated and theoretically motivated mathematical procedure, elegantly expressed as N = FF¢, to produce a world city network where the strength of linkages depend on the co-location of specific firms in specific cities. For example, estimating the strength of the NYLON linkage requires asking, for each of the 100 firms, does this specific firm maintain an office in both London and New York? This can be contrasted with an alternative procedure where the strength of linkages is based not on the location of specific firms, but simply on the product of two cities’ economic size (i.e. total number of firms). Using this alternative, estimating the strength of the NYLON linkage simply requires multiplying London’s number of firms by New York’s number of firms. Repeated for each city pair, the former (i.e. the INM) yields a network based on office co-location, while the latter yields a network based purely on cities’ economic size. However, these two networks are necessarily highly correlated (r = 0.92). This correlation coefficient indicates that about 85% of the variation in INM-estimated linkages is driven by cities’ economic size (i.e. by brute force), and not by the co-location of specific firms2. Figure 1 illustrates a world city network constructed using the traditional INM; for visual clarity, city pairs are shown as connected only if they have at least 20% as many firm co-locations as the city pair with the most observed co-locations, New York and London. The nodes are positioned using the stress minimization algorithm implemented in Visone 2.6.5, which places directly connected cities close to one another and indirectly connected cities successively further apart. This is a portrait of the world city network that has become quite familiar and displays several characteristics that have come to be viewed as defining features of the network circa 2000. First, the network exhibits a roughly core-periphery structure, which has previously been observed in these data (Derudder and Taylor 2005) and highlights the close relationship between world cities and world-systems theory (Smith and Timberlake 1995). Second, the core is composed of the “usual suspects,” including New York, London, Paris, and Tokyo, which have previously been characterized as alpha world cities. Third, the periphery is composed of cities that have previously been characterized as gamma world cities (e.g. Amsterdam, Boston, Jakarta; Beaverstock, Taylor, and Smith 1999). As a world city network formed through brute force, this structure and cities’ positions within it are largely the result of the cities’ sheer economic size: London and New York are big and thus in the core; Amsterdam and Boston are somewhat smaller and thus in the periphery. Nonetheless, it is a valuable perspective because, after all, hosting a large number of advanced producer service firms is no doubt important for a city’s role in the global economy. On the other hand, cities like Kansas City, which hosted offices of only 4 firms in 2000, are absent due primarily to their smaller economic size. While large economic size may be a sufficient reason to suspect a city participates in the world city network, is small economic size a sufficient reason to suspect it does not? World City Network Formation through Sorting ProcessesTo consider the possible involvement of economically smaller cities in the world city network, an alternative to the brute force theory of network formation is necessary. One possibility is to view the world city network as formed through a complex sorting process. Sorting processes have been hypothesized as generative mechanisms for urban phenomena in the past, most notably in Tiebout’s (1956) model of political expenditures and Schelling’s (1971) model of residential segregation, which focus on people being sorted into places through selective migration. In the context of world city networks, the focus is on firms being sorted into cities. More concretely, the focus is on the process through which firms come to operate branch offices in some cities but not others. Many different forces, operating separately or in combination, may guide the outcomes of such a firms-into-cities sorting process. In some cases, a city’s political and business leaders may try to attract a specific firm to open a branch office by offering tax incentives or other enticements, while in other cases, a firm’s executives may select a city for branch office expansion due to its proximity to current or potential clients. Indeed, a number of qualitative studies have sought to uncover the role that the strategic decisions of individual actors play in maintaining and transforming the world city network (Beaverstock, Doel, Hubbard, and Taylor 2002; Lai 2012). Looking beyond the actions of individual human actors, historical (e.g. Lloyd’s has been headquartered in London since 1688) or climatological (e.g. the weather is nice in San Diego) factors may also come into play. For the purposes of developing a theory of world city network formation, it is not necessary (at least, initially) to know which of these forces actually drive the sorting process, but only to recognize that a sorting process is taking place. In the GaWC11 data, there are a nearly infinite number of ways that the 100 firms could have been sorted into the 315 cities, and each of these possible outcomes, including a purely random sorting of firms into cities, would have led to the formation of intercity linkages and a world city network. Intercity linkages that are forged by a simple random sorting process are not particularly interesting; they are the background noise that emerges from the mere fact that economic globalization is unfolding. In contrast, intercity linkages that are so strong they could only have been forged by a nonrandom sorting process are interesting because they identify city pairs that interact for a reason. To be sure, although it may be unclear what that reason for any given linkage is – there are likely many, and they are likely complex – linkages arising from nonrandom forces warrant particular attention. The challenge in constructing a world city network formed by such a sorting process lies in distinguishing which intercity linkages arose from a sorting process driven by random versus nonrandom forces. Specifically, how many firm co-locations are necessary to suggest that the interaction between two cities reflects not simply the general diffusion of globalization, but something deeper? Answering this question requires considering two parameters: the capacity of cities to host firms, and the total number of firms being sorted into them. First, each city i has some pool of resources that defines its capacity, Ci, to serve as the site of firms’ branch offices. The study of these resources and their influence on cities’ capacity has been a central focus of economic and industrial geography for decades, where researchers have considered the influence of cities’ population size, market areas, accessibility, natural resources, and other factors on the number of firms located within them (e.g. central place theory). Some cities like New York or London have a large pool of resources and thus the capacity to host many firms, while other cities like Kansas City have a small pool of resources and thus the capacity to host only a few firms. Second, the global economic system contains a finite number of firms, F, that are being sorted into cities. The study of this value, and others like it, is the domain of industrial demographers who examine changes in the population of firms over time, typically in response to environmental conditions (e.g. Carroll and Hannan 1989). With these two parameters defined, the issue of distinguishing intercity linkages arising from random versus nonrandom sorting processes can be framed as a question about probabilities: what is the probability of observing an INM-estimated linkage between city i and city j that is stronger than X, if Ci of F firms are randomly sorted into city i, and Cj of F firms are randomly sorted into city j? The answer to this question is given by the cumulative distribution function:
This function is constructed from a series of binomial coefficients, where each element of the form
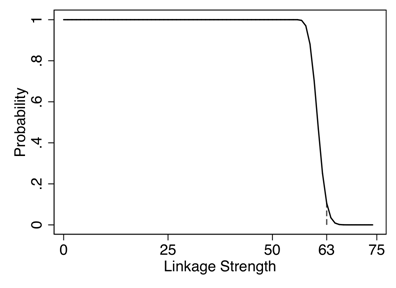
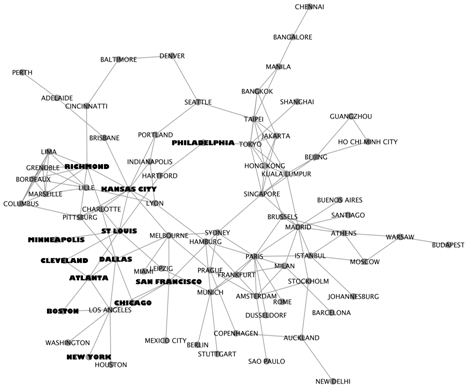
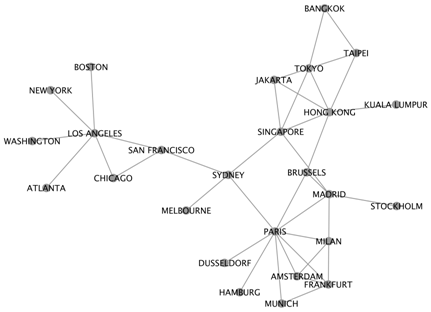
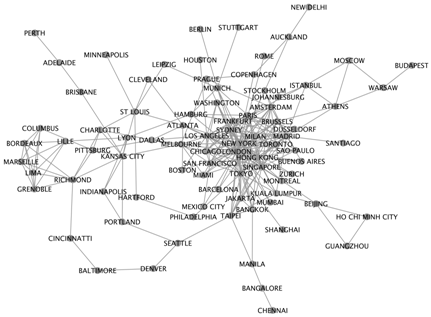
Returning to the case of NYLON serves to illustrate. In the GaWC11 data, the three parameters of the cumulative distribution function are: F = 100, CLONDON = 83, and CNYC = 74. Figure 1 illustrates the values of the cumulative distribution function for all possible values of X, and thus indicates the probability of observing an INM-estimated linkage between New York and London that is stronger than X, if the sorting process is random. This function highlights three features of the NYLON linkage. First, as noted earlier, there is a 100% probability that at least 57 firms must be co-located in New York and London, and thus the presence of 57 co-located firms does not provide any evidence of a nonrandom firms-into-cities sorting process. Second, there is about a 10.5% probability that, if the sorting process were random, the number of co-located firms would exceed the 63 co-locations actually present in the data. Because this probability does not cross the standard 5% or 1% thresholds for statistical significance, even the observed number of co-locations does not provide evidence of a nonrandom sorting process. Finally, there is a less than 5% probability of 65 or more co-locations arising from a random sorting process; only this large number of co-locations would provide statistically significant evidence that the NYLON linkage arose through a sorting process driven by nonrandom forces. Although this test indicates that the NYLON linkage is not statistically significant, it is important to be clear what this nonsignificant finding means. First, it does not imply the lack of a NYLON linkage; to do so would contradict decades of quantitative and qualitative evidence, as well as the brute force network presented above. Second, it does not imply that the NYLON linkage arose through firms being randomly sorted into cities. In the language of inferential statistics, a nonsignificant finding means that one merely fails to reject the null hypothesis (here, that the sorting process is random), but not that one can accept the null hypothesis. Thus, this finding simply indicates that the GaWC11 data does not provide evidence, at the 5% level of confidence, that the NYLON linkage arose through a nonrandom sorting process. By applying this statistical test to the INM-estimated linkage for each pair of cities, it is possible to identify the world city network formed through a nonrandom sorting process. The ONEMODE program written for Stata facilitates this analysis and can also be used to construct a world city network using the more traditional INM; it can be downloaded and installed by typing ‘ssc install onemode’ in the Stata command line. Figure 3 presents such a network, constructed using ONEMODE, where each linkage is significant at the a = 0.001 level. For visual clarity, a stringent a value is used and only the main component is shown; eight disconnected components, containing a total of 19 cities, have been omitted. This portrait of the world city network displays both notable similarities and differences when compared to the networks examined by others. It is similar to other networks in its depiction of geographically driven clusters (Friedmann 1986; Derudder, Taylor, Witlox, and Catalano 2003; Taylor 2004a). Specifically, paralleling Friedmann’s (1986) heuristic network in which “linkages make it possible to arrange world cities into a complex spatial hierarchy” by continent, here American cities are primarily clustered in the left half, Asian cities in the upper right, and European cities in the lower right (p. 71). Moreover, these continental clusters are connected by cities that have previously been identified as occupying bridging positions, including Seattle’s role as a ‘network city’ linking the US and Asia (Abbott 1992), and Singapore’s role as a `high connectivity gateway’ into Asia (Taylor, Walker, Catalano, and Hoyler 2002). In contrast, figure 3 is different from other networks in the relative absence or peripherality of cities typically viewed as central. For example, New York occupies a peripheral position connected only to Los Angeles, while London does not appear in the network at all. This highlights that in an INM-based framework for constructing world city networks, the connectivity of such large cities as New York and London comes more from their brute force than as the result of a nonrandom sorting process. The 12 cities hosting US Federal Reserve banks (bolded in figure 3) offer perhaps the clearest illustration of the difference between the brute force and sorting process perspectives. Federal Reserve banks have responsibility for implementing national monetary policy, controlling currency availability, processing paper (i.e. check) and electronic fund transfers, and regulating banks within their region. However, despite the critical role these banks play in the US, and by extension global, economy, fewer than half of the cities hosting a Federal Reserve bank appear in figure 1. Why? Although each of the cities selected for a Federal Reserve bank in 1914 was a major economic and population center, today several are relatively minor components of the US urban system. For example, Richmond, Virginia has a metropolitan population of less than 1.5 million, placing it 43rd in size, below such non-reserve cities as Los Angeles, Miami, and Phoenix. Similarly, following rust belt deindustrialization, the economies of reserve cities like Cleveland and St. Louis are hardly a portrait of global high finance. Such cities are easy to overlook from a brute force perspective on world city network formation because they lack the large firm populations of cities like New York. But, the sorting process perspective takes a different approach that highlights these cities’ importance. There may be little reason for a large number of advanced producer service firms to maintain offices in St. Louis. However, the presence of institutional resources like Federal Reserve banks can powerfully steer the process through which particular firms get sorted into particular cities: 5 of St. Louis’s 7 firms are accounting firms. When such a seemingly nonrandom sorting process is in operation, it can allow cities like St. Louis to forge linkages, despite their small size. For example, Kansas City is also a Federal Reserve city and hosts only 4 firms. However, 3 of these – Amsterdam-based KPMG, London-based RSM, and then-London-based Moores Rowland – are the same accounting firms found in St. Louis. The sorting process model recognizes that finding fully 75% of Kansas City’s advanced producer service firms also operating in St. Louis is highly improbable, and thus likely driven by nonrandom forces. Probing beyond what the statistical test itself can detect, this pattern appears even more improbable when it is noted that the three co-located firms are all Europe-based multinationals that have selected minor cities in the US Middle West to operate major branch offices. While the sorting process perspective does not specify what non-random forces might be responsible, at least in the case of St. Louis and Kansas City, one plausible hypothesis worth further investigation is that the Federal Reserve attracts the branch operations of global accounting firms to cities they might not otherwise consider important, and thus can help to explain this outcome. Combining PerspectivesNeither the brute force nor sorting process perspectives on world city network formation are ‘right.’ Instead, they provide different and potentially complementary understandings of how cities might come to participate in the network and of how the network is structured. Viewing these two perspectives, and the networks they imply, in relation to one another can serve to draw on the strengths of each. For example, the brute force perspective is best suited for understanding the top tier of world cities, but may provide somewhat less detail about more subtle linkages between synergistic pairs like St. Louis and Kansas City. In contrast, the sorting process perspective is ideal for looking beyond the obvious effects of cities’ sheer economic size, but can also yield some potentially misleading results, as when two small cities have a linkage that is statistically significant but practically insignificant (e.g. Grenoble, France and Lima, Peru). The intersection approach for combining these two perspectives into a composite world city network focuses on intercity linkages that formed through both brute force and a nonrandom sorting process. Figure 4 illustrates the intersection of the brute force (figure 1) and nonrandom sorting (figure 3) networks. For example, Hamburg and Paris are shown as connected in this network because they are connected in both the brute force network and the nonrandom sorting process network. In contrast, Boston and Atlanta are not shown as connected because, although they are connected in the nonrandom sorting process network, they are not also connected in the brute force network. The intersection approach yields a relatively skeletal network because it places a quite stringent requirement on cities participation: they must not only host a large total number of firms, but must also host a combination of specific firms that forges an improbably large number of co-locations with other cities. This portrait of the world city network essentially serves to highlight the “core of the core,” and thus the backbone of the network. It is striking that the regional dimensions of the world city network are still (and, perhaps, more) visible from this highly restrictive conception of an intercity linkage. The union approach to constructing a composite focuses on intercity linkages formed through either brute force and/or a nonrandom sorting process, and is illustrated in figure 5. For example, Boston and Atlanta are shown as connected in this network because, although they are not connected in the brute force network, they are connected in the nonrandom sorting process network. Because it includes cities that came to participate in the network through either mechanism, the union approach yields a network that is significantly more inclusive than the intersection approach. This image of the world city network essentially superimposes the brute force core of top-tier cities onto the sorting process periphery of more subordinate cities. In the union composite, although the continental clustering is still apparent, individual cities and the network’s overall center of gravity are shifted. For example, while most US cities remain in the US cluster on the left, a few key US cities including New York, Chicago, and Los Angeles are pulled into the core. Additionally, the core is positioned not at the center of the network, but rather between the European and Asian clusters and separated from the US cluster. Because such composite networks present new views of the world city network, their interpretation will require further analysis that goes beyond the scope of this paper. Nonetheless, these examples serve to illustrate that the brute force and sorting process perspectives can compliment one another, and how the networks they imply might be combined. Limitations and Future DirectionsThe limitations of the traditional INM, and by implication the brute force perspective it adopts, have been extensively discussed elsewhere (Nordlund 2004; Taylor 2004b; Neal 2012; Liu and Derudder 2012), thus I restrict my comments here to the newly proposed method for identifying intercity linkages arising from a nonrandom firms-into-cities sorting process. First, the statistical test proposed above is restricted to the context of traditional two-mode network data, which are binary. Thus, it cannot be directly applied to the original GaWC11 data, which indicate not only a firm’s presence/absence in a city, but also its level of importance. Although this potentially limits the utility of this method for GaWC data, it is a limitation common to most network analytic tools, which are also restricted to binary network data. Future work on this method may explore ways to extend it to the context of valued two-mode networks, while in the meantime, the robustness of findings obtained using this method may be assessed through sensitivity tests that replicate analyses using different dichotomization threshold values. Second, the cumulative distribution function presented above implicitly treats firms as interchangeable. It does not, for example, make any distinction between a large accounting firm like KMPG that maintains offices in 76 of the 315 cities, and a smaller accounting firm like Grant Thornton that maintains offices in only 9 of these cities. This is potentially problematic because observing a co-location of KPMG in a pair of cities is more likely than observing a co-location of Grant Thornton, and thus less indicative of a nonrandom sorting process. Future work may explore ways to differentially weight firms by their number of branch offices. However, the lack of such weights is not a limitation of this statistical test per se, but rather of the INM itself. The theory that informs the INM does not distinguish between firms, but instead simply views the co-location of any firm in a pair of cities as contributing to their network linkage. Thus, the proposed statistical test closely matches the existing theoretical foundations of the INM, which themselves may warrant revision. Finally, in the analysis above, the observed number of firms hosted by a city is used to define a city’s capacity to host firms (i.e. Ci) in the cumulative distribution function. This is merely a proxy based on available information because a city’s true capacity to host firms is unknown. The number of firms in a city at a given moment may exceed its underlying capacity to support them, in which case some of these firms would be expected to close or move their operations elsewhere. Similarly, a city’s actual number of firms may lie below its capacity, in which case firms might view the city as an underexploited market and a particularly attractive site for relocation. Future studies might explore methods for estimating a city’s true capacity to host firms’ branch offices based on a range of city characteristics including its current firm population, resident population, workforce skills, and so on. While a more refined measure of cities’ firm-hosting capacities would yield more accurate identification of significant intercity linkages, the statistical test proposed here and its underlying theoretical propositions remain the same. Looking beyond these primarily methodological limitations, the ability to identify intercity linkages formed through a nonrandom firms-into-cities sorting process opens a number of avenues for future research. Importantly, because the networks presented above are intended only to visually illustrate the proposed methodology, they reflect some coding decisions designed to maximize visual clarity, but which in practice should be guided by theory. For example, figure 1 shows only linkages between cities with at least 20% as many co-locations as observed between New York and London, while in practice a higher or lower threshold may be more appropriate. Similarly, figure 3 shows only linkages that are statistically significant at the stringent a = 0.001, while in practice the more liberal 0.05 or 0.01 levels may be more appropriate. Such coding decisions do not impact the underlying methods, but because they do impact the structure of the networks created by these methods, these figures should not be used to draw substantive conclusions about the world city network without further verification. However, sensitivity tests suggest that the limited interpretations offered here are relatively robust. For example, the core-periphery structure observed in the brute force network persists when other dichotomization thresholds are used, and the regional clustering observed in the sorting process network persists when other a levels are used. Allowing theory to guide applications of the methods presented here, future studies should consider the economic and political consequences of cities’ positions within a network arising from a nonrandom sorting process compared to one arising from cities’ brute economic force. Additionally, the figures presented above describe the cross-sectional structure of several world city networks in 2000. But, the brute force network evolves as cities’ economic sizes change, while the sorting process network evolves as firms are continually re-sorted into cities through their expansions and relocations. Thus, future studies should also consider the dynamics of these different perspectives on world city network formation. The proposed method for identifying statistically significant intercity linkages is particularly attractive for studying network dynamics because it offers a principled way of obtaining a binary network, which most dynamic network modeling techniques require. conclusionThis paper has aimed to offer a perspective on world city network formation that complements the perspective adopted by the traditional Interlocking Network Model, which typically highlights cities’ network participation through their brute economic force. This refinement builds on the INM’s basic theoretical foundation by considering how the complex process through which firms are sorted into cities impacts intercity linkage formation. The central contribution is a new statistical test and associated computer program, ONEMODE, that permit the identification of intercity linkages forged by a nonrandom firms-into-cities sorting process. Exhibiting both similarities and differences, the brute force network constructed using the traditional INM and the sorting process network constructed using the proposed method provide complementary views of the world city network, with the former privileging large and dominant cities and the latter highlighting the role of specific firm combinations in cities. Moreover, these two perspectives can be combined in various ways to obtain more comprehensive and multifaceted understandings of the world city network. Figure 1: World City Network formed through Brute Force
Figure 2: Cumulative Probability Distribution for New York–London Linkage
Figure 3: World City Network formed by a Nonrandom Sorting Process
Figure 4: Intersection Composite: Both Brute Force and Nonrandom Sorting
Figure 5: Union Composite: Either Brute Force or Nonrandom Sorting
REFERENCESAbbott, C. 1992. Regional city and network city: Portland and Seattle in the twentieth century. Western Historical Quarterly, 23, 293-322. Alderson, A. S., Beckfield, J. 2004. Power and position in the world city system, American Journal of Sociology, 109, 811-51. Beaverstock, J. V., Taylor, P. J., Smith, R. G. 1999. A roster of world cities, Cities, 16, 445-458. Beaverstock, J. V., Doel, M. A., Hubbard, P. J., Taylor, P. J. 2002. Attending to the world: competition, cooperation, and connectivity in the world city network, Global Networks, 2, 111-132. Breiger, R. 1974. The duality of persons and groups, Social Forces, 53, 181-190. Carroll, G. R., Hannan, M. T. 1989. Density dependence in the evolution of populations of newspaper organizations. American Sociological Review, 54, 524-541. Derudder, B., Taylor, P. 2005. The cliquishness of world cities, Global Networks, 5, 71-91. Derudder, B., Taylor, P., Witlox, F., Catalano, G. 2003. Hierarchical tendencies and regional patterns in the world city network: a global urban analysis of 234 cities. Regional Studies, 37, 875-886. Friedmann, J. 1986. The world city hypothesis, Development and Change, 17, 69-83. Lai, Karen. 2012. Differentiated markets: Shanghai, Beijing, and Hong Kong in China’s Financial Centre Network, Urban Studies, 49, 1275-1296. Latapy, M., Magnien, C., Del Vecchio, N. 2008. Basic notions for the analysis of large two-mode networks, Social Networks, 30, 31-48. Liu, X., Derudder, B. 2012. Two-mode networks and the interlocking world city network model: A reply to Neal. Geographical Analysis, 44, 171-173. Liu, X., Taylor, P. 2011. Research note – A robustness assessment of global city network connectivity rankings, Urban Geography, 32, 1227-1237. Neal, Z. 2008. The duality of world cities and firms: comparing networks, hierarchies, and inequalities in the global economy, Global Networks, 8, 94-115. Neal, Z. 2012. Structural determinism in the interlocking world city network, Geographical Analysis, 44, 162-170. Nordlund, C. 2004. A critical comment on the Taylor approach for measuring world city interlock linkages, Geographical Analysis, 36, 290-296. Sassen, S. 2001. The Global City: New York, London, Tokyo. Princeton, NJ: Princeton University Press. Schelling, T. C. 1971. Dynamic models of segregation. Journal of Mathematical Sociology, 1, 143-186. Smith, D. A., Timberlake, M. F. 1995. Conceptualising and Mapping the Structure of the World System’s City System, Urban Studies, 32, 287-302. Taylor, P. J. 2001. Specification of the world city network, Geographical Analysis, 33, 181-94. Taylor, P. J. 2004a. Regionality in the world city network. International Social Science Journal, 56, 361-372. Taylor, P. J. 2004b. Reply to Nordlund. Geographical Analysis, 36, 297-298. Taylor, P. J., Catalano, G., Walker, D. R. F. 2002. Measurement of the World City Network, Urban Studies, 39, 2367-2376. Taylor, P. J., Walker, D. R. F., Catalano, G., Hoyler, M. 2002. Diversity and power in the world city network. Cities, 19, 231-241. Tiebout, C. M. 1956. A pure theory of local expenditures. Journal of Political Economy, 64, 416-424.
NOTES* Zachary Neal, Department of Sociology, Michigan State University, email: zpneal@msu.edu 1. In most cases, the formula for computing the strength of the linkage between two cities, i and j, is given as:
2. Notably, the correlation between these two networks is much higher (r = 0.98) if the original, valued GaWC11 data is used instead. Thus, in a network generated from the valued firm location data, which has been the standard approach in past research, more than 96% of the variation in INM-estimated linkages is driven by cities’ economic size. 3. This test is one-tailed, identifying the probability that an INM-estimated linkage is stronger than X, and thus identifying city pairs between which a non-random sorting process has forged an improbably strong connection. However, the same distribution function can also be used to identify the probability that an INM-estimated linkage is weaker than X, and thus to identify city pairs between which a non-random sorting process has an improbably weak connection.
Note: This Research Bulletin has been published in Urban Studies, 50 (6), (2013), 1277-1291 |
||