GaWC Research Bulletin 392 |
|
|
|
This Research Bulletin has been published in Transactions of the Institute of British Geographers, 38 (3), (2013), 497-511. doi:10.1111/j.1475-5661.2012.00545.x Please refer to the published version when quoting the paper
IntroductionGeography has a long tradition of dividing up the world into regions for both imperial and pedagogic ends. Such world regions continue to be a key feature of geographical textbooks. However apart from Lewis and Wigen’s (1997) assault on the anachronistic continuous use of ‘continents’ to frame global conversations, there appears to have been little critical thought applied to world regionalization within contemporary globalization. John Agnew (2012, 2) has recently suggested a reason for this: he posits a curious paradox that contemporary globalization has been accompanied by ‘the declining relevance of regional schemas at that scale’. Agnew is certainly correct in pointing out that studies of regions in globalization have focused upon the ‘meso scale regions’ based upon cities (e.g. Scott 1998; Amin 2004; Florida 2008) but this should not preclude investigating regionalization at the global scale itself. Thus we doubt the veracity of Agnew’s paradox and this paper addresses this lacuna in the literature by focusing on selected key agents who facilitate the reproduction of globalization, specifically advanced producer service firms and their worldwide networking activities. In carrying out their everyday work, many of these firms have devised global strategies through which new regional formations are being constructed. We uncover these regional structures and interpret them as a very different form of spatial organization than has been previously identified as world regions. As part of the Globalization and World Cities (GaWC) research programme (www.lboro.ac.uk/gawc) we have been monitoring the world city network since 1998. One robust feature of our analyses stands out. The results always show strong regional patterns of cities within different statistical analyses whether using principal components analysis (Taylor and Walker 2001; Taylor et al 2002b; Taylor 2011), multidimensional scaling (Taylor et al 2001), discriminant analysis (Taylor 2004a), or fuzzy set analysis (Derudder et al 2003). This particular economic globalization process world city network formation - does not support stories about a blanket-effect of global processes such as Friedman’s (2005) ‘flat world’; but neither does it support Florida’s (2008) ‘spiky world’ riposte to Friedman. Rather, the latter world is far more globally ordered than Florida’s study proposes: our results show new world regional geographies being created to satisfy different service provisioning. In this paper we present the regional results from our latest data on the world city network for 2010. A combination of improvement in data collection and a maturing of the global processes we are measuring have enabled us to produce our most sophisticated regional geography of globalization thus far. The regional geographies we describe are the antithesis of the traditional regional depictions by geographers and others imperiously trying to order their subject matter into meaningful organization of world-space. Rather, by studying economic agents who are creating global regional patterns in the conduct of their businesses we are we are revealing regionalization derived from the work of doing globalization. Obviously the firms we study are not necessarily bent on devising regional schemes but they do partake in location decision-making through which regional patterns can be discerned. Leading advanced producer service firms have reacted to, and contributed to, economic globalization through their location decisions on placing offices to service clients in cities across the world. Spatially they are network-makers rather than region-builders, but their creation of a world city network for servicing global capital inevitably reflects uneven market geographies for their services, and firms' world-regional origins. The result is a world regional geography as practised by leading advanced producer service firms. Our practical world-regional approach chimes with ongoing debates around the nature of regional process at other scales as pioneered by Doreen Massey (1979; 1993; Allen et al 1998) and Anssi Paasi (1986); Agnew (2012) provides the
latest review of the key issues. Past empirical concern for regional delimitation,
largely based upon equating regionalization with classification, has produced
regional patterns neatly demarcated as a simple, mosaic geography. It is this
traditional focus on absolute boundaries that has come to be challenged by
relational approaches (see Harrison 2008; Jonas 2012), which Amin (2004)
refers to as ‘regions unbound’. The inherent messiness of our dynamic world is
becoming recognised and respected, and we follow this turnabout in
identification of ‘world regions unbound’. However we are cognisant of the need
to balance flows/relations with places/fixities (Paasi 2004, 542; Jones 2009,
488). Specifically, in using Castells’ (1996) social space constructs, we expect
boundaries to be both fuzzy from a ‘spaces of places’ perspective and to be
porous from a ‘spaces of flows’ perspective. These expectations are broadly in
line with the deal of overlapping that we have found in all our previous global
regional geographies. In our more refined latest results this overlapping requires To understand this unforeseen degree of overlap we have devised a customised regional framework consisting of two operational realms: home-region and global-outreach. Typically, the agents of the regionalization, advanced producer service firms, have a regional concentration of servicing provision relating to their region of origin and headquarter location, plus a dispersed worldwide distribution of service provision marking their globalizing strategy. To describe this home and away' geography we introduce the following definitions.
The prime purpose of this paper is to develop empirical definitions of these concepts and illustrate their formation in 2010. Before we give empirical life to these constructs and illustrate them through our new results we need to specify the model we are using and describe the consequent data collection, and we have to outline and justify the analytical techniques we employ to generate our regionalization. World City Network FormationThe research we report is based upon an extension of Saskia Sassen's (1991) concept of the global city. She argued that there were a select number of cities which were strongly associated with contemporary globalization through their development of advanced producer services (APS) by firms offering customised financial, professional and creative expertise to corporate clients. As the latter globalised so also did the firms servicing them in areas such as commercial law, wealth management, corporate tax advice and advertising. The result was that global cities became simultaneously markets for these services through corporate presences, and production centres of these services through innovative knowledge clusters. Sassen treated London, New York and Tokyo as archetypal global cities and indicated that there were about twenty such cities in the world economy servicing global capital. It was through the expertise of APS firms in transnational servicing of their clients that global cities became seen as the organizing nodes of economic globalization. We accept Sassen's identification of APS firms at the cutting edge of the world economy through enabling transnational commerce and production but we extend the argument beyond just a small number of select cities. Typically, leading APS firms operate through office networks across a large number of cities, often scores in the case of law firms, sometimes hundreds in the case of advertising agencies, and even thousands of cities with the big accountancy firms. Thus we have moved away from an emphasis on a few nodes as global cities' to focus on the network relations of many more cities in the servicing of global capital. This is specified as a world city network that takes the form of an interlocking network model (Taylor 2001). An interlocking network has an unusual network structure consisting of three rather than two levels. In most network analysis there are nodes (e.g. members of a gang) whose interactions generate a network (e.g. a gang). In such cases the nodes are the agents in the process of network formation: their inter-relations define the network. In an interlocking model the network-making agents are not the nodes but are to be found within the nodes thus producing three levels of operation: sub-nodal, nodal and net. In our analyses the APS firms constitute the sub-nodal; they interlock' cities through their everyday servicing work. It is the flows of information, knowledge, direction and advice in planning and strategic work for clients across firms' offices that create worldwide inter-city relations. These can be electronic messages, telephone conferences, face-to-face meeting through expert travel that together, across myriad APS firms, have generated a world city network. The key point is that cities are the service centres (nodes) in this model but they are not the agents: world city network formation is the work of APS firms. This model is operationalized through collecting data on the office networks of APS firms (Taylor et al. 2002a). These data are readily available on firms' websites where they promote their global' status as a means of both impressing clients in a competitive services market and recruiting graduates in a competitive jobs market. However this source, plus supplementary information as available, produces different levels and types of information for every firm. Thus the data have to be converted into simple coding to enable cross-firm comparison for analysis. We have found that a coding from 0 to 5 has served this purpose; such numbers are called service values and measure the importance of a given city in a given firm's office network. Thus, 0 indicates a city where a firm has no presence, 5 is the firm's headquarter city. Codes 1 to 4 are then allocated as follows: a typical office of a firm scores a city 2, there must be something deficient to lower to 1, and something extra to rise above 2. For the latter an especially large office scores 3, an office with extra-city jurisdictions (e.g. regional HQ) scores 4. Each firm is assessed individually to make boundary decisions away from 2. With n firms and m cities, such data collection creates an n firms x m cities service values matrix, the basic raw material for interlocking network analysis. Each column of the matrix shows a firm's location strategy as a string of 0s to 5 across m cities; each row shows a city's service mix as a string of 0s to 5s across n firms. Such data have been collected for 2000, 2004, 2008 and 2010; it is the latter data we analyse below. In this case n = 175 composed of 75 financial services firms and 25 each of accountancy, advertising, law and management consultancy firms. Firms were chosen using trade information ranking firms by size based upon the latest information available (e.g. on turnover) before the data collection (i.e. for 2009). In earlier data collection (2000, 2004) we only included firms having a global strategy through having offices in the USA, Europe and Pacific Asia, which we called global service firms. This approach was changed with the 2008 data for technical reasons as given in Derudder et al. (2010) and has been continued for 2010 data. This decision to change choice of firms from global reach to simply size is particularly apposite for the current study because it avoids circular reasoning: we would have been arguing that specifically selected global service firms were creating global-reach. Instead it is large firms in general, not selected for any location trait, that we have found to be generating global-reach beyond their home-regions. The choice of cities is more straightforward. Cities were chosen on the basis of previous experience in this work (315 cities used for collecting the 2000 and 2004 data) plus all cities with more than 2 million population, all capital cities of countries with over one million population, and all cities recording a headquarters of one of our firms. These are arbitrary rules of inclusion but our aim was simply to include more cities than necessary so as not to exclude any cities that might surprise us in what is a rapidly changing process of world city network formation. The end result is a 175 firms x 526 cities services values matrix for 2010. There are two different approaches to analysing such data (Taylor 2004b). One approach is to convert the service values matrix into a city x city matrix and carry out network analyses on inter-city relations to measure network connectivities. The other approach analyses the service values matrix directly in order to find structural patterns in the data (Liu and Derudder 2012). In this paper we do the latter using principal components analysis as our method of choice. Principal components analysis (PCA) is a means of data reduction; it reduces a large data matrix into a smaller one by combining like-variables into new common variables called components. In applying this technique to a service values matrix, the firms' location strategies are the variables and therefore the components represent common location strategies constituted by groups of firms with similar office network geographies across cities. In large data sets there will always be firms with particular location strategies like no others; these will not feature in any of the common strategies. Thus a PCA interpretation will always divide the data into two parts: that identified as common (like-strategies), and the part constituted by specific (idiosyncratic) strategies. The idea is to focus on the former in the hope that just a few components account for a sizeable proportion of the variation in the data matrix. Thus PCA is a tool of parsimony that excavates common patterns within multifarious data sets, in this case common strategies from amongst the office networks of 175 leading APS firms. There are three key pieces of information produced in the analysis:
For the 2010 analysis we used 138 cities, inclusion being restricted to cities having presences of at least thirty-five of our 175 leading firms. A varimax rotation was employed to ensure clearly defined components called ‘simple structure’ (Rummel 1970, 376-81). Ten components have been extracted from the data defining ten distinctive location strategies. This reduction from 175 firms’ individual strategies to 10 common strategies incorporates slightly under 55% of the initial data variance. Statistically, this represents a very good reductive outcome. We interpret the ten common location strategies as world regional geographies. Common Global Strategies as Regional Geographies in 2010In terms of the amount of data variance they incorporate, the components fall into three groups:
These three levels of importance should be kept in mind in descriptions of
components below but we choose to organize our discussion in more Before describing the results there is a new feature in addition to the PCA, one that enhances interpretations compared to previous studies of service values matrices. Here we introduce an additional geography. As well as the component scores on the cities providing the usual geography of the servicing for each common strategy, there is a second geography: we have added the geography of the decision making that has produced the strategy. This is derived from the headquarter locations of the firms that contribute to a given component. Weighted by their loadings and summed to cities, these provide a measure of the headquarter functions behind each common strategy. Those cities measuring 0.5 or over on this summation are designated command cities and these have been identified for all ten common strategies in Table 1. Table 1 Command cities for each common strategy
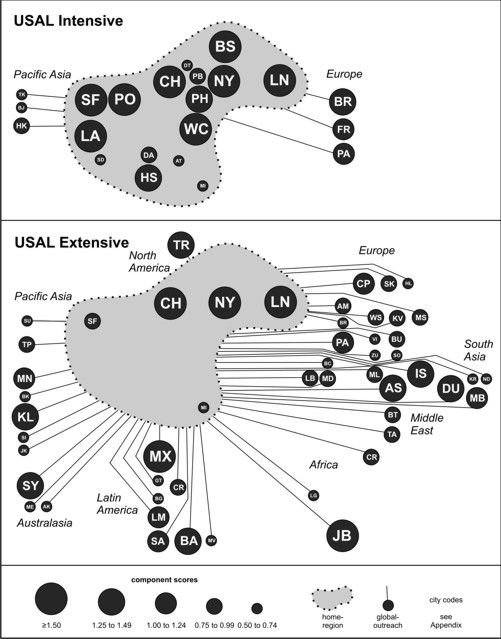
USAL Strategies: Intensive and Extensive GlobalizationsThe combination of US cities and London has been central to the construction of economic globalization and its current crisis (Wójcik 2011). We have united them in our interpretation the home-region of the two most important components because London has a component score and a HQ sum of over 1.5, like New York and Chicago, in both location strategies. Such dual instances are rare: there are only four other examples in the rest of the analyses all denoting the key cities in a home-region (Tokyo and Beijing in Pacific Asia, and Sydney and Toronto in their respective Commonwealth components). USAL is the home-region for these two components that account for over 20% of the variance in the data between them. Their service geographies are given in Figures 1a and 1b. Note that it is London alone and not UK cities in general that feature in these figures. That this north Atlantic connection, a long-term central link of the world economy, defines the home-region for today’s most important common strategies is in keeping with the Americanization of the mid-twentieth century being the precursor of globalization in the late twentieth century. This is because London was integral to this process: in hindsight we can see that the City of London invention of the Eurodollar market in 1957 (Burn 2000; Kynaston 2011) was a true pioneer of contemporary globalization with London’s deregulation - ‘big bang’ - in 1986 consolidating the process. The key features of the USAL intensive globalization strategy are as follows.
Labelling of this strategy as intensive globalization is spatially derived from a combination of service concentration in the USAL home-region plus targeted selectivity in global-outreach. The key features of the USAL extensive globalization strategy are as follows.
Labelling of this strategy as extensive globalization is spatially derived as the obverse of intensive globalization from a combination of targeted service concentration in the USAL home-region plus comprehensive coverage in global-outreach. Identification of contrasting intensive and extensive globalizations has been previously made using dyad analyses with the 2008 service values data matrix (Taylor et al. 2011); as well as confirming this interesting finding, the present analysis has located London at the centre of these processes. Clearly the ‘home’ of contemporary globalization, USAL, has been the locus for generating these two distinctive globalization strategies. It seems that even the globalization emanating from the economic heartland of the world economy refutes any notion that there is a single global process homogenizing the world. Figure 1 USAL globalization strategies
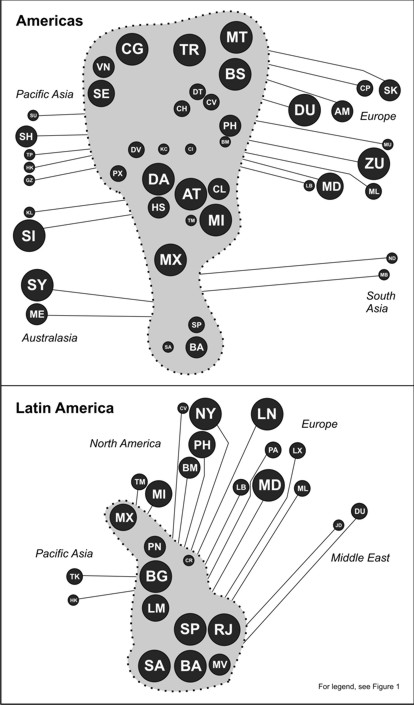
City codes are given in Appendix American Strategies: Regional and Inter-regional GeographiesThe components centred on USAL are not the only common strategies emanating from US command and service provision: there is an additional strategy that encompasses other parts of the Americas and a minor strategy that emanates from Latin America. The key features of the Americas common strategy are as follows.
Labelling of this strategy as Americas is spatially derived from the inclusion of both Canadian and Latin American cities in the home-region. The key features of the smaller and more specific Latin American common strategy are as follows.
The addition of these American common strategies to the USAL strategies illustrates the complexity of this practical regional geographical exercise with its extreme excluded US cities and the different uses of New York and London. But all this is in keeping with the USA role in generating and promoting economic globalization. However, there are more common strategies not including the USA as part of a home-region, six out of ten, showing that globalization is geographically so much more than earlier Americanization of the world economy. Figure 2 Americas strategies
City codes are given in Appendix Asian Strategies: Dual Roles for Chinese CitiesSpinning around to the other side of the globe there are two intriguing common
strategies that are even more contrasting than those of the previous discussions.
The Pacific Asia component is a well-established common strategy and has
featured in all earlier analyses of service values matrices. In contrast, this is the
first PCA that has identified a specific China strategy. Studies of network
connectivity have shown the increasing importance of Chinese cities, specifically
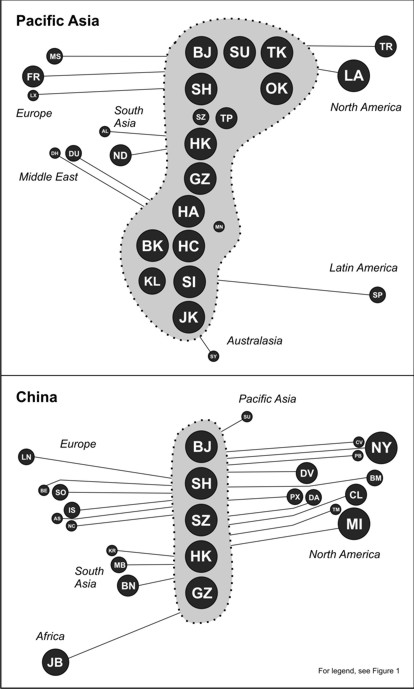
Beijing and Shanghai in 2004 (Taylor and Aranya 2008) and in 2008 (Derudder The key features of the Pacific Asia common strategy are as follows.
The key features of the smaller and more specific China common strategy are as follows.
Clearly a very distinctive servicing geography, it appears to reflect Chinese overseas past, present and possible future investments. The discovery of this Chinese common strategy in 2010 is an intriguing finding that may well portend a much more important strategy in future world city network development. This is a clear case of overlapping regions since all the Chinese cities are featured in the Pacific Asia home-region while also constituting their own home-region. By carving out its own strategic geography of home-region and global-reach, this suggests that China is not simply another Pacific Asian ‘development state’ to come to the fore in a globalising world economy. Neither is it simply a rival to Japan in the Pacific Asian regional-economy; rather it represents a new intervention in the world city network that transcends Pacific Asia perhaps even suggesting a possible future rival of USAL. Figure 3 Asia strategies
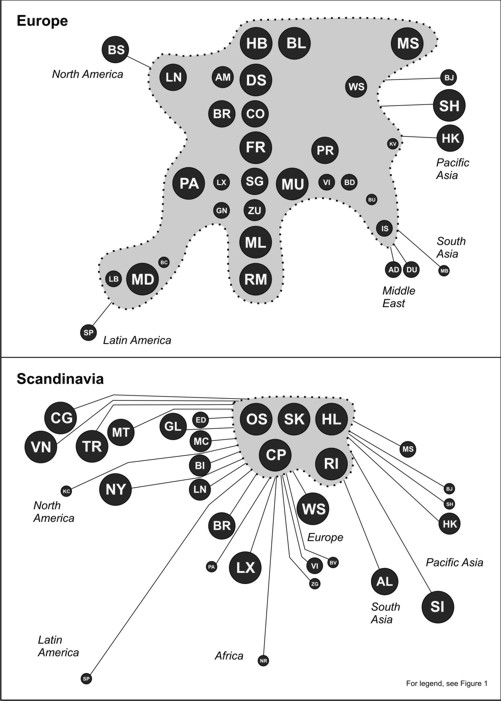
City codes are given in Appendix European Strategies: Mainstream and PeripheralBack in the traditional centre of the world economy, indeed its initial core zone, Europe is represented by two common strategies. However they are not as might be predicted. In general, there are two familiar regional divisions of Europe: an East-West contrast that historically culminated in the Cold War division; and an equally old North-South division, the Mediterranean world and beyond the Alps. Both of these divisions have been based upon roughly equal parts of Europe. Not so our identification of contemporary global strategies wherein the two home-regions are of very different magnitudes as reflected in their labels: an almost inclusive Europe strategy and a small northern Scandinavian strategy. The key features of the Europe common strategy are as follows.
The key features of the small Scandinavian common strategy are as follows.
This really is an intriguing common strategy labelled for its home-region but the label also being meaningfully reflected in a distinctive global-reach (see also Schmitt and Smas 2012). It is not entirely clear why these two different strategies have developed in Europe. Although there is some overlap, it is the separation between the service maps that are most striking: the European strategy misses out Scandinavian cities and the Scandinavia strategy misses out German and southern European cities. Figure 4 Europe strategies
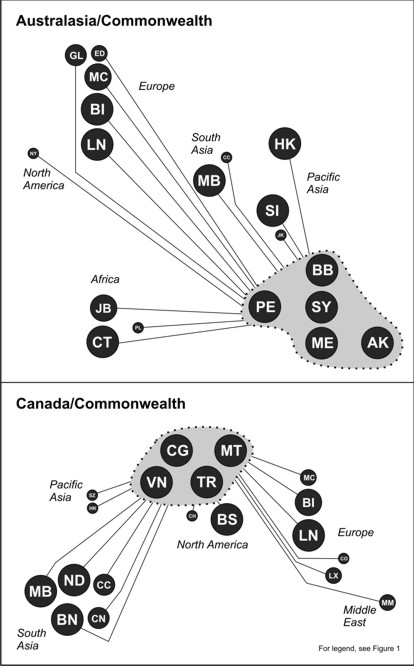
City codes are given in Appendix Alternative Commonwealth StrategiesOne of the surprises in the initial analyses of service values matrices was the appearance of a Commonwealth component (Taylor et al. 2002a). Not generally associated with business services, this political relict of British imperialism does actually incorporate continuing cultural links that are reflected in early internationalizing business strategies now enveloped by contemporary globalization. In this latest analysis, we find two Commonwealth strategies associated with erstwhile British dominions at opposite ends of the Earth. Both common strategies are minor ones (Table 1) but still interesting in their expression of historical connections. The key features of the Australasia/Commonwealth common strategy are as follows.
For an Australasia strategy, the surprise is no major presence of Pacific Asian cities beyond ex-British Singapore and Hong Kong. The key features of the Canada/Commonwealth common strategy are as follows.
Having Commonwealth common strategies still seems surprising, even more so in 2010 through discovering two quite distinct examples. This provides a reminder that business location strategy is never a simple matter of economic advantage, other connections have roles to play in constructing economic opportunities to respond to. Figure 5 Commonwealth strategies
City codes are given in Appendix Comparative GeographyThe method of paired comparisons is particularly insightful for the 2010 PCA
results but there are additional things to be said using overall comparisons
across the ten common strategies. Table 2 has been constructed for this task. For
each common strategy cities are divided between home-region and global-outreach
and their scores compared. In addition for the home-regions, the total
number of cities is given to show the degree to which each location strategy is
inclusive of its home-regional cities. However the main purpose of this table is to The first point to make is that if we were ever tempted to interpret global-outreach
as a minor geographical add-on to an otherwise traditional regional
formation, the final column of Table 2 sets us right: global-outreach contributes more servicing than home-region in a majority of the common strategies. Even
the lowest proportion of servicing for global-outreach is nearly 15%, which is by
no means insignificant. Looking at the range of values, the three lowest
percentages for global-outreach represent what have been identified as the key ‘globalization arenas’ in the making of a globalizing world (USAL intensive,
Pacific Asia, Europe) (Taylor 2004b). These are regions with their own major
advanced producer service firms strongly ensconced in their own important
world arena. In contrast the highest percentages for global-outreach are largely
for strategies from smaller home-regions: the two Commonwealth strategies and
Scandinavia. However, there is one major exception: the second largest
percentage of servicing from the global-outreach is for USAL extensive; this is a Conversely we should not under-value the home-region in these globalization
strategies: for all common strategies the average service value for home-region
cities is larger than for global-reach cities. This is particularly the case for the
four smallest home-regions where all cities provide high levels of service. Thus
overall the message of these comparisons is to confirm the importance of both
home-region and global-outreach. Between them they constitute integrated
spatial organizations that divide globalization processes into a new regional Table 2 Geographical comparisons between common strategies
Concluding DiscussionWe began this paper by relating our world regional geography to moves towards more fuzzy and messy tendencies in discussions and analyses of regions that have mainly dealt with regions at sub-national scales. We have taken the spirit of such ideas forward to create a very fuzzy and messy worldwide regional analysis. The starting point of this concluding discussion is to note just how unusual it is to be so messy in global regional depictions. Dividing up the world has been a supremely territorialist endeavour with strong political overtones starting with early imperialist and strategic geographies before later statistical analyses of states such as Russett’s (1967) regionalization based on UN votes. But descriptions of economic patterns have been equally territorialist and statebased led by the UN’s ubiquitous statistical analyses identification of categories of ‘development’. And of course, undergirding much of this work there has been a continuing production of world geography texts based upon regionalizations that usually combine economic, cultural and environmental considerations. More recently, this regional tradition has been reinterpreted by Lewis and Wigen (1997): in their more ‘refined world regional scheme’ (pp. 186-7) they identify 14 world regions, eschewing states as building blocks, and with pointers to some internal differences. But the end result remains resolutely territorialist, a world of definitive boundaries emphasizing the differences between peoples. It is this Hartshornian legacy of areal differentiation transposed to global differentiation that can be harnessed to political ends as in Huntington’s (1993, 1996) infamous ‘clash of civilizations’. He proposes an equally ‘refined’ and quite subtle regionalization with ‘in-between’ categories but the message is a basic ‘territory equals conflict’ argument, founded on realist International Relations. We are sorely in need of non-territorialist world regionalizations based upon connections rather than divisions. This is what our world regional geography as practised by advanced producer service firms provides. To say that our regionalization is something completely different is quite an
understatement: we replace neat territorialism with untidy connections.
Regional labels are provided by home-regions, but the subsequent regional
content always includes an outreaching global pattern of important cities. In
addition there is much overlap, not at the ‘edges’ as in territorial thinking, but
right at the centre across the home-regions themselves. This is the basis of our
regional interpretations of the tenfold regionalization presented in pairs: USAL One final point needs to be made: we have created our regional geography in the
spirit of Agnew’s (2012, 10) multiple ‘regional logics’ rather than proposing a ‘singular logic’. We have provided a messy regionalization based upon just one
set of globalizing agents, leading APS firms. Following Sassen (1991), this is
justified by the importance of this economic sector in economic globalization
through these firms’ strategic uses of cities. Thus we can interpret our
regionalization as a basic structure of the contemporary world economy, but REFERENCESAgnew J A 2012 Arguing with regions Regional Studies iFirst 1-12 doi:10.1080/00343404.2012.676738 Allen J, Massey D and Cochrane A 1998 Rethinking the region Routledge, London Burn G 2000 The state, the City and the Euromarkets Review of International Political Economy 6 225-61 Castells M 1996 The rise of the network society Blackwell, Oxford Coe N M, Hess M, Yeung H W-c, Dicken P and Henderson J 2004 Globalizing’ regional development: a global production networks perspective Transactions of the Institute of British Geographers 29 468-84 Derudder B, Taylor P J, Ni P. Vos A de, Hoyler M, Hanssens H, Bassens D, Huang J Witlox F, Shen W and Yang X 2010 Pathways of change: shifting connectivities in the world city network, 2000-08 Urban Studies 47 1861-77 Derudder B, Taylor P J, Witlox F and Catalano G 2003 Hierarchical tendencies and regional patterns in the world city network: a global urban analysis of 234 cities Regional Studies 37 875-96 Florida R 2008 Who’s your city? Basic Books, New York Friedman T L (2005) The world is flat Farrar, Straus and Giroux, New York Hanssens H, Derudder B, Taylor P J, Hoyler M, Ni P, Huang J, Yang X and Witlox F 2011 The changing geography of globalized service provision, 2000- 2008 The Service Industries Journal 31 2293-307 Harrison J 2008 The region in political economy Geography Compass 2 814-30 Huntington S 1993 The clash of civilizations? Foreign Affairs 72 23-49 Huntington S 1996 The clash of civilizations and the remaking of world order Simon and Schuster, New York Jonas A 2012 Region and place: regionalism in question Progress in Human Geography 36 263-72 Jones M 2009 Phase space: geography, relational thinking, and beyond Progress in Human Geography 33 487-506 Kynaston D 2011 City of London: the history Chatto & Windus, London Lewis M W and Wigen K E 1997 The myth of continents University of California Press, Berkeley, CA Liu X and Derudder B 2012 Two-mode networks and the interlocking world city network model: a reply to Neal Geographical Analysis 44 171-3 Massey D 1979 In what sense a regional problem? Regional Studies 13 233-43 Massey D 1993 Power-geometry and a progressive sense of place in Bird J, Curtis B, Putnam T, Robertson G and Tickner L eds Mapping the futures: local cultures, global change Routledge, London 60-70 Paasi A (1986) The institutionalization of regions: a theoretical framework for understanding the emergence of regions and the constitution of regional identity Fennia 164 105-46 Paasi A 2004 Place and region: looking through the prism of scale Progress in Human Geography 28 536-46 Robinson, J 2002 Global and world cities: a view from off the map International Journal of Urban and Regional Research 26, 531-54 Rummel R J 1970 Applied factor analysis Northwestern University Press, Evanston Russett B M 1967 International regions and the international system Rand McNally, Chicago Sassen S (1991) The global city Princeton University Press, Princeton, NJ Schmitt P and Smas L 2012 Nordic ‘intercity connectivities’ in a multi-scalar perspective Nordregio Working Paper 2012:7 Nordregio, Stockholm (http://www.nordregio.se) Accessed 22 June 2012 Scott A J 1998 Regions and the world economy Oxford University Press, Oxford Taylor P J 2001 Specification of the world city network Geographical Analysis 33 181-94 Taylor P J , 2004a Regionality in the world city network International Social Science Journal 181, 361-72 Taylor P J 2004b World city network: a global urban analysis Routledge. London Taylor P J 2011 Advanced producer services in the world economy in Taylor P J, Ni P, Hoyler M, Huang J and Witlox F eds Global urban analysis: a survey of cities in globalization Earthscan, London 22-39 Taylor P J and Aranya R 2008 A global urban roller coaster? Connectivity changes in the world city network, 2000-2004 Regional Studies 42 1-16 Taylor P J, Catalano G, Walker D R F 2002a Measurement of the world city network Urban Studies 39 2367-76 Taylor P J, Catalano G, Walker D R F 2002b Exploratory analysis of the world city network Urban Studies 39 2377-94 Taylor P J, Hoyler M, Walker D R F and Szegner M J 2001 A new mapping of the world for the new millennium The Geographical Journal 167 213-22 Taylor P J, Hoyler M, Pain K and Vinciguerra S 2011 Extensive and intensive globalizations: explicating the low connectivity puzzle of US cities using a city-dyad analysis GaWC Research Bulletin 369 Taylor P J and Walker D R F 2001 World cities: a first multivariate analysis of their service complexes Urban Studies 38, 23-47 Wójcik D 2011 The dark side of NY-LON: financial centres and the global financial crisis Working Papers in Employment, Work and Finance 11-12 School of Geography and the Environment, Oxford University (http://ssrn.com/abstract=1890644) Accessed 28 November 2011 Appendix: City Codes for Figures
NOTES* Peter J. Taylor, School of the Built and Natural Environment, Northumbria University, Newcastle, UK; Email: crogfam@yahoo.com ** Ben Derudder, School of Geography and Environmental Science, Monash University, Clayton, Australia; Email: ben.derudder@ugent.be *** Michael Hoyler, Department of Geography, Loughborough University, UK; Email: m.hoyler@lboro.ac.uk **** Pengfei Ni, Chinese Academy of Social Sciences, Beijing, China; Email: csjzl2009@163.com
Note: This Research Bulletin has been published in Transactions of the Institute of British Geographers, 38 (3), (2013), 497-511 |
||||||||||||||||||||||||||||||||||||||||||||||||||||||||||||||||||||||||||||||||||||||||||||||||||||||||||||||||||||||||||||||||||||||||||||||||||||||||||||||||||||||||||||||||||||||||||||||||||||||||||||||||||||||||||||||||||||||||||||||||||||||||||||||||||||||||||||||||||||||||||||||||||||||||||||||||||||||||||||||||||||||||||||||||||||||||||||||||||||||||||||||||||||||||||||||||||||||||||||||||||||||||||||||||||||||||||||||||||||||||||||||||||||||||||||||||||||||||||||||||||||||||||||||||||||||||||||||||||||||||||||||||||||||||||||||||||||||||||||||||||||||||||||||||||||||