GaWC Research Bulletin 374 |
|
|
|
This Research Bulletin has been published in Journal of Knowledge Globalization, 3 (1), (2010), 2-30. Please refer to the published version when quoting the paper.
IntroductionImpacts of globalization are widespread across different fields of research and practice. International co-authorships in almost all academic disciplines have substantially increased in the past decade (Cunningham and Dillon 1997, Newman 2001b, Cronin et al. 2003, Glänzel and Schubert 2004, Wagner and Leydesdorff 2006, Matthiessen et al. 2006). In this paper, we focus on international collaboration in globalization research in urban studies and planning. Researchers in urban studies and planning long have been involved in debates about the nature of globalization phenomenon and its impacts on cities. From this perspective, examining the internationalization of that field can bring useful insights about the overall process of knowledge globalization. Since 1980s, the concept of globalization has become popular in economic, political, cultural, and social studies. As King (1990, 1) suggests although “this global consciousness is new, the phenomena are not”. The Silk and Spice Routes that go back to more than a thousand years, Hanseatic League Cities of Northern Europe between 12th and 17th centuries (Abu-Lughod 1989 and Taylor 2004) and the whole notion of Colonialism that span over four hundred years (Taylor 1985, King 1990) shows that there has been an integrated world system for decades. What is different about the contemporary era lies in the magnitude and the speed of global flows (Held et al. 1999), which have formed multifaceted and “thick relations” (Keohane and Nye 2000, 7). Globalization as a contemporary phenomenon is rooted in the economic and technological restructurings that occurred around 1970s and resulted in expanding global operations of the US transnational corporations and banks. The reorganization of the financial industry, global dispersion of manufacturing activities and the coinciding advances in information and communication technologies led to a globalized economy (Knox 1995, Castells 1996, Sassen 2001). Advanced information and communication technologies have resulted in increased flows of technology, people, capital, goods, and ideas across borders (Castells 1996, Appadurai 1996, McMahon 2004). Today, globalization is seen as a general paradigm with economic, cultural, social, and political dimensions and is associated with “the widening, deepening, and speeding up of world-wide connectedness in all aspects of contemporary social life” (Held et al 1999, 2). Due to this connectivity, globalization can be defined as the growth of networks with “multiple relationships” between various actors spread over “multicontinental distances” (Keohane and Nye 2000, 2). One newly emerging and relatively understudied topic in globalization research is academic globalization, understood as increasing connectedness of universities, research centers and researchers. Umpleby (2007) argues that because of academic globalization, innovative projects originating in one place could easily be transferred to different national or international contexts, thus facilitating the flows of knowledge. Urban studies and planning are two disciplines that would benefit from explorations of the theoretical and practical applications of academic globalization. Our specific objective in this paper is to explore the dynamics of international co-authorships focusing on globalization research in urban studies and planning between 1991 and 2009. In the 1990s and 2000s, the patterns and driving forces of globalization changed compared to the developments of its early stages. During that period multinational firms became powerful globalizing agents. Between 1990 and 2003, the number of multinational companies grew from 3,000 to 63,000 (Gabel and Bruner 2003). In the beginning of this millennium, half of the world’s biggest hundred economies were multinational corporations (Norberg 2003). In addition, the lifting of the Iron Curtain, the establishment of regional trading blocks including the European Union and NAFTA (Dunning and Mucchielli 2002), and the rise of the Pacific Rim economies (e.g. China, South Korea, Japan, Australia and New Zealand) (Naisbitt 2000) provide examples of important developments that intensified the processes of globalization in the 1990s. The 2000s were marked by the recognition that environmental issues are global, global warming is real (UN-Habitat 2008), and that mega urbanization is the new trend (UN-Habitat 2006). In 2007, for the first time in history, the world’s urban and rural populations became equal (UN-Habitat 2006). Recognized by the United Nations and other global institutions, urban and environmental problems are awaiting global-scale solutions focused on sustainable development (UN-Habitat 2009). The current global financial crisis also demonstrates how interlinked the world has become. All of these developments have given unique angles to globalization research in urban studies and planning. Thus, in this study the expected increase in the number of research papers and international collaborative efforts can be traced back to the unfolding global structures in the political, economic, social, and cultural realms. The first section of the paper focuses on reviewing theories of social networking and studies that have examined international co-authorships in different disciplines. The second section describes the data sources, data processing and methods. The third section provides the results of the bibliometric and network analysis and offers a discussion about the findings. The fourth section contains conclusions and ideas for further research. Globalization of Academic Research: A framework for Global Knowledge ConstructionThe increased exchanges between educational institutions from all over the world, and especially the enormous potential of scientific research collaboration at global level led to what Umpleby et al. (2007) defined as “academic globalization”. The global flows of ideas were influenced by the new set of economic factors and the use of English as an international language. The Internet and other information and communication technologies also played an important role as they allowed experts to communicate with each other despite their location (Altbach 2005). Another reason for academic globalization is the increase of international travel, which created diverse experiences and collaborations in learning, teaching, and research (Umpleby et al. 2007). In the global era “education is affected structurally” in terms of policy, practice, and content because of changing experiences and expectations of the students themselves (Rizvi and Langard 2000, 421). The increase in international exchange programs, integration of globalization related material into course curricula, and franchising of foreign academic programs are examples of this response (Altbach 2005, Ali and Doan 2006). Knowledge produced by universities and research centers play an important role in the advancement of academic globalization and distribution of its benefits to society. Different scholars have argued that the new socio-cognitive structures based on knowledge built up by universities, university research centers, corporate research and development, and creative industries are perhaps the most significant factor of economic prosperity and social change in the global era (Florida 2002, Cronin 2003, Matthiessen et al. 2006). Knorr-Cetina (1999, 1) referred to scientific research as the primary “knowledge institution throughout the world” and stressed its importance for the creation of knowledge societies where intellectual capacity becomes more important in generating wealth than physical capital in the form of infrastructure, technology and final products. In the literature, it has also been emphasized that the creation of wealth is as much dependent on flows of financial capital, labor and goods as it is on the flows of creative ideas (Matthiessen et al. 2006). According to Castells (1996), the contemporary knowledge-based society is better understood as globally organized networks with complex morphology that transcends the simple exchanges based on information flows. Due to the developments in information and communication technologies, the spatial structure of the social networks is no more place-bounded and may consist of virtual communities. In today’s world, social networks in general, and research networks in particular, are organized based on convergence of interests and ideas rather than proximity. Most studies on collaborative research focus on interactions between researchers from various countries (Matthiessen et al. 2006). Undoubtedly, cities and regions participate in the global formation and organization of knowledge flows. Historical examples of this include the ancient cities of Alexandria, Pergamon, and Ephesus. These three ancient cities had the largest library complexes of their time, transforming them into global centers of scholarship (Polastron 2007). In terms of the participation of cities in the global organization of knowledge, Castells (1996) theory of “space of flows” offers a useful framework. Castells (1996) argues that the space of flows consists of three layers: an infrastructure layer, a nodes-and-hubs layer, and a managerial elite layer. The infrastructure layer uses new communication and information technologies. At this level, no place exists by itself as all positions are defined by the network dynamics. The second layer is composed of “nodes” and “hubs” where hubs are exchangers and coordinators, and nodes are locations of strategically important functions (Castells 1996, Taylor 2004). The third layer is related to the spatial organization of dominant, managerial elites. Taylor (2004) argues that the second layer is the most important layer of the space of flows because this is the layer, where exchanges and coordination occur. At this level, both nodes and hubs are hierarchically organized according to their weight in the network. The functions of the network determine which places will become privileged nodes (Castells 1996). The hierarchy in this layer is not stable as it is subject to competition. This framework is applied to cities in order to explain how urban areas function in the global economy. Another theoretical framework in terms of understanding how cities participate in wealth and knowledge creation is provided by Jane Jacobs (1984) in her book “Cities and the Wealth of Nations”. As Taylor (2004) describes, Jacobs (1984) identifies two types of cities: dynamic cities and static cities. Static cities are passive locales, through which goods are transported, but with little associated economic activity and no additional wealth creation. On the other hand, dynamic cities are centers of innovation, in which local production expands directly into trade (Jacobs 1984, Taylor 2004). According to Jacobs (1984), the expansion of the economic system is possible through the import replacement strategies that will convert static cities into dynamic ones. Import replacement activities bring independence to the city economy, create competition, and form trade links with other cities. Thus, in the end, competing cities become embedded in networks (Jacobs 1984). Jacobs developed this framework to explain the role of cities as sources of innovation in the manufacturing of physical goods. Her model can be useful in exploring the role of cities in the production of knowledge and scientific innovation. The model suggests that the global knowledge networks will expand and become more sophisticated as an increasing number of cities grow to be dynamic hubs of knowledge generation. A vital component of the ability of cities and regions to foster economic growth and compete on a global scale is their capacity to generate and distribute new knowledge (Matthiessen et al. 2002, 2006). With their intense concentration of people, cities facilitate the generation of innovation and knowledge (Knox and McCarthy 2005). Cities and regions enable the exchange of information and knowledge playing a two-fold role: first, as hubs for incoming flows of creative ideas and, and second, as nodes of socio-cognitive structures that generate knowledge “outflows” reaching the global knowledge networks. In the context of urban studies and planning, sharing international and intercity knowledge and expertise is crucial. Urban studies and planning recognizes the dynamic nature of urban settlements and plays a role in how institutions and agents adapt to their changing environments by acquiring and applying new knowledge. For this reason, we believe that examining the international/intercity research collaborations on a global scale can provide additional insights with regard to construction and distribution of knowledge. Globalization has added new dimensions to knowledge creation, and as a result, scientific research has acquired the properties of emergent social networks (Wagner and Leydessdorff 2005, 2006). A social network is understood as an intertwined web of relationships in which emphasis is removed from social arrangements based on social groups (as in traditional sociology) and placed upon interactions between social structures represented as links and nodes on a graph (Barabasi and Albert 1998, Newman 2001a, Glänzel 2002, Freeman 2004, Carrington et al. 2005, Liu et al. 2005). The structural position of each node, or how well it is connected, how “central” is its position with respect to the overall graph, whether or not it is part of the core component or an isolate, and how many steps are separating it from a node of greater power, in this context, becomes a focal point of research (Newman 2001a, 2001b). Researching international co-authorships in science, Wagner and Leydesdorff (2006) tested the hypothesis that collaborative research transcending national boundaries acquired the properties of specialized self-organizing networks. These networks are characterized by a diversified and dynamic internal structure, emergence of complex patterns and behaviors, and non-linearity of responses that may arise from simple interactions (Wagner and Leydesdorff 2005, Wagner and Leydesdorff 2006). Wagner and Leydesdorff (2006, 2) also emphasize that the creation of new knowledge is “fundamentally relational” as it is based on cooperation, sharing, communication and dissemination. The growing importance of regions and cities as entrepreneurs in the creation of wealth and knowledge is widely recognized. In order to better understand the emerging patterns of international collaboration in globalization research in urban studies and planning, we examine international co-authorships at two levels: at the country level and at the city level. This two-tiered approach emphasizes the role played by cities in the knowledge society. Research statement, data and methodsResearch StatementIn the light of the above discussion, the following three research questions were formulated: 1) Has knowledge construction in globalization research in urban studies and planning become more collaborative at the global level over the past 30 years? 2) Are the patterns of international co-authorships in globalization research in urban studies and planning resemble that of other disciplines where the presence of self-organization has been acknowledged? 3) Do international and intercity research networks exhibit similar patterns of self-organization? We examine these research questions by exploring the changing dynamics of international collaboration in globalization research in urban studies and planning between 1980 and 2009 using the tools of network analysis. DataWe collected bibliographic data from journal articles that focused on globalization or an aspect of globalization in urban studies and planning published between January 1st 1980 and July 10th 2009 as they appear in the Science Citation Index (SCI). In collecting the data, we searched the SCI using the keyword “globalization” for journal articles from the subject areas of “planning and development” and “urban studies”. Data from the Science Citation Index for the period 1980 - 1990 was also extracted, but since there were only a few publications on the subject and no international co-authorships were identified, this period was excluded from further investigation. In order to better understand the patterns in international/intercity co-authorships, we have grouped the data in four periods: 1991 to 1995, 1996 to 2000, 2001 to 2005, and 2006 to July 2009. The last period covers only three and a half years but because it reveals trends that are noticeably different from those of the previous period, the authors felt that it would be beneficial for this analysis to include these data as well. MethodsBibliometric AnalysisOverall, 801 articles were retrieved from the SCI. From this pool of published work in globalization research in urban studies and planning, 85 articles, produced by 223 researchers, were internationally co-authored articles. Each article was examined individually, and the names of the countries and cities from which researchers collaborate were entered in a database. From the initial dataset of 85 articles, two more datasets were produced. The first subset of data (type I) is composed of the countries involved in collaborative research. The second subset of data (type II) is composed of the cities from which researchers collaborated. Two symmetrical binary matrices were constructed for each of the four five-year intervals: one matrix at the country level, and another matrix at the city level. Matrices contain values of 1 and 0, where existing collaboration between two or more countries/cities was coded as “1”, and no collaboration was coded as “0”. The maximum number and the total number of collaborations were used to create weighted matrices at both levels. The weighted matrices can be used with some of the algorithms in network analysis but metrics in general are calculated on the basis of the binary matrices. Network AnalysisNetwork analysis provides several useful concepts to examine the structure of globalization networks. In network analysis, the characteristics of the social network graph are examined in terms of the overall graph’s size, density, diameter and average distance as well as in terms of the strength each node’s position with regard to the remaining nodes. The nodes in a network can be tightly or loosely connected. They may also exist in the form of tightly connected nucleus or a number of loose or disconnected components. In one case, it may take many steps to go from one end of the network to the other, while in another, this can be accomplished only in a few steps. Networks also vary of terms of average distance and overall centralization. The position of each node is determined by its centrality, virtual neighborhood (clustering), and potential to influence the remaining nodes of the network through its connections. Various tools and metrics of social network analysis are available within the UCInet software package developed by Borgatti et al. (2002). In order to describe the characteristics of the international/intercity co-authorship networks in globalization research in urban studies and planning, in this study we use descriptors of size, connectivity and distance, and centrality and clustering. Size and Core Component AnalysisThe size of the network is defined by the number of connected nodes (Newman 2001a). Hanneman and Riddle (2005) emphasize the critical importance of the size of the network for the social structure as larger networks require greater resources for developing and maintaining social relationships. A core component in network analysis is defined as a subset of nodes that are mutually connected (Liu et al. 2005). It is a useful concept that can bring insight about which nodes in the network belong together and which remain in isolation. ConnectivityThe second way to look at networks is by exploring their overall connectivity and the distance between its nodes. Several measures are available for this purpose. The diameter of the network is defined as the “largest geodesic distance” (Hanneman and Riddle 2005), that is, the maximum number of steps between two edges of the network. Geodesic distance is the “efficient” link, or the shortest available path between two nodes in the network (Hanneman and Riddle 2005). Density, on the other hand, refers to the ratio of the sum of all existing ties to the sum of all possible ties (Hanneman and Riddle 2005). The density metrics provides an indication of how tightly the nodes are interconnected. The compactness index measures cohesiveness on a scale from 0 to 1 where higher values (closer to 1) indicate greater continuity and connectedness. The fragmentation index is the opposite of the compactness index and tells us the proportion of mutually accessible nodes. The average distance metrics indicates how many steps, on average, it will take to reach one node from any other node in the network. In denser networks where the geodesic distances are relatively small, the average distance is low. Network analysis assumes that partners connected at shorter distances have better established and stronger ties than partners connected at longer distances (Hanneman and Riddle 2005). Too many connections of length 1 and 2 may also suggest a higher incidence of small clusters within the network, while connections at longer distances indicate better overall connectivity. Longer length connections provide the network with greater cohesiveness and vigor, and diminish the possibility of disturbance (Hanneman and Riddle 2005). Centrality and Cluster AnalysisA third way to look at relations displayed on the network graph is by interpreting the phenomena of network centralization and clustering. Three metrics are particularly useful for this purpose: 1) the overall graph clustering coefficient, 2) the centralization index, 3) the levels of degree and betweenness centrality. The overall graph clustering coefficient is a measure of the average density of the clusters surrounding each node (Hanneman and Riddle 2005). Higher values of the clustering coefficient indicate that partners “are more likely to publish together” (Liu et al. 2005, p. 1475). The Freeman graph centralization index is calculated as a proportion of a theoretical maximum based on the most centralized (“star”-shaped) network (Hanneman and Riddle 2005). Larger values of the index suggest unequal distribution of influential structural positions since some nodes in the network are endowed higher concentration of power than others. Freeman’s degree centrality measures the strength of the structural position of each node. The degree of each node in the network is based on the number of links that reach out from it (Hanneman and Riddle 2005). Nodes with more links are considered more influential because they can reach out to more partners and acquire access to more resources. Degree centrality provides only an intuitive insight on how central a node’s position in the network is because it is based only on the number of each node’s immediately adjacent neighbors (Liu et al. 2005). Degree centrality may sometimes misrepresent how much influence a node has because it does not provide indication of whether or not the actor belongs to a small, disconnected cluster, or to a larger segment of the network (Liu et al. 2005). Univariate statistics and another centrality metrics – betweenness – were used to develop further understanding of how central a node’s position is. Betweenness centrality is a measure of the strength of each position in the network in terms of relationship potential. If a node serves as an intermediary between other nodes in the network, there is a higher potential for this node to attain a favorable structural position (Hanneman and Riddle 2005). Hence, betweenness centrality of each node is determined by computing the number of the shortest geodesics distances that connect any pair of nodes in the network by crisscrossing this particular node (Liu et al. 2005). When the network is highly fragmented, zero betweenness centrality is generated for a larger number of nodes in the network (Liu et al. 2005). Results and discussionThis section presents the results obtained from the bibliometric and network analyses. First, we present the results of the bibliometric analysis for the total of 801 journal articles retrieved from the SCI with the keywords of “planning and development” and “urban studies” (Tables 1 and 2). The second sub-section is focused on the results of the network analysis performed on the smaller data set of 85 journal articles that reflect the collaborative efforts of the 223 researchers throughout the study period. Results from the Bibliometric AnalysisGlobalization research in urban studies and planning between 1980 and 1990 was represented by only five publications and because no collaborations were identified, this period was not taken into consideration. Collaboration in globalization research in urban studies and planning started after 1991. The total number of articles in globalization research in the fields of urban studies and planning increased significantly over the years (Table 1). The total number of collaborations (both national and international) also increased. During 1991-1995, approximately 22 percent of a total of 49 journal articles were written in collaboration. During 1996-2000, out of 146 articles, nearly 30 percent resulted from collaborative research. The percentage increased to 35 percent between 2001 and 2005, which had a total of 327 articles. Out of 279 articles written in the last period, 46 percent resulted from collaboration (Table 1). Table 1: Total number of articles and total number of collaborations
National collaboration in globalization research in urban studies and planning is stronger than international collaboration, which can be expected due to the high number of scholars at the same research institution working together on joint projects. Associations at the national and international level such as the Association of the Collegiate Schools of Planning (ACSP) in the USA, the Association of European Schools of Planning (AESOP), and the Asian Planning Schools Association (APSA) contribute to the strengthening of the national collaboration in research and education. These associations, through conferences, workshops and similar events, facilitate contacts between researchers from different countries. International scholarship programs like American Fullbright or European ERASMUS (Altbach 2005) also encourage this process. Wagner and Leydesdorff (2005) emphasize that international collaboration is predominantly driven by self-interest rather than by institutional arrangements. For example, academics working abroad keep their ties with the home countries via collaboration or as visiting scholars (Altbach 2005). These academics keep themselves embedded in the issues of their home countries, which has an impact on their research agenda. In globalization research in urban studies and planning, there is a significant increase in international co-authorships after 2000. Between 1996 and 2000, approximately 6 percent of 146 journal articles resulted from international collaboration. During 2001-2005, the total number of journal articles more than doubled compared to the previous period. During the same period 13 percent of 327 articles were written by international collaborators (Table 1). Table 2: Top five countries by number of articles and study period
The United States has always dominated globalization research in urban studies and planning in terms of the number of published journal articles (Table 2). In three of the four time periods, England followed the United States, and Canada ranked third. During the last period, twenty journal articles were published with at least one Chinese co-author, and thus China ranked fourth. Although the United States kept their leading position as far as the number of publications is concerned throughout the entire study period, it is not the dominant country in terms of international collaboration. This can be attributed to the multi-cultural academic environment of the United States where universities attract scholars and researchers from all over the world. Altbach (2005, 68) points out that there is academic migration to countries that offer more attractive financial and working conditions, and the United States benefit from this trend. Thus, in the case of the United States, although there is international collaboration, it happens within the context of nationally sponsored research. Network AnalysisThis section present the results of the network analysis in terms of size and growth of the network, connectivity and distance, and centrality and clustering. Each subsection presents the results for both type I (i.e., countries) and type II (i.e. cities) nodes. The discussion of results focuses on comparing the patterns observed at each level of analysis (e.g., type I vs. type II nodes). We also compare, when possible, our conclusions to the findings of similar studies in other disciplines. Size and Core Component AnalysisChanges in Network SizeCo-authorship networks have grown significantly in the past three decades at both international and intercity levels (Table 3). An amazing fact about this growth is that it involved countries and cities from all continents including Africa, Latin America, South East Asia, and Australia. Changes occurred in terms of total research output as well as in terms of size, connectivity and centrality. Over a 28-year span, the international collaboration in globalization research in urban studies and planning has increased from 8 to 33 countries (type I nodes), which is a four-fold increase compared to the first half of the 1990s. The number of ties within the network of international co-publications has marked considerable growth as well. At the level of type I nodes, the number of linkages increased from 12 links in the first half of the 1990s to the current number of 100 (Table 3). The number of cities represented as type II nodes in the network of collaborations in globalization research in urban studies and planning also showed substantial increase, from 8 in the early 1990s to 70 in 2009. The number of co-authorships at the level of type II nodes (i.e., cities) expanded even more significantly, from 8 in the early 1990s to 162 in 2009 (Table 3). Changes in the Network Core ComponentIn the early 1990s, the core component of the network of international co-authorships in globalization research in urban studies and planning consisted of only three countries and three cities. In the second half of the 1990s, the core component of the network grew to 10 countries and 14 cities. In the period of 2001-2005, the network had several disconnected clusters at the level of type I nodes (i.e., countries). During the last period (January 2006 to July 2009) the network of type I nodes (i.e., countries) engaged in globalization research in urban studies and planning became fully connected. Currently, according to the results of this analysis, at the country level there are no groups of authors who develop bilateral or multilateral collaborations but remain isolated from the core component. The co-authorships at the level of type II nodes (i.e., cities) remained largely disconnected until the year 2000. In the period of 2001-2005, the core component of type II nodes grew significantly and incorporated 40 cities. It continued to grow in the subsequent period, although at a much slower rate. At the level of the cities, however, approximately 38 percent of the nodes remain in clusters that are not connected to the core component of the network. Table 3: Network metrics by study period
The results presented in Table 3 are indicative of important structural transformations occurring in the network. The initial spontaneous collaborations resulting from occasional interactions between co-authors within the network have evolved into structured relationships incorporating more authors adhering to more stable and coherent clusters. At the same time, the incorporation of significant number of new participants in the network reveals a trend towards diversification and exploration of new sources of knowledge and ideas (Wagner and Leydesdorff 2006). Similar trends were revealed by studies investigating international collaborations within several disciplines of science (Wagner and Leydesdorff 2006), and particularly in the fields of biotechnology, nanotechnology, and information and communications technology (Matthiessen et al. 2006), information systems (Cunningham and Dillon 1997), physics, biomedical research, computer science (Newman 2001b), psychology (Cronin et al. 2003), medical and biomedical research and mathematics (Glänzel and Schubert 2004). ConnectivityDensity, Diameter and CompactnessThe present analysis revealed that in the early1990s the network of co-authorships of type I nodes (i.e., countries) had a diameter of 2 and a density metrics of 0.214, which means that 21 % of all possible ties could be found as existing ties in the network. Between 1996 and 2000, the diameter of the network of type I nodes increased to 4 geodesic distances. The density metrics dropped to 0.182 as the network increased in size. Between 2001 and 2005 the number of both type I nodes increased notably. During this period, the diameter of the network of type I nodes grew from 4 to 7 geodesic distances. This change resulted in a much larger network where some of the nodes were as far as seven steps away from some of the other nodes. It can be anticipated that a dramatic rate of network growth over a short period of time would rather translate into low levels of internal connectivity which is confirmed by the values of network density metrics. During that period, the density of the network dropped to 0.064. The larger network of international co-authorships in globalization research in urban studies and planning lacked well-organized internal structure, connectivity and overall cohesiveness. Since 2006 the number of links between type I nodes grew by approximately 25 percent (from 76 to 100). Its diameter decreased indicating that all nodes of the network could be reached in no more than four steps. The density metrics slightly increased but its value remained low since only 10 percent of all possible partners developed actual co-authorships. During the 1996-2000 period, at the level of type II nodes (i.e., cities), the density metrics had a value of 0.088, indicating that only 8.8% of all possible ties developed as collaborative research efforts. These results are indicative of a tightly interwoven network at the international level, but a highly compartmentalized network at the intercity level. In other words, participating authors came from a larger number of loosely connected cities geographically located in a closely connected network of countries. These findings are supported by the fragmentation and compactness metrics. The results displayed in Table 3 reveal that the compactness index for all four study periods is relatively low. For example, during the first and third study periods, between 23 and 26 percent of type II nodes did not belong to the core component. During the second and the fourth periods as much as 36 to 38 percent of the type II nodes were not part of the core component. These findings depict a network in which important links that would facilitate knowledge flows are still missing, as a significant portion of the nodes remain in isolation and, therefore, cannot exchange information with the core component. It can also be implied from these results that information – theories, hypotheses and empirical findings – may not be able to travel fast enough through the network and reach potential audiences who share similar interests and expect to benefit from these research efforts. DistanceIn the early 1990s, when the network consisted of only eight type I nodes, the average distance was 1.143. In other words, it required approximately 1.1 steps, on average, to reach a node in the network. Despite the substantial growth occurring in the network over the study period, the average distance increased slowly. The fact that the average distance did not match the remarkable increase of the number of type I nodes can be explained by the fact that the network remained rather loosely connected, with prevailing bilateral co-authorships. Since 2006, the average distance has decreased, which is an indication that the network becomes denser and more entwined over time. Table 4 presents a more detailed picture of the occurrence, evolution and distribution of different type of geodesic distances throughout the study period at the level of type I nodes. Between 1990 and 1995 as much as 85.7 percent of all geodesic distances in the network of international collaboration were associated with paths of length 1. Because of the small size of the network almost every partnering country and city was virtually a step away from the rest of its partners. The number of one-step pathways decreased to 26 percent between 1996 and 2000, and to 10.6 percent between 2001 and 2005. It began rising again after 2006. In the last three periods, the largest subset of geodesic distances consisted of two- and three-step paths. In all four periods, shorter length geodesic distances clearly dominated the network, which suggests the presence of closely connected adjacent nodes. Since the overall density of the network remained low, many links were clustered providing only limited access to pathways reaching more distant parts of the network. Table 4: Frequencies and proportion of type II geodesic distances by study period
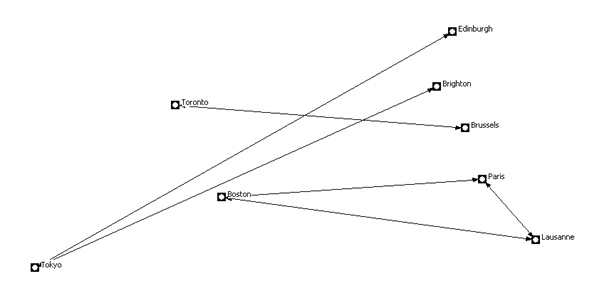
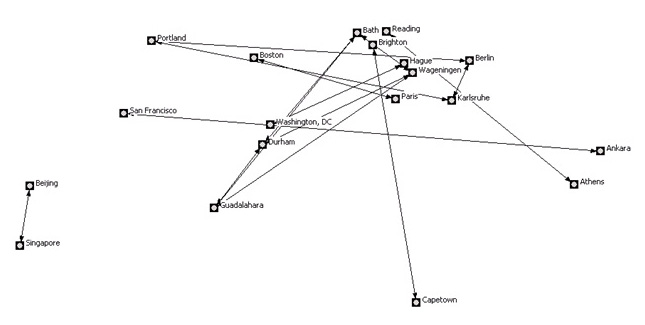
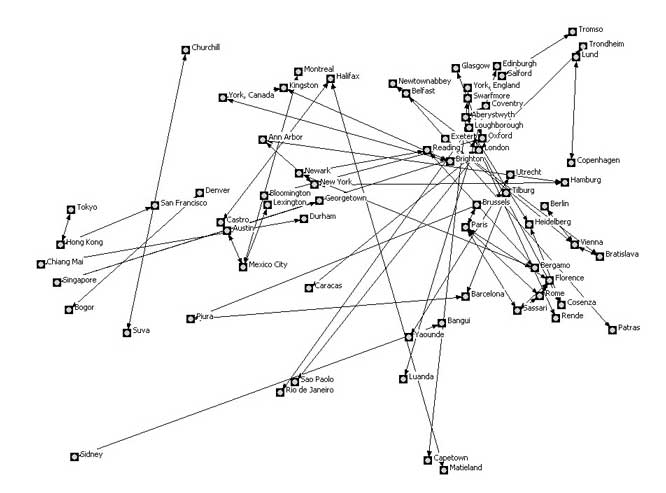
Between 1996 and 2000, the high proportion of geodesic distances of lengths 1, 2 and 3 can be explained by the small size of the network. The presence of wide variety of paths of different lengths during the 2001-2005 period is most likely related to the rapid physical growth of the network. Although the distribution of the geodesic distances after 2006 resembles that of the second study period, the underlying causes are less likely to be related to the network size than to the structural transformations and adjustments occurring within the network. These adjustments are related to the increased number of logically possible links in the network. As the network becomes more complex, mutually accessible pairs develop into key determinants of the strength of the social structure. At the level of type II nodes, the average distance between 1991 and 2005 remained low, between 1 and 2 steps. This result indicated that until 2006 there was strong connection between adjacent type II nodes while the overall connectedness remains weak. After 2006, the average distance increased to more than two steps. In terms of collaborative co-authorships, it became important to understand not only “How many contacts do I have?”, but also “How ‘efficient’ is my reach?”, that is, how many additional nodes are accessed through a link that crosses a specific node. Therefore, as the “complexity” increases, questions such as who is connected to whom and what is my position relative to the power players becomes more important than how tightly coupled the entire network is. Clusters and CentralityClusteringOur data show that the average clustering coefficient at the level of type I nodes was relatively high in the early 1990s (0.75). It is due to the fact that the entire network consisted of three dense but disconnected clusters (Figure 1). Overall, smaller network tend to be denser than larger ones, and therefore, it was not surprising that the average clustering coefficient had been steadily dropping in the two subsequent periods as the network was rapidly growing. Since 2006, the average clustering coefficient of international co-authorships rose to the current level of 0.835. This finding reveals a trend that has been well documented in other disciplines. Newman (2001a and 2001b) and Wagner and Leydesdorff (2006) reported clustering coefficients of 0.726 and 0.789, respectively, for international co-authorships in various fields of the scientific research community. Liu et al. (2005) found a clustering coefficient of 0.889 for all the research publications in ACM/IEEE digital libraries. The average clustering coefficient at the type II nodes remained high throughout the entire study period. It is worth noting that the average clustering coefficient for type II nodes between 2001 and 2005 has a value of 1 (Table 3). This can be attributed to the structure of the network which consisted only of small disconnected clusters. UCInet (Borgatti et al. 2002) allows its users to examine the neighborhood of each node in the network in further detail. In the most recent period (2006 to date), England had as many as 91 pairs of neighbors, but slightly more than one-tenth of all logically possible ties in this cluster developed as collaborative research efforts. Canada, Italy and the USA each had 15 pairs of neighbors. In the case of the United States only 16.7 percent of all possible ties resulted in internationally co-authored publications, while Italy and Canada productively developed 40 and 46.7 percent, respectively, of these opportunities. Germany, China and Australia had each 10 pairs of neighbors. For Australia, the average density of its neighborhood remained close to 0, while China actively developed 20 percent of all possible collaborations at determined by the network graph. Germany belongs to a small but very dense neighborhood where 60 percent of all possible collaborations resulted in research publications. Are clusters organized on the basis of geographic proximity? In order to answer this important question, we performed optimization cluster analysis at the level of type II nodes (i.e., cities). Two clusters were identified during the first period, three during the second period, and ten during each of the remaining two periods. Cluster analysis of type II nodes revealed that in their large majority clusters were not based on geographic proximity. Among 25 clusters, only one remained within Europe. All remaining clusters were a mix of cities from different geographic regions. These results indicate that geographic proximity is no longer playing a significant role in building and maintaining research collaborations. In the early 1990s, the structure of the network of type I nodes (i.e., countries) resulted in an overall centralization index of only 4.8 percent. The low index value was expected because most of nodes in the network were at one-step reach from any other node. As Figure 1 reveals, there was no evidence of “power brokers” or intermediaries in the network, and therefore, high degree of centralization could not be anticipated. The centralization index increased to approximately 40 percent between 1996 and 2000, to 43.5 percent between 2001 and 2005, and to 53.3 percent between 2006 and 2006. Both the distribution of the geodesic distances and the centralization index confirmed that since the second half of the 1990s, we have been witnessing a trend towards formation of more influential positions at the international level. At the level of type II nodes (i.e., cities) the centralization index values remained low. The highest level of the index was observed after 2006 when the intercity network achieved centralization of 15.9 percent. Figure 1: Graph of intercity co-authorships a. 1991-1995
b. 1996-2000
c. 2001-2009
These rather contradictory results lead us to the conclusion that while relatively high level of centralization has been achieved at the international level as some countries were assuming leadership positions, the centralization at the intercity level remains weak. The influence of individual nodes at this level is still fairly equally distributed. We believe that the exponential increase of the size of the network over a short period of time contributes to this outcome. However, we expect that the trend observed at the international level will be translated in the future to the level of the intercity partnerships as well. Hence, we anticipate self-organization of hierarchies with higher potential to influence the knowledge flows within the network. Table 5: Freeman's betweenness centrality and degree centrality metrics for researchers from selected cities by study period
Degree and Betweenness CentralityTable 5 provides partial results from the degree centrality analysis performed with UCInet (Borgatti et al. 2002) at the intercity level. In the 1990s, most partners had low degree of connectivity. Since 2000, the degree centrality approximates a power-law distribution where some cities such as London, Loughborough, Bonn, Oxford, Durham, Reading, Milan, Ann Arbor, and Copenhagen emerge as higher status nodes with higher degree of interconnectivity. Most of the remaining nodes appear to have low degree centrality and for this reason this group is only partially represented in Table 5. Table 6: Freeman’s betweenness centrality for researchers from selected countries by study period
Because of the limitations of the degree centrality metrics mentioned above, univariate statistics for the four data sets were also calculated for type II nodes. The results from the univariate statistics analysis indicated that in 2001-2005 the most central nodes such as London and Loughborough were connected to only 5.9 percent of the network. In 2006-2009 London’s connectivity increased to18.8 percent. During the same period, Bonn developed connections with 11.6 percent of the nodes in the network. Beijing became connected to 8.3 percent, and Copenhagen, Reading, Madrid, Oxford, Loughborough, Shanghai and others reached out to 7.2 percent. These results confirm our previous conclusion that network centralization at the intercity level is still relatively weak, and despite the fact that a few central players have recently emerged, there is not enough evidence to support the assumption that power concentration in a few strategically positioned nodes exists. In the early 1990s, Japan on the country level and Tokyo on the city level emerged as the only nodes with positive betweenness centrality. Between 1996 and 2000, three countries (USA, England and the Netherlands) assumed structural positions that enabled them to serve as intermediaries between other pairs of nodes in the network. However, all of the cities in the network during that period generated zero betweenness centrality, which means that none of the nodes served as an intermediary that can connect other pairs of nodes. After the year 2000, betweenness centrality significantly improved at both the international and intercity levels. This finding confirms our hypothesis that despite the low network centralization at present, there is a self-organization potential from which power nodes may emerge as the network becomes more interconnected. This hypothesis is supported by the increasing variation of partners’ betweenness as expressed by the magnitude of the standard deviation relative to the mean. The amount of variation in the most recent study period (standard deviation of 21.28 to a mean of 4.9) clearly indicates that that are ongoing processes as a result of which centrality is not equally distributed. There is a tendency for certain nodes in the network to become more “central”, meaning that more links are going through them, and therefore, they serve as “bridges” (Liu et al. 2005) that connect other pairs of nodes. As such, they assume more advantageous and powerful positions in the network. ConclusionThe present analysis covers internationally co-authored research articles in the field of urban studies and planning focused on different aspects of the process of globalization during the period 1991-2009. Data were gathered from the online version of the Science Citation Index (SCI). Networks at both country and city level were examined in terms of size, internal connectivity, clustering and strength of each node’s structural position. The results showed an impressive growth in the size of the networks at both the international and the intercity level over the study period. The number of collaborations at the country level increased four-fold between 1991 and 2009. The number of collaborations at the intercity level grew almost twice as much during the same period of time. Similar trends have been observed in other research fields such as physics, mathematics, medical and biomedical science, biotechnology, etc (Newman 2001b, Glänzel and Schubert 2004, Wagner and Leydesdorff 2006, Matthiessen et al. 2006). The expansion of international collaborations in research in general, and in globalization, in particular, is not institutionalized. There are no institutions or agencies in place at the national or international level that would specifically guide international co-authorships. Therefore, seeking collaborative opportunities abroad is clearly a result of choice and invested effort on behalf of each individual researcher. Wagner and Leydesdorff (2006) contend that today’s complex knowledge system have properties that can be best described by the conceptual framework of the complexity theory. Thus, the complex networks formed as a result of international co-authorships exhibit patterns of emergent self-organizing entities that form much of the fabric of today’s knowledge system (Wagner and Leydesdorff 2006). The results of this study provide evidence in support of this hypothesis. In this paper, we focused was on the quantitative growth of international co-authorships in globalization research in urban studies and planning. Compared to other fields, globalization research in urban studies and planning is expected to be more open to international collaboration than other fields and generate higher number of joint research, which might not be the case in other areas that focus more on localized knowledge and skills. Thus, uncovering the internal network dynamics provides the conceptual framework for understanding self-organization and expansion of knowledge networks. Networks can differ in terms in internal connectivity, ties, density, or clustering patterns. Social network analysis provides tools to explore these diverse dynamics. Revealing each network’s structural identity informs us about processes that can advance and diversify knowledge. The network of international co-authorships in globalization research in urban studies and planning is a relatively small component of the entire web of interactive collaborative efforts at the global level. Further research might focus on related fields such as environmental studies and examine their internal network dynamics in terms of international co-authorships in comparison to the internal network dynamics of the globalization research in urban studies and planning. In the researched network, self-organization occurred as a result of the emergence of new nodes as well as a result of the emergence of new links. Initially, the network was primarily composed of links created as a result of the emergence of new nodes. More recently, new links appeared between already existing nodes as co-authorships increased within the network. The network analysis also revealed that the pattern of cluster formation has also changed. Our findings suggest that geographic proximity does not play a significant role in the development of international/intercity collaborations. Our results also reveal that analyzing data at both international and intercity level can bring insights about the differences between these two types of networks. For example, our findings indicate that the network of the international collaborations is more centralized than the network of intercity collaborations. This result has implications for further research as most studies focus predominantly on the links established between researchers from different countries but ignore the intercity level. Yet, another level that can bring new insights is the inter-university collaboration at international level. Another idea for further research is related with the online globalization research communities and how they will alter the structure of self-organizing research networks. Leading examples of these online research communities are the Globalization and World Cities Research Group (GaWC) at Loughborough University, UK and the Annenberg Research Network on Globalization and Communication at the University of Southern California, US. These online research communities act as professional meeting venues and idea exchange platforms for scholars with similar interests in globalization, who are located in home institutions all over the globe. In contrast to the national and international associations, these online communities offer a more focused perspective on globalization related topics. Contacts in these online communities usually result from individual efforts. We expect that these online communities will be more influential in defining the future of the self-organizing research networks in globalization research in urban studies and planning as the number of their members increase. REFERENCESAbu-Lughod, Janet L. (1989) Before European Hegemony: The World System, AD 1250-1350. New York: Oxford University Press. Ali, Arnal K. and Petra L Doan. 2006. A Survey of Undergraduate Course Syllabi and a Hybrid Course on Altbach, Philip G. 2005. Globalization and the University: Myths and Realities in an Unequal World. The NEA 2005 Almanac of Higher Education: 63-74. Appadurai, Arjun. 1996. Modernity at Large: Cultural Dimensions of Globalization. Minnesota: University of Minnesota Press. Barabasi, Albert.L. and Reka Albert. 1998. Emergence of scaling in random networks. Science, 286: 509-512. Borgatti, Stephen.P., Martin.G. Everett and Linton.C. Freeman.2002. Ucinet for Windows: Software for Social Carrington, Peter, John Scott, and Stanley Wasserman, eds. 2005. Models and Methods in Social Network Castells, Manuel. 1996. The Rise of the Network Society. Oxford: Blackwell Publishers. Cronin, Michael. 2003. Translation and Globalization. London: Routledge. Cronin, Blaise, Debora Shaw and Kathryn La Barre. 2003. A cast of thousands: Co-authorship and sub-authorship Cunningam, S.L., and Dillon, S. 1997. Authorship patterns in information systems research. Scientometrics, 39(1): Dunning, John H. and Mucchielli, Jean Louis. 2002. Introduction In Multinational firms: The Global-Local Dilemma. eds. John H. Dunning and Jean Louis Mucchielli, 1-3. London: Routledge. Florida, Richard. 2002. The Rise of the Creative Class. And How It's Transforming Work, Leisure and Everyday Life, 2002. New York, NY: Basic Books. Freeman, Linton. 2004. The Development of Social Network Analysis: A Study in the Sociology of Science. Vancouver: Empirical Press. Gabel, Medard and Bruner, Henry. 2003. Globalinc. An Atlas of the Multinational Corporation. New York: The New Press. Glänzel. Wolfgang 2002. Co-authorship patterns and trends in the sciences (1980-1998): A bibliometric study with Glänzel. Wolfgang and Andras Schubert. 2004. Analyzing scientific co-authorships through co-authroship. In: Moed, H.F., Wolfgang Glänzel, and Ulrich Schmoch al. (eds.) Handbook of Quantitative Science and Technology Research, 257-276. Dordrecht, the Netherlands: Kluwer Academic Publishers. Hanneman, Robert and Mark Riddle. 2005. Introduction to social network methods. Available at Held, David., Anthony McGrew, David Goldblatt, and Jonathan Perraton. 1999. Global Transformations: Politics, Economics, and Culture. Stanford University Press. Jacobs, Jane. 1984. Cities and the Wealth of Nations. New York: Vintage. Keohane, Robert O. and Nye, Joseph S., 2000, Introduction. In Governance in a Globalizing World, eds.J.S. Nye and J.D. Donahue, 1-45. Washington, DC: The Brooking Institution. King, Anthony D., 1990. Urbanism, Colonialism, and the World-Economy: Cultural and Spatial Foundations of the World Urban System. London, Routledge. Knorr-Cetina, Karin. 1999. Epistemic Cultures. Cambridge, MA and London: Harvard University Press. Knox, Paul L. 1995. World Cities in a World System. In World Cities in a World-System, eds. Paul L. Knox and Peter J. Taylor, 3-21. Cambridge, UK: Cambridge University Press. Knox, P. L. and McCarthy, L. 2005. Urbanization: An Introduction to Urban Geography. Englewood Cliffs, NJ: Prentice Hall. Liu, Xiaoming, Johan Bollen, Michael L. Nelson, Herbert Van de Sompel. 2005. Co-authorship networks in the digital library research community. Information Processing and Management, 41: 1462-1480. Matthiessen, Christian W., Annette W. Schwarz, and Soren Find. 2002. The top-level global research system, 1997-1999: centers, networks and nodality. An analysis based on bibliometric indicators. Urban Studies, 39(5/6)): 903-927. Matthiessen, Christian W., Annette W. Schwarz, and Soren Find. 2006. World cities of knowledge: research strength, networks and nodality. Journal of Knowledge Management. 10 (5): 14-25. McMahon, Patrice., 2004. Globalization and Global Governance: The implications for ethnopolitical conflict in Eastern Europe. Presented at the annual meeting of the International Studies Association 2004, Montreal, Quebec, Canada, Mar 17, 2004. http://www.allacademic.com/meta/p72488_index.html Naisbitt, John and Aburdene, Patricia. 1990. Megatrends 2000. New York: Avon Books. Newman, M.E.J. 2001a. Scientific Collaboration Networks: I. Network construction and fundamental results. Physical Review E, 64, 016131. Newman, M.E.J. 2001b. Scientific Collaboration Networks: II. Shortest paths, weighted networks, and centrality. Physical Review E, 64, 016132. Norberg, Johan. 2003. In Defense of Global Capitalism. Cato Institute. Polastron, Lucien X., 2007. Books On Fire: The Tumultuous Story Of The World's Great Libraries. London: Thames & Hudson Ltd. Rizvi, Razal. and Bob Lingard. 2000. Globalization and Education: Complexities and Contingencies. Educational Theory 50(4):419-426. Sassen, Saskia. 2001. The Global City: New York, London, Tokyo. New Jersey: Princeton University Press. Taylor, Peter. J. 1985. Political Geography. World-Economy, Nation-State and Locality. London: Longman. Taylor, Peter. J. 2004. World City Network. London/NY: Routledge. Umpleby, Stuart. A. 2007. Academic Globalization: The Growth of International Collaboration in Education and Research. Presented at the 11th World Multi-Conference on Systematics, Cybernetics, and Informatics. Orlando, FL, July 8-12, 2007. Umpleby, Stuart A., Konstantin, Mekhonoshin and Zhelyu Vladimirov. 2007. A Global University For A Global Village. Paper prepared for a special issue of the Cultural Studies/Cultural Methodologies Journal. UN-Habitat. 2006. State of the World’s Cities 2006/7. <http://www.unhabitat.org/content.asp?cid=3397&catid=7&typeid=46&subMenuId=0> UN-Habitat. 2008. State of the World’s Cities 2008/9-Harmonious Cities.<http://www.unhabitat.org/content.asp?cid=5964&catid=7&typeid=46&subMenuId=0> UN-Habitat. 2009. Global Report on Human Settlements 2009 - Planning Sustainable Cities. Wagner, Caroline S. and Loet Leydesdorff. 2005. Network structure, self-organization, and the growth of international collaboration in science. Research Policy, 34: 1608-1618. Wagner, Caroline S. and Loet Leydesdorff. 2006. Measuring the globalization of knowledge networks. Presented at Blue Sky II Forum 2006: What Indicators for Science, Technology and Innovation Policies in the 21st Century?, Ottawa, Ontario, Canada.
NOTES* Asli Ceylan Oner, School of Urban & Regional Planning, Florida Atlantic University, Fort Lauderdale, Florida, e-mail: aoner@fau.edu ** Diana Mitsova, School of Urban & Regional Planning, Florida Atlantic University, Fort Lauderdale, Florida, e-mail: dmitsova@fau.edu *** David Prosperi, Florida Atlantic University, FAU/BCC Higher Education Complex, Fort Lauderdale, Florida, e-mail: prosperi@fau.edu **** Jaap Vos, School of Urban & Regional Planning, Florida Atlantic University, Fort Lauderdale, Florida, e-mail: jvos@fau.edu, URL: http://www.fau.edu/durp/faculty/jvos.html
Note: This Research Bulletin has been published in Journal of Knowledge Globalization, 3 (1), (2010), 2-30 |
|||||||||||||||||||||||||||||||||||||||||||||||||||||||||||||||||||||||||||||||||||||||||||||||||||||||||||||||||||||||||||||||||||||||||||||||||||||||||||||||||||||||||||||||||||||||||||||||||||||||||||||||||||||||||||||||||||||||||||||||||||||||||||||||||||||||||||||||||||||||||||||||||||||||||||||||||||||||||||||||||||||||||||||||||||||||||||||||||||||||||||||||||||||||||||||||||||||||||||||||||||||||||||||||||||||||||||||||||||||||||||||||||||||||||||||||||||||||||||||||||||||||||||||||||||||||||||||||||||||||||||||||||||||||||||||||||||||||||||||||||||||||||||||||||||||||||||||||||||||||||||||||||||||||||||||||||||||||||||||||||||||||||||||||||||||||||||||||||||||||||||||||||||||||||||||||||||||||||||||||||||||||||||||||||||||||||||||||||||||||||||||||||||||||||||||||||||||||||||||||||||||||||||||||||||||||||||||||||||||||||||||||||||||||||||||||||||||||||||