GaWC Research Bulletin 362 |
|
|
|
This Research Bulletin has been published in B. Derudder, M. Hoyler, P.J. Taylor and F. Witlox (eds) (2012) International Handbook of Globalization and World Cities Cheltenham, UK, Northampton, MA, USA: Edward Elgar, pp. 162-176. Please refer to the published version when quoting the paper.
IntroductionThis chapter examines office markets in global cities and, in particular, international financial centres. The early world city literature focussed on classification (Friedman, 1986) or on a small number of global cities and on inequalities within them (Sassen, 1991). More recent work focuses on linkages between cities, drawing on theoretical approaches such as Castells' (1996) Space of Flows'. Empirical work in this tradition is exemplified by the Globalisation and World Cities (GaWC) research network, which explores the connections between cities (e.g. Taylor, 2005). Those connections relate to exchange of information and human capital within and across firms and establishment of trust relationships, emphasising knowledge creation and processing and advanced producer services (Hall & Pain, 2006, Cook et al., 2007). While the emphasis on flows and relationships is critical, the bulk of the activities that form these linkages take place in offices indeed much of the GaWC connectivity measures rely on identification of the office networks of high order service firms. Offices, by their fixity, ground flows in particular locations. They are not simply passive receivers and transmitters: office markets shape cities, direct firms to particular locations and create path dependency (in that a critical mass of office stock creates the breadth of business activities that drive agglomeration economies). Further, they are an investment asset, a store of value and a significant part of institutional and private investment portfolios. As assets, they act as collateral for bank lending and real estate securities. Thus, they link global cities to international capital markets and expose cities to the volatility of global finance. In the global cities literature, financial activity is seen as a key function. What makes a city a financial centre? Kindelberger (1974) provided an early definition of international financial centres, focusing on their role in effecting payments and transferring savings around the economy: the specialized functions of international payments and foreign lending or borrowing are typically best performed at one central place that is also (in most instances) the specialized center for domestic interregional payment'. (Kindelberger, 1974, p. 6). An international financial centre (IFC) will have a greater concentration of cross-border activity than a domestic financial centre, but it is not clear where the boundary lies or whether it is the scale or the proportion of international activity that is critical (for example Tokyo in the modern era and New York historically were dominated by domestic transactions and capital). It is possible to identify IFC indicators and attributes: global ranking in financial activities, headquarters of multinational financial firms, the presence of foreign financial firms in the city. Research generally leaves the definition open and examines the activities and characteristics of leading cities: a financial hierarchy to mirror the world urban hierarchy. There is ample evidence that international financial activities are strongly concentrated in particular cities. In ranking lists, some cities dominate niche areas (Geneva, Zurich for wealth management, for example) but are less prominent in others; but a handful of key cities are highly ranked in most financial sectors. A number of global rankings exist. In each, rankings vary slightly, depending on criteria used and datasets employed. Those based on survey work may carry cultural or linguistic biases, but there is strong common ground. In this chapter, the rankings produced by Z/Yen using their Global Financial Competitiveness index (GFCI) are used. The GFCI combines quantitative indicators of market share, qualities (labour market, infrastructure, available services) and openness (transparency, regulatory and tax structure etc.) with survey data on competitiveness as a business location. Table 1 shows the top ten cities in the seventh GFCI (Z/Yen, 2010), alongside the top ten cities in the MasterCard Worldwide 2008 survey and the World According to GaWC 2008. The list contains few surprises. Paris is not ranked in the top ten and the high ranking of both Swiss centres (reflecting their private fund management status) may be unexpected. Tokyo - regularly placed alongside London and New York (and sometimes Paris) as a dominant world city - is ranked fifth, reflecting concerns about its openness to foreign businesses operating there and the aftermath of the bursting of the Japanese asset bubble in the 1990s. Shenzen appears over-ranked (and was absent from earlier indices). The full list of financial centres includes offshore centers (Hamilton, Bermuda, for example) whose significance greatly exceeds their size or prominence as cities, and emerging centres such as Dubai. Table 1: Global City Classifications, Financial Cities. Sources: Z/Yen (2010), MasterCard Worldwide (2008), GaWC (2008).
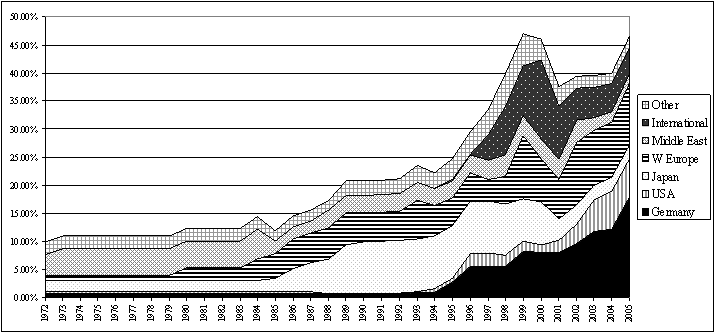
The remainder of the chapter focuses on commercial real estate investment and on major city office markets. The next section examines global real estate investment flows, demonstrating that they are strongly concentrated in both office markets and global cities. Next, urban office dynamics are examined: it is argued that the linkage between space, investment, supply and finance markets is amplified in international financial centres, which are characterised by their functional specialisation. This exposes cities to shocks a vulnerability coordinated across cities. Evidence for this is provided by examining office market behaviour in the aftermath of the 2007-2008 liquidity crisis. Finally, policy implications are drawn. Capital flows and global real estate investmentWhile advanced producer services have become increasingly international in nature (and concentrated in global cities), real estate investment in developed economies remained predominantly local and domestic for much of the latter decades of the 20 th century. There was cross-border investment, notably by Japanese investors in the bubble era and by mainland-European investors including Dutch and Swedish institutional investors (constrained by the size of their domestic markets) and by German open-ended funds, freed from regulatory constraints. However, information advantages for domestic investors, the additional costs of monitoring and of hedging exchange rate risk and the problems faced in diversifying international holdings limited growth in global markets. Innovation in real estate investment vehicles from the 1990s transformed the market. Alongside the spread of tax-efficient listed Real Estate Investment Trusts, the late 1990s saw rapid growth of private real estate funds that allowed global investors to pool capital and invest in non-domestic markets. INREV figures show the number of private real estate funds in Europe rising from less than 100 in 1998 to some 650 in 2008, those funds managing assets in excess of €300billion. Baum (2008) suggests that the value of unlisted real estate funds in Europe grew 10% per annum between 1997 and 2007, with more recent explosive growth seen in Asian and emerging markets. Fund structures and investment styles varied but the net effect was to make it simpler for investors to build global real estate portfolios. Many new global funds utilized debt to increase both assets under management and promised returns for investors. That leverage linked funds to global credit markets and increased investment risk: trading off higher volatility for higher expected returns. There are few robust statistics of global commercial real estate investment; those sources do not offer long time series. Data from the early 2000s show the rapid increase in overall volume of investment activity and the share of that activity that is global in nature. Jones Lang LaSalle figures show private commercial real estate transactions rising from $350billion in 2003 to $759billion in 2007; within those figures, cross-border deals rose from $90billion to $357billion. In the global liquidity crisis, overall transaction volumes dropped: by 50% between 2007 and 2008, and by a further 44% between 2008 and 2009. By 2009, domestic investors were again in the ascendancy. However, in the credit crunch, many global real estate recovery funds raised equity intending to buy as the market turned or acquire distressed assets from banks. As the global market recovers unevenly, international investment levels are likely to be restored. As an example, Lizieri & Kutsch (2006) reveal a marked shift in global ownership of City of London offices. Until the mid-1980s, international ownership remained remarkably stable, at between 10% and 15%. The proportion of non-UK ownership began to increase in parallel with financial deregulation across the late 1980s, reached 25% in the second half of the 1990s and, by 2005, exceeded 45%. The late 1990s saw the appearance of international investment offices purchased by funds with equity from a diverse mix of nationalities and investor types. It is difficult to obtain comparable figures for other markets but global capital flow increases suggest London was not unique in experiencing a globalization in ownership. Property Funds Research's (2008) survey of global fund managers reports that, of 107 funds surveyed (with over €1trillion of property assets under management), 38% had 10% or more of their assets spread across more than one continental region. Figure 1: Non-domestic office ownership, City of London.
The Importance of IFCs in Global Real Estate InvestmentIn principle, real estate investors should seek diversification in their real estate portfolios. Geographical diversification involves selection of properties in different regions (or countries), sectoral diversification involves acquisition of buildings of different types, industrial, office, retail, apartments or hotels. Again, in principle, the growth of Real Estate Investment Trusts (REITs) and private real estate funds should permit greater diversification, with investors able to gain exposure to, say, Asian industrial markets or emerging Eastern European retail. However, the markets targeted by larger funds appear to be more traditional in nature. To what extent is global real estate capital investment concentrated in office markets and in global cities? While it is difficult to obtain accurate data on stock of space, the importance of IFCs in global capital market activity can be gauged from flow data. Real Capital Analytics (RCA) data for the top 1,000 commercial real estate deals by value in 2007 and in 2008 demonstrates concentration of investment activity, despite the expanding global arena for investment. The cleaned RCA data contains 1,979 deals with a total value of $527billion. By value, 49% of the deals were office acquisitions, with a value of $257billion and floor space in excess of 437 million square feet. The RCA data identifies the location of each deal. Table 2 shows the cities with the most deals for all property and for offices. The concentration is striking: 50.2% of the major deals took place in just ten cities, over 40% in just five cities. Office investment is more concentrated still: 55% of the largest office deals were in ten cities, 44% in five cities and nearly 30% of the deals took place in London or New York. Table 2: Commercial real investment by city: 2007-2008.
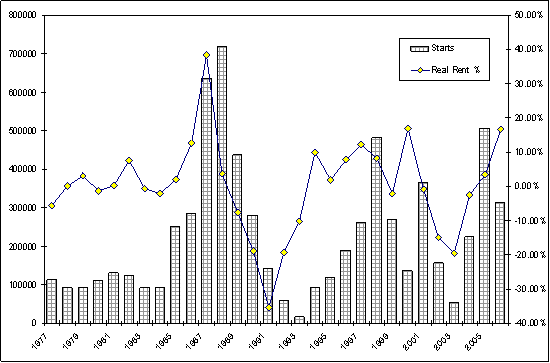
Source: Author, from RCA data, ©2008 Real Capital Analytics, Inc. All rights reserved. It is evident that many of the cities dominating global real estate investment activity are IFCs. 64% of total deals and 72% of office deals took place in those cities ranked as IFCs by Z/Yen. Excluding highly-ranked offshore financial centres such as the Cayman Islands, Jersey or the Isle of Man, 37% of the value of all property deals and 56% of all office deals were located in the top twenty IFCs. Office investment activity is strongly correlated to financial market strength: there is an 0.6 correlation between office investment value and the city's score on the GFCI. As a further indicator of the globalization of property investment, the top thousand deals (which, in total, represent over 80% of all sales by value) were analysed and the head office of the acquiring investor identified1. Of these large deals, 44% of all trades ($189billion) and 38% of office sales ($74billion) were cross-border. Nearly a quarter of all office sales was cross-border and took place in a top-ranked IFC. 50% of buyers were based in top ten international financial centres, a further 10% of buyers were in IFCs ranked 11-20, with less than a third of buyers not having a headquarters in a global financial centre. From these results, it is evident that despite the trend towards global property funds and diversified property holdings, real estate investment activity and office market activity in particular remains strongly concentrated geographically in a small number of cities the majority of which are global financial centres. The leading IFCs dominate office investment, with some $100billion of major office sales in London, New York, Frankfurt and Tokyo alone across 2007 and 2008. This emphasizes the importance of the IFCs to real estate investment. Understanding office market dynamicsThe behaviour of office markets derives from the interaction of four market types: the occupier or space market; the development or supply market; the investment market; and the market for real estate finance. These markets notably the space market and the developer market have tended to be analysed in isolation. However, the linkage between markets is critical to understanding risk-return relationships and the interface with capital markets that assumes critical importance in credit booms and financial crises. In global cities and in financial centres, the markets may be more strongly linked than in second-tier and non-financial cities, with consequences for the volatility of office markets in those cities. In the space market, occupiers seek offices for their business activities, paying rent that reflects the profitability of operating in a particular location access to resources, labour markets, customers and the agglomeration economies available from co-location: competition between users determines rent levels. Standard models, however, tend to assume away the supply of that space property is seen as a derived demand, delivered as required. However, supply of space is more complex. There is path-dependency (the existing stock of space constrains the activities of developers), an institutional context (the role of planning regulation, for example) and a decision-making process that must balance cost of development with the reward, the value of the completed development. Developers face uncertainty, since time to build may be lengthy and demand for space may change over that period. There are asymmetries in the relationships between rents and supply, since developers can build more space but, once built, offices cannot simply be withdrawn in response to negative demand shocks (Englund et al., 2008, Hendershott et al. 2010). In most major office markets, supply of space is not smooth, nor does it seem to react to anticipated rent. Rather, periods of intense building activity surrounded by periods of inactivity are observed (as in Figure 3, showing supply in the City of London). Moreover, construction starts lag real increases in rent. If fluctuations in demand allied to short term inelasticity in supply produce rental fluctuations, this pronounced building cycle' is likely to result in extreme swings in rents and capital values. While the cyclicality of office markets is often cited as indicating irrational behaviour by developers and lenders, a developing body of work seeks to combine real options models and game theory to explain the behaviour of economic agents in the development process. These models focus on the decisions of individual developers faced with future uncertainty and volatility. Perhaps the most complete formulation is found in Grenadier (1995, 1996). Grenadier seeks to explain why development is clustered and why developers develop into recessions, despite declining occupational demand and building values. He shows that strategies adopted by developers depend on starting conditions in the market, on volatility of demand and on time to construct. Development cascades with developers rushing to develop simultaneously occur in particular where volatility of demand is high. Volatility increases the option value of waiting but once conditions favour development, all developers race to build. Developers are prone to build defensively when demand signals falter, for fear of being shut out of the market if competitors do build. Grenadier's model is theoretical in nature but, nonetheless, captures many of the features observed in real estate development. It also suggests that cycles will be more pronounced in markets characterized by high employment volatility (for example, where there is strong functional specialisation in economic activity); where the time taken from start to completion is long (for example, in densely developed urban centres); and where there are entry barriers for development (for example, where the cost of development and access to capital excludes smaller developers). All these characteristics apply to the office markets of global cities. Figure 2: Office construction and real rents.
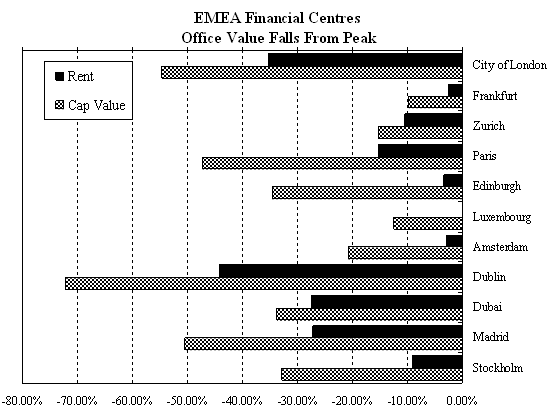
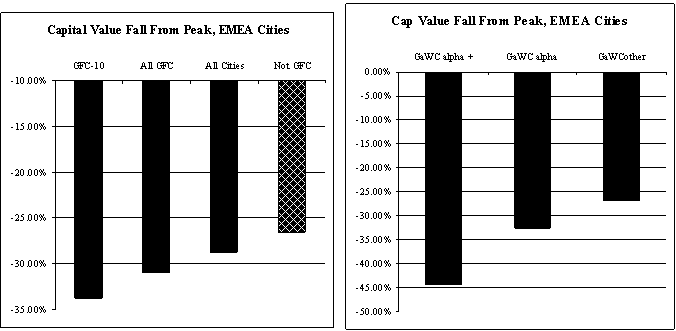
Developers react to rents and anticipated capital values, providing linkage to the real estate investment market. Investors acquire real estate for its cashflow characteristics which combine bond-like contractual rental income and equity elements in anticipated rental and capital value growth. Formally, the value of a building is the discounted value of anticipated future cashflows. That discount rate is determined by the cost of capital required return on equity, marginal cost of debt and the debt-equity ratio. Investment values are thus bound to credit availability. The rise in real asset values seen across mature economies before the credit crunch was, in large measure, driven by a capital glut, competition between lenders driving down interest rates and forcing banks to relax loan terms. Development, too, is linked to credit availability, access to finance for projects2. Development activity alters the stock of space, relative to demand, which determines rents, closing the circle. Global office markets and systemic riskThis section broadly follows the arguments in Towers of Capital (Lizieri, 2009) and in Lizieri et al. (2000) in suggesting that office markets in global cities and international financial centres have characteristics that tend to reinforce cyclical behaviour and volatility in rents and capital values. In essence, I argue that development, investment, space and financing markets are locked together within financial centres and across financial centres, suggesting both greater amplitude in cycle and potential coordination of cycles across cities. This can then feed back into the capital markets, creating systemic risk. Having set out the main arguments, some preliminary evidence from the market corrections following the global liquidity crisis is presented. Lizieri et al. (2000) argue that the distinction between the funding of real estate development, ownership of real estate as an investment and occupation of property has become blurred. They describe an integration of property and financial markets and argue that this creates systemic risk as shocks in one area of the property market are transmitted throughout the system. This is seen most clearly in global cities and financial centre office markets. The scale of developments demands complex finance and funding arrangements provided by major banks, finance houses and institutional investors. Those same financial firms are the occupiers of space, as owners or as tenants. Thus rents and capital values are linked to the fortunes of international financial firms and their demand for space. It is those same firms that invest in offices in financial centres directly by acquisition for their investment portfolios, indirectly through investment in real estate funds, by holding shares of property companies owning the buildings or by investing in securitised debt products backed by office values. Those investments are significant parts of the asset base of the financial firms and act as collateral for their operational activities, including property lending. Thus occupier, supply and investment markets are locked together. Evidence for concentration of financial occupation is not easy to obtain. While global financial centres exhibit high concentrations of financial services activity compared to other cities, detailed employment statistics tend to be available only at metro level, with sub-market data for central business districts rarely available. Further, many specialised business service activities in IFCs are tied into financial activity, Thus, New York City, only 15% of employment is classified to finance, insurance and real estate, with a further 16% in professional or information services; similarly in metropolitan Frankfurt, 15% of employment is in financial and credit institutions, with a further 26% in real estate, leasing and business activities. London is unusual in that its major financial district, the City, forms a separate administrative area. It provides strong evidence of the extent of concentration. In 2008, Corporation of London figures show financial services share of employment at 45%, with 76% of employment in business and financial services (firms such as Reuters and Bloomberg and international law firms focussed on financial activity being classified as business services). The Canary Wharf office cluster is similarly concentrated, with the shares of finance and finance and business services being, respectively, 55% and 70%. Lizieri and Kutsch (2006) show that 44% of office space in the City of London is simultaneously owned and occupied by financial service firms, 77% of space simultaneously owned and occupied by financial and business service firms, the majority of which will have an international orientation. Financial innovation in real estate increases that lockstep. Globalization of financial activity leads to increasing functional specialization in financial centres, with many domestic-focused firms squeezed out of the market by international financial service or associated professional service firms. Globalization of ownership means that professional investors based in one financial centre typically have exposure to real estate in other centres. Innovations in investment make it easier to acquire a global real estate portfolio, with capital from multiple investors pooled to acquire prime property. Greater use of debt in these vehicles, facilitated by securitization and capital market lending, increases gearing and, hence, implicit volatility of real estate. Finally, purchase of debt securities by financial firms brings further exposure to real estate risk. This process of lockstep is important in the context of the volatility of global capital markets. In many global city office markets, demand for space is driven by the employment needs of financial firms which, in turn, is driven by the behaviour of international financial markets. Demand shocks are thus likely to occur in a coordinated fashion across the major IFCs. Integration of occupational, asset and development markets means that demand shocks (positive or negative) are reinforced. A downturn in global capital markets reduces financial firms' demand for space, putting downward pressure on rents. This affects capital values and returns, damaging the performance of investment portfolios. Falling rents and capital values and rising vacancy rates put pressure on borrowers, increase the risk of debt instruments and depress the value of debt securities held as an asset and used as collateral. This affects the profitability of financial firms, depressing their demand for space. The converse applies to positive shocks driven by booming capital markets. Larger firms based in financial centres capture greater market share and seek to expand, placing upward pressure on rents; rising property prices enhance asset values and encourage lending and development, with the additional activity enhancing short term profitability. By implication, this suggests that the amplitude of cyclical fluctuations in IFCs will be higher and peaks and troughs will be coincident. Evidence of common movement of office markets across financial centres was provided in Towers of Capital. Correlation in rental movements was found to be higher between major financial centres than between cities not dominated by finance, while a component analysis of rental variance identified a strong global factor explaining some 40% of the variation in rents, with major financial centres loading strongly on that factor. Weaker evidence of coordinated development cycles and linkages between employment change was found. The financial turmoil of the credit crunch provides a further opportunity to test the prediction of coordinated crises. Given data issues, analysis is, perforce, exploratory rather than definitive. Figure 3 shows changes in office rental and capital values for those European and Middle Eastern cities tracked by real estate consultants CBRE that are highly ranked in the GFCI. Falls in value are shown from the peak values post-2004 to the lowest value up to Q4 2009. Markets differ in their turning points both entering the downward correction and in showing signs of recovery. However, all cities show falls, in most instances substantial. Timings varied: some markets notably London fell early and sharply. Others lagged, with appraisers reluctant to mark values down. This, in part, may explain lower apparent falls in Frankfurt, Zurich and Geneva (where there was also a less pronounced rise in values). Capital value falls are greater than rental value falls, emphasising the importance of investment markets and credit in maintaining and bursting asset bubbles. It is worth stressing the wider implications of these value falls. Much of the real estate acquisition activity in the period immediately before the credit crunch was by funds using a mixture of debt and equity; much of that activity was in global city offices. For a fund with a mix of 60% debt and 40% equity, a 30% fall in capital values equates to a 75% loss of equity capital. Many real estate funds and property companies breached their loan to value covenants, defaulted or struggled to renegotiate debt3. Similar falls are observed in non-EMEA markets. CBRE total office occupancy costs for world cities show widespread falls from peak values: -27% in New York, -19% in Shanghai, -33% in Tokyo. Investors who had built international property portfolios focused on major city office markets did not get diversification when they most needed it, when confronted with turbulent market conditions. It is clear, then, that values fell sharply across most global financial centres. Did they fall more in financial centres? Figure 4 shows capital value falls reported by CBRE for 64 EMEA cities, grouped by type of city. The largest falls are in financial cities ranked in the top ten by Z/Yen, while unranked cities show lower falls. As striking are the falls arranged by GaWC classification, where GaWC alpha plus cities fall fastest (averaging -44%), with GaCC alpha cities as a whole showing sharper falls (-33%) than lower category cities (-27%). Figure 3: Office value falls 2005 - 2009.
Figure 4: Capital value falls by city type.
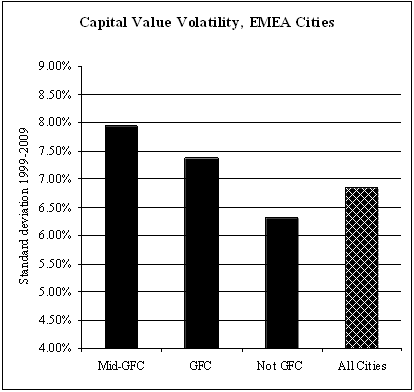
Figure 5 examines capital value volatility in office markets by type of city. Offices in financial centres would be expected to have experienced greater increases in value in the first half of the 2000s, and sharper falls in the market correction. Broad confirmation is provided, with volatility in annual returns between 2000 and 2009, proxied by the standard deviation, being higher in global financial centres. Mid-ranked IFCs exhibit higher volatility than larger cities. This opens up an interesting new area of research. It may be that the sheer scale and critical mass of the largest centres offers some protection, while smaller centres dependent on global financial markets may be more vulnerable to shocks. To some extent, though, higher volatility relates to a small number of cities showing extreme price movements, notably Moscow and Johannesburg. Higher volatility is not compensated by higher average growth rates. Figure 5: Capital value volatility by city type.
Conclusions and policy implicationsOffice markets are not simply a by-product of demand for space from producer services firms. They are an investment asset and store of value; they help determine demand; and they expose cities to volatility in global capital markets. This will be particularly true for offices in international financial centres, where space, supply, investment and financial markets are locked together by functional specialisation in economic activity, financial ownership of space and the provision of equity and debt for investment and development. Cities specialising in financial activity are likely to exhibit volatility in office rental and values that is linked to the credit cycle and the behaviour of global capital markets. For global real estate investors, this has significant implications. A key motivation for an international investment strategy is diversification. However, diversification benefits are generally demonstrated with reference to securitized real estate assets or to national indices of real estate market performance. Direct private real estate investment happens in cities and much of that investment takes place in financial centres bound together by the flows and fortunes of global finance. This creates exposure to common patterns of volatility and to systemic risks of contagion in financial crises. An international real estate investment strategy with a significant component of global financial centre exposure may fail to deliver diversification when it is most required. For investors, then, the key lesson here is the need for smart diversification. Geography alone does not provide diversification. What matters is the factors that drive return and risk demand for space that determines rents, investment and capital flows that influence the development cycle and property yields. A global investment strategy, then, needs to seek properties in other sectors, in cities with a varied employment base and with a different set of return drivers. Innovations in finance and the growth of international property funds allow investors the opportunity to build portfolios that are efficiently diversified but, with many funds still heavily exposed to big city offices, great care is necessary in choice of vehicles and target markets. There are wider implications, too, for urban development and city planning. Many city managers, seeking to enhance the competitiveness of their cities, have encouraged redevelopment of CBDs and creation of financial services clusters. In so doing, they tie their cities' fortunes to the ebb and flow of global capital markets. There are benefits from such a strategy, with inflows of capital and employment. Yet there are clear downsides, too, in the inherent volatility that follows and in the fragmentation of ownership that global property investment often brings. Strategies that emphasise diversity of employment structure, that encourage non-financial clusters as a counterbalance, may help to protect cities from the periodic crises that seem to affect global financial cities. REFERENCESBaum, A.(2008), The Emergence of Real Estate Funds', in Peterson, A (ed.), Real Estate Finance: Law, Regulation and Practice, London, LexisNexis Brunnermeier, M. (2009), Deciphering the Liquidity and Credit Crunch 2007-2008, Journal of Economic Perspectives, 23, 77-100. Castells, M. (1996), The Rise of the Network Society: The Information Age, vol I, Oxford: Blackwell. Cook, G., Pandit, N., Beaverstock, J., Taylor, P. and K Pain (2007), The Role of Location in Knowledge Creation and Diffusion', Environment and Planning (A), 39, 1325-1345. Englund, P., Gunnelin, A., Hendershott, P. and B Soderberg (2008), Adjustment in Commercial Property Space Markets: Taking Long-term Leases and Transaction Costs Seriously', Real Estate Economics 36: 81-109. Friedmann, J. (1986), The World City Hypothesis', Growth & Change, 17, 69-83. GaWC (2008), The World According to GaWC 2008', Globalization and World Cities research network, http://www.lboro.ac.uk/gawc/world2008t.html Grenadier, S.R. (1995), The persistence of real estate cycles', Journal of Real Estate Finance and Economics, 10, 95119. Grenadier, S.R. (1996), The Strategic Exercise of Options: Development Cascades and Overbuilding in Real Estate Markets', Journal of Finance, 51, 1653-1679. Hendershott, P., Lizieri, C. and B MacGregor (2010, forthcoming). Asymmetric Adjustment in the London Office Market', Journal of Real Estate Finance and Economics, forthcoming, published online August 2009. Kindelberger, C. (1974), The Formation of Financial Centers: A Study of Comparative Economic History, Princeton Studies in International Finance, 36, Princeton University. Lizieri, C. (2009), Towers of Capital, Oxford: Wiley-Blackwell. Lizieri C., Baum, A. and P. Scott (2000), Ownership, Occupation and Risk: A View of the City of London Office Market', Urban Studies, 37 (7) 1109-1129 Lizieri, C and Kutsch, N. (2006) Who Owns the City 2006: Office Ownership in the City of London Reading, University of Reading Business School and Development Securities plc, pp. 27 + iii MasterCard Worldwide (2008) Worldwide Centers of Commerce Index 2008, MasterCard Worldwide, New York. Pain, K. and P. Hall. (2008) Informational Quantity Versus Informational Quality: The Perils of Navigating the Space of Flows, Regional Studies, 42, 1065-1077 Sassen, S. (1991), The Global City, Princeton: Princeton University Press. Taylor, P J (2005), Leading world cities: empirical evaluations of urban nodes in multiple networks', Urban Studies 42, 1593-1608 Z/Yen (2010) Global Financial Centres Index 7, Corporation of London, London NOTES* Colin Lizieri, Department of Land Economy, University of Cambridge, email: cml49@cam.ac.uk 1. This was no easy task, with a number of private funds being impossible to locate while many others were local subsidiaries of non-domestic parent investors. The figures cited here are, thus, an underestimate. 2. While it falls outside the scope of this paper, it is important to stress the role that asset values play in credit bubbles. Real estate is used as security in lending: excess lending drives up asset values, which provides collateral for more lending. Once values begin to fall, a downward spiral sets in, creating liquidity and capital crises see Brunnermeier (2009) for a review. 3. Readers thinking serves them right might recall that these investments could well be in your pension funds.
Note: This Research Bulletin has been published in B. Derudder, M. Hoyler, P.J. Taylor and F. Witlox (eds) (2012) International Handbook of Globalization and World Cities Cheltenham, UK, Northampton, MA, USA: Edward Elgar, pp. 162-176. |
|||||||||||||||||||||||||||||||||||||||||||||||||||||||||||||||||||||||||||||||||||||||||||||||||||||||||||||||||||||||||||||||||