GaWC Research Bulletin 356 |
|
|
|
This Research Bulletin has been published in Journal of Urban Affairs, 33 (2), (2011), 167-184. doi:10.1111/j.1467-9906.2010.00538.x Please refer to the published version when quoting the paper.
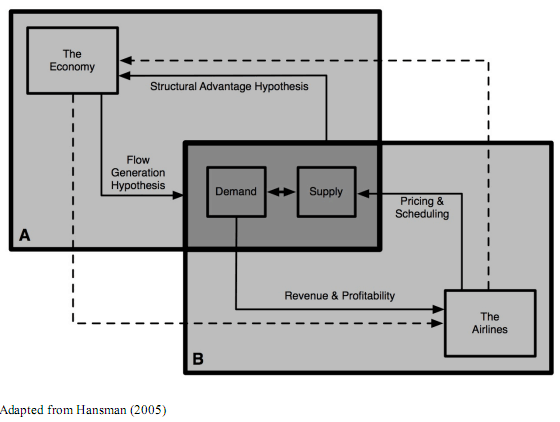
Scholars from a range of disciplines have long recognized that a citys economic fortunes are closely tied to its position in networks of interurban exchanges, with cities occupying more central positions experiencing relatively greater growth and stability. This insight has formed the core of several influential theoretical approaches to understanding urban economic development, including central place theorys transportation principle (Christaller, 1933), human ecologys conceptions of metropolitan dominance and interdependence (McKenzie, 1933; Bogue, 1949; Hawley, 1950), and most recently the spaces-of- flows perspective on globalization (Friedmann, 1986; Sassen, 1991; Castells, 1996). However, in each of these cases, conclusions concerning the relationship between a citys centrality in the network and its economic success have been associational rather than causal. It remains unclear whether cities occupy a central position in the network because they are sites of significant economic activity (i.e. a flow generation hypothesis), or whether they experience greater economic growth because they occupy a central position in the network (i.e. a structural advantage hypothesis). Identifying the direction of influence in this relationship has taken on particular significance given a recent focus on infrastructure development as a strategy for employment growth in policies like those favored by the American Recovery and Reinvestment Act. This paper seeks, first, to document the spatial restructuring of one intercity network the business air travel network that has taken place over the last 15 years. Second and more importantly, it aims to separate cause from effect by separately testing the structural advantage and flow generation hypotheses, thus answering the question: does centrality in the network create more jobs, or do higher levels of employment lead to greater centrality in the network? Specifically, annual air traffic patterns and total non-farm employment in 128 US metropolitan areas from 1993 2008 are examined using a series of lagged regression models designed to evaluate the direction and strength of the causal relationships between employment and network centrality. The data used here overcome limitations of those used in earlier studies by focusing only on business passengers origins and destinations, while ignoring such potentially irrelevant factors as leisure passengers and layovers. Additionally, unlike prior explorations of the centrality-employment relationship, the analyses employed below allow examination of changes in the strength of this relationship over time. This paper is organized in four sections. The first section discusses the rationale for the flow generation and structural advantage hypotheses, and reviews prior empirical work that has tested them. The second section describes the methodology employed in this study, with a focus on the approach used to define intercity exchange networks and on a set of proposed models designed to test a prediction-based conception of causality. The third section presents a descriptive account of the spatial restructuring of the intercity business network, then uses a series of lagged regression models to test the causal direction of the relationship between centrality and employment. The final section discusses these results, highlighting their policy implications and directions for future research. BACKGROUNDLinking cities economic characteristics to their positions within patterns of exchange has a long history, with an equally long list of ways that the concept of exchange or network has been operationalized. Indeed, researchers have demonstrated associations between cities economic structures and their positions within networks of banking relationships (Conzen, 1977), information flows (Pred, 1973; Mitchelson and Wheeler, 1994), commodity trade (Eberstein and Frisbie, 1982; Eberstein and Galle, 1984), command and control among corporate headquarters and subsidiaries (Ross, 1987; Alderson and Beckfield, 2004), and advanced producer service firms (Sassen, 1991; Taylor, 2001). Among the multiple ways that such economically influential networks can be defined, perhaps the most attention has been devoted to transportation networks generally (e.g. Conzen, 1975), and more specifically to airline networks. The earliest studies examined intercity air traffic networks as an empire building strategy (Prince of Wales et al., 1920), then turned to explorations of its economic consequences as commercial aviation initially emerged in the 1950s (Taaffe, 1956) and was deregulated in 1978 (Goetz and Sutton, 1997). In the face of globalization and increasingly electronically mediated exchanges between businesses and cities, many have argued that intercity air traffic continues to be important (Keeling, 1995; Rimmer, 1998). Keeling (1995) identifies five reasons that airline linkages are significant: (i) global airline flows are one of the few indices available for transactional flows or inter-urban connectivity; (ii) air networks and their associated infrastructure are the most visible manifestation of world city interaction; (iii) great demand still exists for face-to-face relationships, despite the global telecommunications revolution; (iv) air transport is the preferred mode of inter- city movement for the transnational capitalist class, migrants, tourists, and high- value, low-bulk goods; and (v) airline links are an important component of a citys aspirations to world city status. (p. 118). Accordingly, studies of global city networks often focus on airline traffic patterns (Smith and Timberlake, 2001; Zook and Brunn, 2006; Taylor, Derudder, and Witlox, 2007). Although Keelings (1995) claims and these associated studies are framed in global terms, the notion that air traffic is economically significant is no less valid in sub-global contexts like the US urban system, where businesses continue to rely on face-to-face meetings. Similarly, compared to national urban systems in Europe, the geographic dispersion of US cities heightens the extent to which air transport is the preferred more of intercity transportation for a range of people and things. Thus, in addition to examining the structure of the intercity network itself both globally and nationally, several studies focused specifically on US cities have sought to identify correlates of cities positions within the network. Among the most consistently reproduced and frequently discussed findings in such studies is the positive association between centrality in the intercity network and employment: cities with heavier volumes of air traffic have more jobs (Taaffe, 1956; Brueckner, 1985; Goetz, 1992; Debbage and Delk, 2001; Neal, 2010). While researchers have repeatedly found this associational relationship between traffic and employment levels, the causal direction and underlying mechanism remains unclear. In this paper, I propose and later test two potentially complementary possibilities. First, a demand-based argument, which I denote as the Flow Generation Hypothesis, suggests that cities with high levels of employment, indicative of a robust economy, generate greater demand for interaction and thus acquire more central positions in the network. In the particular case of air transportation, businesses are likely to demand more frequent service to and from cities with strong economies. This demand may be generated by local businesses in the form of outbound business travel, as operatives fly to other cities to provide services, training, or support to subsidiaries and partners located elsewhere. Such demand may also be generated by non-local businesses in the form of inbound business travel, as clients from other places arrive to obtain services or as entrepreneurs seek new opportunities and locations. Following this historically dominant understanding of the relationship between traffic and employment, Duncan et al. (1960) argued that air transportation seems to have followed rather than to have re-shaped regional ties represent[ing] those activities which were already concentrated on large centers (p. 259, quoting Taaffe, 1952:157-58). Because the flow generation hypothesis holds that that centrality in the network of cities is an effect rather than a cause, it implies that intercity exchange networks cannot be strategically engineered to promote urban economic growth. In contrast, a supply-based argument, which I denote as the Structural Advantage Hypothesis, suggests that the supply of strategic resources (e.g. information carried by business travelers) is greater for businesses located in cities that occupy central positions in the network, which in turn provides such businesses with more opportunities for expansion and thus employment growth (Neal, 2008). This supply-side explanation for centrality inducing employment, or economic growth more generally, may be driven by multiple processes. Most directly, because centrality facilitates the diffusion of innovations (Rogers, 2003), businesses located in central cities are more likely to survive and grow due to the competitive advantage of greater and faster access to information (Porter, 2008). Second, because the flow of information and other resources through the network is mediated by central actors who act as gatekeepers (Burt, 1992), businesses in central cities can maintain their competitive advantage by controlling others access to information. Finally, because centrality means access to a diverse array of potential partners, businesses in central cities have more opportunities for exploiting scale economies in complementary relationships (Capello, 2000:1927). Because the structural advantage hypothesis identifies intercity exchange networks as a driver of urban economic growth, it suggests that efforts to aid economically struggling cities ought to consider such strategies as increasing the citys accessibility through infrastructure upgrades. While each hypothesis identifies a single causal direction of influence, it is possible that centrality and employment are reciprocally linked. Hansman has developed a schematic model of this relationship in the particular case of airline traffic (see Figure 1). The two dashed lines indicate the broad reciprocal relationship between the economy and the airline industry, but as this model illustrates, this relationship is mediated through a series of feedback loops. Transportation services provided by the airlines simultaneously facilitate and are facilitated by economic activities carried out in the economy, with airline passengers establishing the linkage between supply and demand in the middle. Studies of transportation economics often focus on the portion of the model contained in shaded region B, examining such issues as how route scheduling impacts profitability. In contrast, this study focuses on the portion of the model contained in shaded region A, asking whether air traffic generated in B is driven by economic activity (the flow generation hypothesis) or drives economic activity (the structural advantage hypothesis). Figure 1: Schematic of Reciprocal Relationship Between Air Traffic and the Economy.
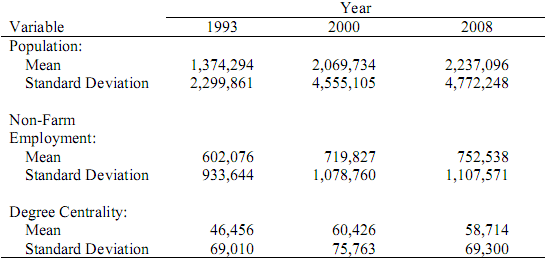
The limited number of prior studies that have aimed to uncover the causal direction of this relationship have found support for bi-directional influence, but conclude that air traffic has a greater effect on economic growth than vice versa (Irwin and Kasarda, 1991; Ivy, Fik, and Malecki, 1995; Button and Lall, 1999; Brueckner, 2003). However, these studies suffer from several limitations that challenge the robustness of their findings. First, approaches to measuring the connectivity of cities in the network are problematic. In some cases air traffic is not measured directly, but is inferred based on scheduled air service, which identifies cities as linked even if relatively few passengers travel between them (Ivy, Fik, and Malecki, 1995). This may be important to the extent that frequent air service is a key location factor for businesses, but it does not capture the supply or demand components identified as underlying mechanisms by the hypotheses under consideration. In other cases, air traffic is measured using total enplanements, which includes not only passengers originating from or traveling to a city, but also passengers who are merely waiting in the airport for a connecting flight (Button and Lall, 1999; Brueckner, 2003). While the former group potentially influences the local economy, the latter groups local economic influence likely is limited to the purchase of a meal in the airports food court (Neal, 2010). Second, the mechanisms specified by the flow generation and structural advantage hypotheses are driven by the behavior of businesses and business travelers. The former contends that businesses generate outbound flows of operatives and inbound flows of clients, while the latter argues that location at the confluence of passengers carrying useful information or resources provides businesses a strategic advantage. However, rather than focusing on the movement of business passengers, prior studies have examined the aggregation of all passengers, the majority of whom are traveling for leisure. This approach is problematic because business and leisure passengers carry unique resources (e.g. venture capital vs. spending money), and exhibit unique travel patterns with different typical origins and destinations (Neal, 2010). Finally, these studies examine four different periods and find four different magnitudes of the causal influence of air traffic on employment. However, because each study uses unique measurements and statistical methodologies, it is impossible to compare their results. Thus, it remains unclear from existing empirical work whether the extent to which urban employment is driven by centrality in the air traffic network is stable, rising, or falling. This is of particular significance if support for the structural advantage hypothesis is to have implications for policy aimed at urban economic development through infrastructure investment. A falling level of causal influence would suggest policymakers should seek alternative strategies, while a stable or rising level would justify the continued use of such approaches. This studys findings are expected to be consistent with those already reported: stronger support for the structural advantage hypothesis (i.e. centrality causes employment) than for the flow generation hypothesis (i.e. employment causes centrality). However, by avoiding these significant limitations, the analyses below will provide both a more theoretically motivated test of the relationship between air traffic and employment, and results with clearer policy implications. First, by ignoring layover stops on passengers itineraries, the focus is on travel patterns associated with the economic characteristics of cities, rather than those determined by the hub-and-spoke organization of airline routes. Second, by examining only the movement of business passengers rather than all passengers generally, attention is restricted to types of exchanges that are more theoretically relevant to economic growth. Finally, by examining time-series data that includes 15 separate waves, it is possible to examine changes in the causal relationships between centrality in the air traffic network and employment over time. DATA AND METHODSThe unit of analysis is the metropolitan area, hereafter referred to as cities, defined starting in 2000 using the Core Based Statistical Area (CBSA) and before 2000 using Primary Metropolitan Statistical Areas (PMSA) aggregated to correspond to the boundaries of the newer CBSAs. The sample includes all cities in the continental United States that were served by one or more airports that together enplaned at least 250,000 passengers in 2000 (N = 128, served by 145 airports). For each year from 1993 through 2008, estimated annual population was obtained from the U.S. Census Bureau (2000, 2009) and estimated total non- farm employment was obtained from the U.S. Bureau of Labor Statistics (2009). Table 1 presents descriptive statistics for the variables used in the models below population, employment, and centrality at the beginning, middle, and end of the study period. Below, I describe the longitudinal measurement of the US business network, and the approach used to examine the relationship between employment and centrality. Table 1: Descriptive Statistics (N = 128).
Measuring the US Business NetworkAir traffic data used to measure the exchange relations among these 128 cities were drawn from the Airline Origin and Destination Survey (U.S. Department of Transportation, 2009). This survey, derived from data reported by air carriers to the Office of Airline Information and released quarterly by the US Bureau of Transportation Statistics, provides details about a 10% random sample of all domestic commercial air travel, including major airlines, low-cost carriers, and charter services. This data is provided in three separate tables, linked by common identifiers, that reflect nested definitions of a trip and contain slightly different variables: coupon data corresponds to a single takeoff and landing, market data corresponds to all flight segments from origin to destination, and ticket data corresponds to an entire itinerary. The analyses below merge and use information from both the coupon and market data tables, including the date of travel, number of passengers, and fare. This data has been used primarily for regulatory and government purposes (i.e. airport construction/expansion), but it was the source of airline traffic data from 1950 and 1980 used by Irwin and Kasarda (1991). The Origin and Destination Survey is an ideal data source for examining urban networks because it captures actual exchanges between US cities, rather than scheduled flights. As a result, it reflects where passengers are going, rather than simply where they might go. Because there is not a one-to-one correspondence between cities and airports, two types of aggregation were necessary. First, when one city is served by multiple airports (N = 11), all passengers were aggregated at the city level. For example, passengers using either OHare (ORD) or Midway (MDW) airports are recorded simply as Chicago passengers. Second, when one airport serves multiple cities (N = 10), the two cities were collapsed into a single unit of observation. For example, because the Raleigh-Durham International Airport (RDU) serves both the Raleigh-Cary Metropolitan Area and the Durham Metropolitan Area, these two places were combined and treated as one city. Given the richness of this data, several different types of intercity networks could be constructed. Because such decisions impact the results of network analyses, they should therefore be theoretically informed. The first major decision in constructing a network from these data concerns what constitutes an exchange or linkage between two cities. A hub-spoke network defines the strength of the linkage between two cities simply as the number of passengers flying between them. In contrast, an origin-destination network defines the strength of the linkage between two cities as the number of passengers originating in one and completing their journey in the other, without regard to any intermediate stops (i.e. layovers, connections) between them. The hub-spoke approach is problematic because it artificially inflates hub cities centrality based on passengers who are just passing through, and thus are unlikely to play a role in the local economy (Neal, 2010), although Derudder, Devriendt, and Witlox (2007) have suggested that such distortions can be empirically estimated when origin-destination data is unavailable. Fleming and Hayuth (1994) similarly argue that because centrality in a hub-spoke network depends on transportation carriers individual corporate choices, rather than a citys economic conditions, it can therefore be quite a transitory and artificial characteristic that generates activity of great operational significance to airports (p. 18, emphasis added). Because this study is concerned not with employment growth in airports, but rather in cities generally, the origin-destination approach to defining the network is used. The second major decision in constructing the network concerns which passengers to include. The majority of air travel is taken for leisure or personal reasons, but the hypotheses identify mechanisms that are primarily driven by business passengers. Individuals traveling on business might be attracted toward economically booming cities (i.e. flow generation), or alternatively high volumes of business travel bring resources to cities through which they may gain an economic advantage (i.e. structural advantage). Therefore, it is essential that analyses of the relationship between air traffic and employment focus on networks of business passengers, rather than on networks of leisure passengers or of all passengers in general (Faulconbridge and Beaverstock, 2008). Although the Origin and Destination Survey does not indicate which passengers are traveling for business, Neal (2010) has developed a method for using information available in this data to infer passengers travel purpose and construct proxy assignments of specific passengers as business passengers. To be sure, the characteristics of business passengers are varied, and in some cases similar to those of leisure passengers (Dresner, 2006). Additionally, the relationship between work and tourism is complex (Lassen, 2006), with overlapping categories such as travelling workers and working tourists (Uriely, 2001). However, this approach seeks to identify only the most quintessential business passengers, like those parodied by George Clooney in the recent movie Up In the Air, for whom speed and efficiency trump cost and companionship. Two pieces of information present in the data the number of individuals traveling on the single itinerary and the fare paid are used to identify such passengers, with those meeting two criteria flagged as likely business passengers. First, to exclude such common leisure passengers as families and couples, only passengers who are traveling alone are included. Second, to focus on those who must travel on specific dates, at specific times, on short notice, or who opt for a premium cabin class, only passengers who paid significantly more (a =.05) than the average passenger flying the same route in the same quarter are included. As a proxy measure, this approach has some limitations. For example, it fails to identify as business passengers those who do not have expense accounts at their disposal (e.g., academics, non-profit workers). Similarly, it may misclassify those who bring work with them on vacation or those whose employers, to cut costs, book business travel using low-cost carriers. However, despite its limitations, it offers advantages over the alternatives. First, it restricts the focus to a specific type of exchange (here, business exchanges) identified as the key mechanism by the hypotheses under consideration. Second, by using individuals actual willingness to pay rather than passengers cabin class, it more accurately classifies as business travelers those who purchase unusually high-cost (e.g. last-minute) tickets in coach class, but not those who find unusually good bargains (e.g. using frequent flier miles) on upgraded seats. In sum, the network analyzed in the following section is an origin- destination network among business passengers. Separate networks were constructed for each year from 1993 through 2008. Within each of these networks, cities centrality was defined using Freemans (1978/79) measure of degree centrality because this it can be used with valued networks and is readily interpretable: in this network it equals the total number of business passengers for whom the city is either their origin or final destination. Alternative measures of centrality (e.g. closeness, betweenness), which can be computed only for binary data, were considered but are not used in this analysis for two reasons. First, transforming this valued network data into binary network data discards valuable information about the volume of intercity exchanges. Second, the researcher- selected threshold value used to carry out such a transformation (i.e. to code exchanges as present or absent) directly impacts the resulting centrality scores. Modeling Causal InfluenceThe issue of causal inference is a philosophically thorny one, and statistical tests intended to demonstrate causality are necessarily problematic. In this paper, I follow others (e.g. Weiner, 1956; Granger 1969) by viewing causality in terms of predictability. A given outcome (Y) may be caused by a range of past events. Among the most likely causes of Y is Ys own past, a phenomenon that is sometimes substantively discussed as path dependence and statistically known as autocorrelation. For example, in seeking to understand why a city has a large population today, the most important factor is the fact that it had a large population yesterday. If other past events (X) also help predict Y, even after controlling for the effect of Ys own past, this is viewed as evidence that these other past events also have a causal influence. Returning to the example, if the availability of jobs in a city helps explain the size of the citys current population, even after considering its population size yesterday, there is evidence that the availability of jobs causally influences population size. Under this predictability- based conception of causality, the proposition that X causes Y can be evaluated by using ordinary least squares to estimate a regression equation of the form: In this model, if the coefficient associated with Xt-1 is statistically significant, Of course, this might be viewed as relatively weak evidence that X causes Y, and rather merely evidence that past values of X are associated (i.e. correlated) with present values of Y. However, the strength of this approach lies in the fact that equation (1) can be reversed to also evaluate the proposition that Y causes X:
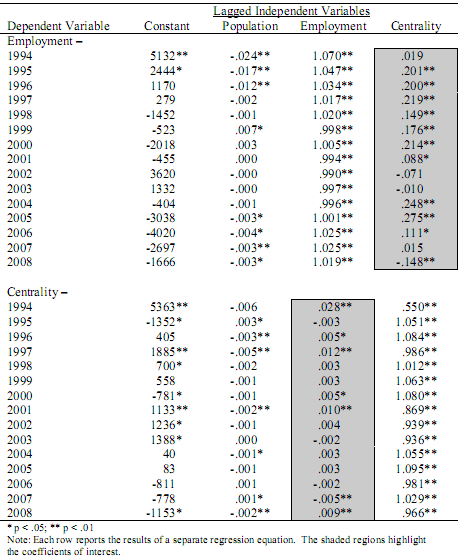
In this model, if the coefficient associated with Yt-1 is statistically significant, there is evidence that Y causes X. Unlike simple correlation where X is correlated with Y is the same as Y is correlated with X, in these models detecting statistical significance in equation 1 does not necessarily result in detecting statistical significance in equation 2. That is, this approach allows for four distinct outcomes: (a) X causes Y, (b) Y causes X, (c) X and Y cause each other, and (d) X and Y are causally unrelated. While this modeling approach draws on Wieners (1956) and Grangers (1969) conceptual definition of causality, it is not an implementation of a Granger Test or the class of related vector autoregressive (VAR) models. Such alternative models can be useful to evaluate causal hypotheses, but are not appropriate in this analysis for two reasons. First, a Granger Test is a significance test for the presence of causality, but does not provide information about the strength of causal influence. Second, a Granger Test would consider the causal relationship between employment and centrality for a single city over a period of time, but not the causal relationship between employment and centrality across a sample of cities at a specific moment in time. Thus, employing a Granger Test can be used to answer questions like those asked by Button and Lall (1999): Did air passenger traffic causally influence employment (and vice versa) in Cincinnati during the period from 1979 through 1997, or did it not? In contrast, the method described above is intended to answer a slightly different question posed by the hypotheses under consideration: To what extent did centrality causally influence employment (and vice versa) in the entire 128 city US urban system in 1994, or in 1995, or in 1996, and so on through 2008? To evaluate the two hypotheses proposed above flow generation and structural advantage two regression equations are estimated using ordinary least squares over the sample of 128 cities for each year from 1994 through 2008:
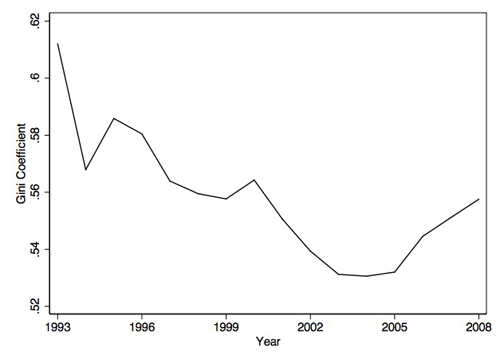
The first model (equation 3), and more specifically the coefficient associated with Centralityt-1, tests the structural advantage hypothesis that a citys centrality within the business network causally influences its total employment. The second model (equation 4), and more specifically the coefficient associated with Employmentt-1, tests the flow generation hypothesis that a citys total employment causally influences its centrality within the business network. Both models control for past population as a potential joint cause of both employment and centrality. Models such as these that incorporate lagged terms can be sensitive to lag length. To consider this possibility, equations (3) and (4) were also estimated using 2-year and 3-year lagged terms, which did not substantially improve model fit, and did not substantially alter the results or conclusions. Thus, in the results discussed below, only the more parsimonious 1-year lagged models are presented. RESULTSSpatial Restructuring of the Intercity Business NetworkThe descriptive statistics presented in Table 1 tell the now familiar story of a late 1990s economic boom, followed by post-9/11 economic turmoil and later a global financial crisis. The period from 1993 2000 displays explosive growth in non-farm employment and cities centrality in the business network, as reflected by their total volume of business passengers. In stark contrast, the period from 2000 2008 displays little growth in employment, and more strikingly, a decline in centrality. In addition to these broad economic patterns, the contours of the intercity business network have changed dramatically during this period. Specifically, centrality and the potential structural advantages it confers are unequally distributed among cities. To examine this distributional inequality, for each year during the study period Figure 2 displays the gini coefficient for centrality, which ranges from 0 when all cities are equally central in the network to 1 when centrality is concentrated in a single city (Neal, 2008). The declining values indicate that the business network was highly centralized in the early 1990s, but became increasingly decentralized. By listing the cities with the greatest gains and losses in their share of all business passengers in the network, Table 2 highlights the places that have been most affected by this deconcentration process. Figure 2: Inequality in Cities’ Business Network Centrality over Time.
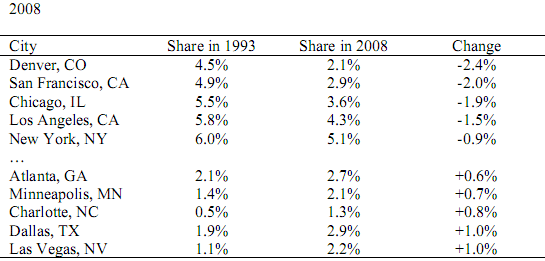
Table 2: Cities with Greatest Loss/Gain in Share of Business Passengers, 1993 2008.
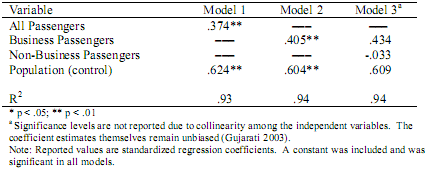
Centrality and EmploymentTable 3 presents the results from three pooled, cross-sectional regression models. These naïve models indicate, as expected, that there is a strong relationship between air traffic and employment. This relationship is detectable when centrality is defined using a network that includes all passengers (Model 1), but is stronger when the network includes only business passengers (Model 2). Model 3 provides additional evidence that the method described above to identify business passengers is valid. It simultaneously uses centrality in two different networks one defined using only business passengers, another defined using all other passengers (i.e. non-business passengers) to predict employment in cities. Collinearity in these two measures (business passengers VIF = 15.96, non- business passengers VIF = 17.66) yields inflated standard errors, which impedes testing the statistical significance of their coefficients and results in wide confidence intervals around the estimates. Despite this reduction in precision, the exceptionally large difference in the estimates, which remain unbiased (Gujarati 2003), nonetheless suggests that centrality in the business network is more influential than centrality in the non-business network. Table 3: Pooled Cross-Sectional Regressions of Centrality on Employment (N =
Table 4: Results of Regressions Testing Causality between Employment and
As cross-sectional models, however, these results cannot shed light on the causal direction of this relationship: whether centrality leads to more jobs, or more jobs yield greater centrality. To consider the direction of causal influence, Table 4 reports the results from equations (3) and (4). Population is only occasionally statistically significant, and in all years had very little influence on employment or centrality net of past employment and past centrality. As expected, employment in the previous year strongly predicted employment in the current year, and centrality in the previous year strongly predicted centrality in the current year; in nearly every case these coefficients tended toward unity. This reflects the unsurprising finding that cities employment and centrality exhibit relative stability from year to year. For example, if a city had a total employment of one million last year, it is likely to have a total employment of around one million this year. The estimates of the coefficients associated with population and the lagged dependent variable are relatively inefficient. While their precise values should be interpreted with caution, the estimates themselves remain unbiased. More importantly, however, the estimates of the coefficients of interest discussed below are robust, with variance inflation factors that do not exceed the thresholds defined by Gujarati (2003) in any year. The coefficients of interest, highlighted in Table 4 by the shaded regions, provide divergent evidence for the two hypotheses under consideration: support for the structural advantage hypothesis, but not for the flow generation hypothesis. In the upper panel of Table 4, past centrality is a strong and consistently significant predictor of present employment, after controlling for past employment, suggesting that centrality causally influences employment. However, in the lower panel of Table 4, past employment is a weak and inconsistently significant predictor of present centrality, after controlling for past centrality, suggesting that employment does not causally influence centrality. DISCUSSION AND CONCLUSIONTurning first to the descriptive analysis of the spatial restructuring of the intercity business network, the changing distribution of centrality among cities illustrated in Figure 2 suggests that trends toward deconcentration and flattening are apparent not only at the global scale (e.g. Friedman, 2005), but also within national urban systems, as old hierarchies begin to break down (author). Historically dominant cities that attracted the majority of business flows, and by implication enjoyed the structural advantages such flows provide, now must compete with formerly subordinate cities as business air traffic is spread more evenly throughout the network. The cities identified in Table 2 as experiencing the greatest gains and losses in centrality during the study period provide some insight into where this deconcentration has been focused. The list suggests that centrality in the business network is shifting away from cities that have long coordinated the American economy and have been identified as Americas global cities (e.g. New York, Chicago, Los Angeles; Abu-Lughod, 1999). Taking their place are smaller regional business centers that occupy increasingly central locations in the network, perhaps owing to their unique capacities and niches (e.g. Minneapolis in medical equipment, Charlotte in banking). These results reflect trends others have observed, noting increasing competition among domestic cities (Markusen and Gwiasda, 1993), an increasing role of regional corporate centers (Kotkin, 2003), and the shift from an antiquated spatial urban hierarchy to one driven aspatially by intercity linkages. Clearly the intercity business network, as reflected in business air travel patterns, is in a state of flux. How, then, is a citys position within this changing network associated with economic outcomes? The results presented in Table 3 indicate a strong, and indeed unsurprising, positive relationship between centrality and employment: cities with more central positions in the network tend to have more jobs. The results presented in Table 4 are of greater interest, however, because they offer insight into the causal direction of this relationship. They suggest that while robust employment generates a fraction of additional air traffic and thus centrality in the network (flow generation hypothesis), the relationship runs primarily in the other direction: centrality drives employment (structural advantage hypothesis). For example, in 2004 each additional job yielded virtually no (.003) additional business passengers, but each additional business passenger yielded an additional.275 jobs, on average. In practical terms, this means that increasing business passenger traffic in a city by 10,000 in 2004 would have brought an average of 2,750 additional jobs to that city. Table 5: Largest Residuals in Structural Advantage Model, 2005.
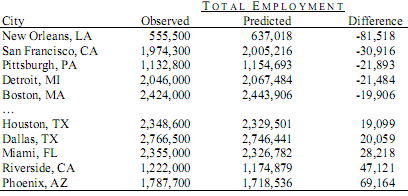
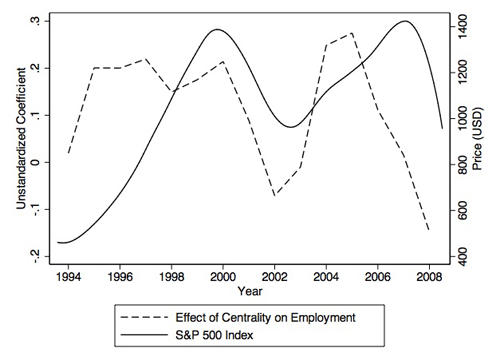
However, not all cities conform to this pattern. Table 5 lists the cities with the largest residuals (i.e. the poorest fit) in the structural advantage model in 2005, the year when centrality appears to have the strongest influence on employment. Some cities (e.g. Pittsburgh, Detroit) have fewer jobs than would be expected given their network centrality, while other cities (e.g. Phoenix, Riverside) have more jobs than expected. While these patterns should be interpreted with caution, they do suggest that the extent to which centrality causally influences employment may differ by region (e.g. rust-best vs. sun-belt) or industrial specialization (e.g. manufacturing vs. service). If such patterns are confirmed by future research, this may indicate that some cities stand to benefit more from the structural advantages that accrue from increased centrality than others (Neal, 2008). Despite the potential for regional and industrial uniqueness, at least for the period under consideration, these findings reaffirm the economic significance of business air traffic, of face-to-face interaction, and most broadly of intercity business networks (c.f. Choi, Barnett, and Chon, 2006). Moreover, they suggest that such intercity business networks are not merely reflections of robust metropolitan economies, but rather are critically and causally implicated in cities economic stability and growth. Consequently, policies concerning urban economic development may benefit from a particular focus on the networks of struggling cities, and especially on facilitating their integration into the wider urban system. Longitudinal Changes in Causal InfluenceThe results presented in Table 4, however, also display a complex relationship between centrality and employment that varies over time. Occupying a central position in the intercity business network does not always lead to employment growth. These longitudinal fluctuations raise questions about system-level (i.e. national) factors that may account for the changing causal role of centrality for employment. Because business travel by air is costly, during periods of economic decline businesses may be more inclined to interact electronically (e.g. via email, teleconference), thereby reducing the impact that centrality in an air traffic network would have on employment. That is, in economically tough times, the business air traffic network may not be the right network to examine when seeking a relationship between centrality and employment; centrality in other types of networks take precedence. To consider this possibility, figure 3 plots the unstandardized regression coefficients from Table 4 that reflect centralitys annual causal influence on employment (values are indicated on the left axis). In addition, it also plots the S&P500 market indexs monthly average (values are indicated on the right axis) which, as an aggregation of 500 major US firms stock prices, tracks national trends of economic growth and decline. The parallel movement in these two trends causal influence of centrality and S&P500 price is striking and suggests that centrality leads to additional jobs in cities primarily when the S&P500 indicates the economy is growing. Cities centrality in the business network boosted employment most during the dot-com and easy-credit booms of the late 1990s and mid 2000s, respectively. However, centrality had little causal influence on employment during the post-9/11 and sub-prime lending busts. Thus, it appears that the causal relationship between centrality and employment is cyclical, following cyclical patterns of the economy at large. Figure 3: National Economic Conditions and the Causal Influence of Centrality
Though further examination is needed, the patterns in figure 3 also appear to indicate that changes in centralitys causal influence precede, not follow, changes in the economy. For example, before the market had recovered from post-9/11 decline, business passengers were already returning to the skies and driving employment growth at their destinations. Cities with well-developed air transportation infrastructures were poised to capture the structural advantages associated with flows of business passengers, and thus to experience employment growth before a nationwide economic recovery was apparent. Similarly, more than a year before the global economic crisis was reflected in plummeting stock market indices, businesses had already begun to reduce their use of costly air travel, perhaps in favor of other modes of interaction like videoconferencing. In this case, cities centrality in an air-based infrastructure network became unimportant or, as these results show by 2008, a liability. Implications and Future DirectionsThese results have a number of implications relevant to current discussions of infrastructure investment as employment growth strategies. They suggest that policies aimed at boosting employment levels through expansion of transportation infrastructure may be effective. However, this encouragement comes with a number of caveats. First, such strategic investments may only be effective in creating jobs if they encourage additional business traffic. Simply increasing the frequency of flights to and from a city, or the number of destinations reachable from a city, will likely have little beneficial effect on its employment levels, as these results find that only the movements of business passengers are relevant for job creation. Second, and closely related, such investments will only be effective if they yield additional passengers who transact business in the city, in contrast to those who use the city simply as an intermediate stop on a journey elsewhere. Thus, airport expansions alone may have little effect if not paired with a wider, regional economic development strategy designed not only to make business travel to the area more convenient, but also to make the area more attractive for conducting business. Finally, even if such political maneuvers as the American Recovery and Reinvestment Act are successful in generating additional business traffic bound for ailing cities, the economic benefits of their increased centrality in intercity networks may only be realized in conjunction with a wider economic recovery. Nonetheless, investment in infrastructure expansion during periods of economic decline may have the potential to deliver a two-step boost: immediate but temporary job growth when it is needed most, while positioning cities for longer term benefits deriving from increased centrality once the economy rebounds. While these results suggest some policy implications, they also identify avenues for future research. First, more efficient implementation of policies aimed at economic recovery through infrastructure development requires targeting specific cities where such strategies are expected to be most effective. Thus, additional work is needed to consider whether these findings apply to all cities equally, or whether there are national, regional, or sectoral differences in the relationship between employment and air traffic centrality. Prior studies already hint that this relationship is restricted to service or professional jobs, and is less applicable for production jobs (e.g. Irwin and Kasarda 1991, Brueckner 2003), but replication using more robust data like those described above is necessary. Similarly, to expand the potential points of entry for economic recovery efforts, it will be useful to consider the impact of other types of urban networks (e.g. email communication, rail) and other aspects of a citys network position (e.g. clique membership) on economic outcomes. Finally, urban networks of exchange are undeniably global in scope, with international connections significantly impacting individual cities levels of centrality and employment. While such data is generally difficult to obtain, or available only from private sources, future research should aim to examine more encompassing urban networks when considering their effects. CONCLUSIONAlthough scholars have long recognized that a citys economic fortunes are closely tied to its position in the network of interurban exchanges, until recently the causal direction of this relationship has been unclear: do cities with robust economies acquire better positions in the network (flow generation hypothesis), or does a citys central location in the network provide encourage economic growth (structural advantage hypothesis). Examining the air traffic network among US cities from 1993 2008, this study finds that urban employment growth is driven by cities centrality in business networks, not vice versa. This result is consistent with the findings of earlier studies, but offers a more theoretically informed test of these hypotheses by focusing only on business passengers movement in an origin-destination network. Confirmation of the structural advantage hypothesis that centrality causally influences employment suggests that infrastructure investment as an urban economic growth strategy may be effective, but operates within a series of constraints based on wider economic conditions, and on where and why passengers are traveling. ACKNOWLEDGEMENTSI wish to thank Jennifer Watling Neal and Stan Kaplowitz for their comments on earlier drafts, and Sandy Marquatt-Pyatt and Lijian Yang for helpful conversations about causal modeling. An portion of this work was presented at the 2010 American Sociological Association annual meeting in Atlanta, GA. REFERENCESAlderson, A. S., & Beckfield, J. (2004). Power and Position in the World City
Network. American Journal of Sociology, 109, 811 51.
NOTE* Zachary P. Neal, Department of Sociology, Michigan State University, 316 Berkey Hall, East Lansing, MI; zpneal@msu.edu
Note: This Research Bulletin has been published in Journal of Urban Affairs, 33 (2), (2011), 167-184 |
||