GaWC Research Bulletin 331 |
|
|
|
This Research Bulletin has been published in The Service Industries Journal, 31 (14), (2011), 2293-2307. doi:10.1080/02642069.2010.503887 Please refer to the published version when quoting the paper.
IntroductionThis is an empirical paper that draws on the network model devised by the Globalization and World Cities research group (GaWC, http://www.lboro.ac.uk/gawc) to map changes in the urban geography of globalized service provision in the period 2000-8. In GaWC research, cities are not simply deemed to be service centers because they contain' a lot of service firms. Rather, starting from the observation that service provision is now transnationally organized through myriad interactions within the organization structure of major service firms, the position of cities is assessed through a model that provides a systematic appraisal of intra-firm flows in globalized producer services firms. A first major application of the GaWC model was the measurement and subsequent empirical analysis of network formation amongst service centers in the year 2000 (Derudder, Taylor, Witlox, & Catalano, 2003; Taylor, Catalano, & Walker, 2002a, 2002b, 2004). These analyses were based on information on the (importance of the) presence of 100 leading advanced producer services (APS) firms in 315 cities for the year 2000. In 2007, GaWC joined forces with the Global Urban Competitiveness Project (GUCP) at the Chinese Academy of Social Sciences (CASS) to carry out a new large-scale data collection exercise for 2008 (Taylor et al., 2009a, 2009b, 2010). In the first half of 2008, GaWC/GUCP garnered information on 175 office networks of APS firms across 526 cities. This means that we have comparable cross-sectional snapshots of the organization of globalized service firms in 2000 and 2008. By assessing the shifting position of cities in this time period, Derudder et al. (2010) provide a preliminary insight in the changing geographies of globalized service provision. The authors point to the relative decline of Western European, Australasian and especially North American cities, and the relative rise of South Asian, Chinese and Eastern European cities (Shanghai, Beijing, Seoul and Moscow in particular). However, in that paper cities were approached as general service centres in that information on different service sectors was aggregated. As a consequence, it remains unclear if and how different sectors have globalized along different geographical lines. In this paper, we systematically examine geographical shifts in the office networks of major service firms at the sectoral level (management consultancy, finance, advertising, accountancy, law), which allows us to obtain a more nuanced understanding of the ongoing globalization of service provision through major cities. The remainder of this paper is organized in three main sections. First, the paper provides a brief summary of the GaWC model, i.e. its conceptual rationale, specification and data requirements. Second, we briefly describe the data collections in 2000 and in 2008, followed by an overview of the way in which these data were transformed in order to coherently measure changes in service provision. Third, we discuss change for each of the sectors in the data at the network and the city level respectively. The paper is concluded with an overview of our major findings and some avenues for further research. Specification of the GaWC ModelConceptual RationaleDrawing on Saskia Sassen's (1995, 2001) work on place and production in an increasingly globalized economy, GaWC has undertaken a theoretically grounded endeavor of data acquisition for measuring WCN-formation. Sassen's research emphasizes the self-accelerative transformation of the economic bases of cities from manufacturing to business services. Unable to cope with the accelerated pace of structural change and the increasing pressure for product innovation on their own, both manufacturing and service industries are becoming more and more dependent on the customized knowledge, expertise and skills provided by specialized business services such as financial services, accountancy, management consultancy, advertising, etc. It is now well established that many of these business service firms have increasingly become large multinational firms as they have been looking for a presence in an international market to service existing clients and find new ones (see Aharoni, 1993; Aharoni & Nachum, 2000; Daniels, 2007; Daniels & Moulaert, 1991; Edvardsson, Edvinsson, & Nystrom, 1993; Harrington & Daniels, 2006; Leslie, 1995; Roberts, 1999; Warf, 2001). Business service firms have always clustered in cities to provide such services to their clients (see, however, Harrington & Campell, 1997), but under conditions of contemporary globalization, multiple offices are required in major cities around the world to provide a seamless service. Obviously, each firm has its own location strategy which cities to have offices in, what size and functions those offices will have, and how the offices will be organized. It is the work done in these offices that interlocks' various cities in projects that require multiple office inputs. Thus the inter-city relations in these servicing practices are numerous electronic communications information, instruction, advice, planning, interpretation, strategy, knowledge, etc., some teleconferencing as required, and probably travel for face-to-face meetings at a minimum for the beginning and end of a given project. These are the working flows that combined across numerous projects in many firms to constitute the relations between globalized service centers specified as an interlocking city network in GaWC research (Taylor, 2001, 2004). Model SpecificationThe GaWC specification of the network of globalized service centers can be formally represented by a matrix Vij defined by n cities x m firms, where vij is the service value' of city i to firm j. This service value is a standardized measure of the importance of a city to a firm's office network, which depends upon the size and functions of an office or offices in a city. The global network connectivity GNCa of city a in this interlocking network is defined as follows:
The conjecture behind conceiving the product of service values as a surrogate for actual flows of inter-firm information and knowledge between cities is that the more important the office, the more connections there will be with other offices in a firm's network2. The limiting case is a city that shares no firms with any other city so that all of its service value products in equation (1) are 0 and it has no connectivity. In previous GaWC research, GNC measures were based on an aggregation of the connectivities of firms from different sectors (see, however, Hoyler, Freytag, & Mager, 2008, for a sectoral mapping of connectivities for one city-region). In this paper, connectivity in the office networks of service firms will be measured at the sectoral level. Thus a city's overall GNCa will be disaggregated into sectoral network connectivities' SNCa, sector. For instance, SNCLondon,accountancy represents London 's connectivity in the office networks of leading accountancy firms. Data and MethodologyData Collections in 2000 and 2008Precise specification guides the data collection: data are required on the city office networks of large professional, financial and creative service firms. These exercises in data collection are described in detail in Taylor et al. (2002a) for the year 2000 and in Taylor et al. (2009b) for the year 2008, and will be summarized here as they are the inputs to our subsequent analysis. In 2000, global APS firms were defined as firms with offices in 15 or more different cities, including at least one in each of the prime globalization regions: northern America, Western Europe and Pacific Asia. Firms meeting this criterion were selected from rankings of leading firms in different service sectors. In the event 100 firms were identified in six sectors: 18 in accountancy, 15 in advertising, 23 in banking/finance, 11 in insurance, 16 in law, and 17 in management consultancy. Selecting cities was much more arbitrary and was based upon previous GaWC experience in researching global office networks. Capital cities of all but the smallest states were included plus many other important cities in larger states, which resulted in a list of 315 cities. In 2008, we carried out a much larger and complete data collection. To allow for future comparisons of city connectivities over time, a certain consistency in the data structure is required. The dynamic nature of the global economy, however, implies that the relevance of invoking the geography of the office networks of the initial GaWC 100 APS firms becomes increasingly problematic as time passes. Firms get liquidated, merge with other firms, are replaced by new firms whose global presence/importance rises, etc. Since measurement of differences should represent changing urban geographies rather than data collection change, APS firms were now chosen strictly by their ranking in lists of the largest firms in each sector. Overall, the number of firms was increased from 100 to 175. We combined the banking/finance and insurance categories from 2000 and included the top 75 such firms as ranked in the Forbes composite index, a measure that combines rankings for sales, profits, assets and market value lists. For the other four of the previously studied services accountancy, advertising, law and management consultancy we included the top 25 firms: for law the Chambers list of Corporate Law firms was used (www.chambersandpartners.com/global/); for advertising agency networks we used Advertising Age's ranking of marketing organizations' by revenues (www.adage.com/images/random/lna2007); for accountancy firms' networks we used the ranking by revenues of World Accounting Intelligence (www.worldaccountingintelligence.com/); and for management consultancies we used the 2007 edition of the Vault Management & Strategy Consulting Survey, which ranks firms in terms of their prestige' based on a large survey of professionals (www.vault.com). In all cases the lists of firms selected are the latest available at the planning of the research project in 2007 and these tended to be based upon 2006 rankings3. For all lists substitute firms were identified (ranked just below 75 and 25) to cover for situations where a firm had disappeared (e.g. been taken over) in the two years before the actual data collection in 2008. In addition, we carried out a thorough review of cities and added many new cities from emerging markets to create a list of 526. In both data gatherings, assigning service values to city/firm-pairs focused on two features of a firm's office(s) in a city as shown on their corporate websites: first, the size of the office (e.g. number of practitioners), and second, their extra-locational functions (e.g. regional headquarters). Information for every firm was simplified into service values vij ranging from 0 to 5 as follows. The city housing a firm's headquarters was scored 5, a city with no office of that firm was scored 0. An 'ordinary' or 'typical' office of the firm resulted in a city scoring 2. With something missing (e.g. no partners in a law office), the score reduced to 1. Particularly large offices were scored 3 and those with important extra-territorial functions (e.g. regional headquarters) scored 4. All such assessments were made firm by firm. To measure the changing position of cities in the office networks of service firms, we computed sectoral network connectivities (SNC) for each of the five sectors in 2000 and 2008. From the 307 cities that feature in both datasets, we only retained the 132 cities that have a GNC of at least one fifth of the most connected city in either 2000 (London) or 2008 (New York) see Derudder et al. (2010). Obviously this is an arbitrary cut off point, but it allows for a large number of cities that are distributed across all parts of the settled world while at the same time excluding idiosyncratic results (i.e. city connectivities based on the presence of a limited number of firms). To allow for consistency in the interpretation of change in SNC, we (i) computed cities' SNC's vis-à-vis the other 131 cities only and (ii) express connectivities as proportions of the largest computed connectivity in each sector to iron out the effect of the larger number of firms in 2008 (thus creating a scale from 0 to 1 for each of the SNC measures). These SNC measures for 2000 and 2008 are the input to our analyses of change at the network and the city level. Measuring ChangeFirst, we measure change in the network at large. Because no single measure can unambiguously capture the direction, degree and form of change in the network, we combine two sets of indicators:
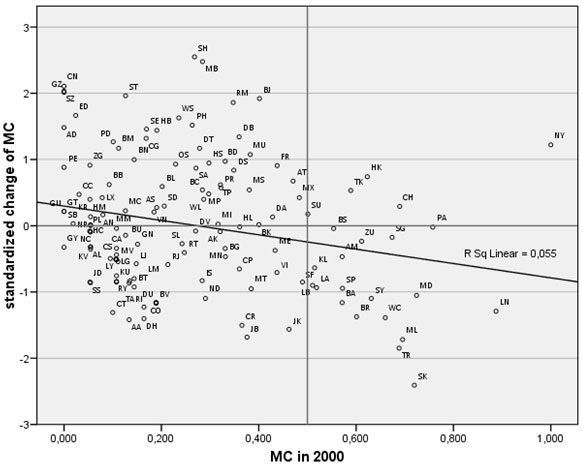
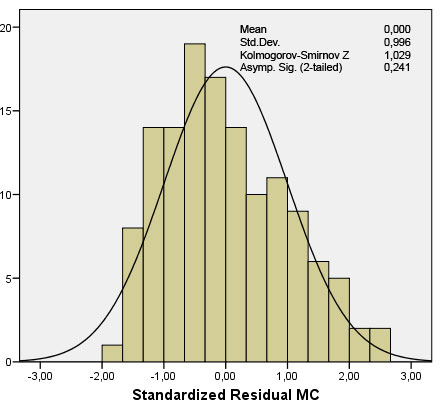
A comprehensive appraisal of change at the network level needs to combine both sets of indicators and the different measurements within both groups. For instance, rising average values can in principle be associated with fewer than 50% cities with rising connectivities if a limited number of nodes experience large connectivity gains in the face of slightly declining connectivity in the rest of the network. Furthermore, rising averages can result in very different evolutions in the shape of the distributions (e.g. the distribution can become either more or less spread out' or asymmetrical' as a result), while declining levels of skewness may be associated with either convergence around the mean or spreading out of connectivity over the distribution, etc. Obviously, other indicators are possible (e.g. median value and kurtosis), but when considered together these indicators allow for a fair appraisal of some of the overarching changes in the office networks of leading service firms for the different sectors. Second, we computed a measure of change that allows for a straightforward interpretation of changing service provision at the city level. This measure of SNC change at the city level is based on a two-step transformation of the data. Such a double transformation was deemed necessary because neither changes in rank nor absolute change in SNC are well-suited for this purpose: the different SNC distributions are essentially closed number systems that distort the measurement of change. For instance, however much more connected it becomes, the leading city cannot show additional connectivity through its SNC measure of unity. In more general terms, there is a problem of possible underestimation of change at the higher ends of the scale. This problem consists of two components: (i) a measurement problem in that higher ranked cities have less leeway to increase their sectoral connectivity because they are nearer the limit of the measurement scale (i.e. a city with a SNC of 0.95 can only increase its connectivity with 0.05) and (ii) a conceptual problem in that the markets of higher ranked cities are closer to saturation in that they have less leeway to acquire more/larger/more important offices (i.e. a city where all major service firms have a major office can hardly become more important in the office networks of these firms). Therefore, an alternative way of measuring change is required. The measurement problem is tackled by generating standardized measures of sectoral connectivity change SSCC (see Taylor and Aranya, 2008). These SSCC measures are computed by (i) standardizing connectivities in 2000 and 2008 (through z-scores), followed by a (ii) standardization of the 2008-2000 difference (again through z-scores). This produces an open number sequence pivoting on 0 with a standard deviation of 1. This leaves us with the conceptual problem, which can be read from the fact that for each of the sectors there is a small but significant negative correlation between SNC in 2000 and SSCC in the period 2000-08 (see Orozca-Pereira & Derudder, 2010). As an example, Figure 1 shows the small but statistically significant relation between both indicators for the management consultancy sector. The negative trend (r = -0.23), pointing to saturation processes, is clearly visible4. The straightforward solution to this second problem is to use the standardized residuals from the regression SRESID as our actual measures of change. These figures can be understood as the actual level of SSCC after accounting for the possible underestimation of change in major service centers because of small but statistically significant processes of market saturation. Once again, and as can be seen in Figure 2 , the standardized residuals have a standard normal distribution (average = 0, standard deviation = 1, Kolmogorov-Smirnov-test points to a normal distribution), which implies that the change measures at the city level can be interpreted as z-scores (e.g. change > +2 or < -2 means exceptional change' in statistical terms). Figure 1: Negative correlation between the SNC in 2000 and the SSCC 2000-08 for the management consultancy sector.
Figure 2: Standard normal distribution of the standardized residuals for the management consultancy sector.
Results: Changes in Globalization Service ProvisionChanges at the Network LevelTable 1 summarizes the results of the different (sets of) indicators for measuring connectivity change at the network level. The first two measures summarize changes in the central tendency of the distribution; the following two indicators show changes in the shape of the distribution. Table 1: Changes at the network level per sector (132 cities)
According to our analysis, the office networks of leading firms in the financial services, accountancy and advertising sectors have been characterized by clear-cut expansion in the period 2000-85. This increased connectivity is especially discernible in the advertising sector. The office networks of management consultancy firms, in turn, have on average lost connectivity in the period 2000-8, while law firms show a mixed pattern in that the rising average connectivity is matched by more cities exhibiting declining than increasing connectivities. As we will see below, this mixed pattern can in part be attributed to the fact that a limited set of cities (i.e. Shanghai, Beijing, Dubai, Madrid, Paris and Antwerp) have witnessed sizable connectivity gains in the office networks of law firms in the face of overall stagnation in the geographical expansion of these networks. The connectivity distributions of the different sectors have changed along quite different lines. For law and accountancy, standard deviations have remained largely unchanged, while those of the advertising and financial services sectors have increased. The latter implies that the overall distribution has become more stretched out' as more cities have become either less or more connected than the average value. Connectivities for the management consultancy sector, in turn, have converged around the mean value. When considered alongside the declining skewness of the distribution (and the stagnation of the connectivity of most cities through the office networks of leading management consultancy firms), this clearly points to a levelling out or, given the central tendency results, a stalling of the globalization of this sector. And finally, the skewness of the financial services and law sector has remained largely unchanged, while the advertising and accountancy distributions have become significantly less skewed. This shows that whereas the former services have largely remained active in a given set of cities, in advertising and accountancy the importance of these services have spread to rather more cities in 2008. Changes at the City LevelFigures 3-7 illustrate the geography of the standardized residuals SRESID of the 132 cities for each of the service sectors. Each of the figures is a cartogram that places cities in their approximate geographical locations, whereby cities are indicated through a meaningful two letter code (e.g. NY is New York). These visualizations are complemented by Table 2 which lists the top and bottom ten cities ranked by standardised residuals for each sector. These lists provide specific details of where city connectivities are growing strongly and where they are relatively in severe decline. Figure 3 depicts the geographical distribution of the standardized residuals for the accountancy sector. It clearly shows a relative connectivity decline for nearly all North American and most of the Australasian and Western European cities, with Cologne experiencing the largest decrease. New York and even to a larger extent London and Brussels are notable exceptions to this overall trend. Because these measures are controlled for possible effects of market saturation, this suggests that these massive service centers still have considerable leeway for connectivity growth despite already being well-connected. Latin American and South and East European cities have evidently increased their connectivity. The same holds for the South-East Asian and Chinese cities, with Beijing having experienced the largest connectivity gain (Table 2). Figure 3: Standardized residuals for 132 cities for the sector accountancy.
Figure 4 summarizes the geographical distribution of the standardized residuals for the advertising sector. In general terms, the patterns discernible for the accountancy sector re-emerge: declining connectivities for North American, Australasian and (some) West European cities, and increasing connectivities for South-East Asian and particularly for East European cities, with Moscow sporting the largest connectivity growth (Table 2). For this sector, the connectivity change of Latin American cities is less clear-cut, and this in contrast to the service centers in the Middle-East where Riyadh, Dubai, and Jeddah are amongst the cities with the largest connectivity growth. Miami, Montreal, and Calgary, all North American cities, have declined most in this sector, while New York and especially London and Frankfurt have also experienced connectivity losses. Figure 4: Standardized residuals for 132 cities for the sector advertising.
The geographical distribution of the standardized residuals for the financial services sector is depicted in Figure 5 . Dusseldorf, Hamburg, and Berlin are amongst the worst performing cities in the financial services network, and a majority of North American cities such as San Francisco follow this negative trend. With the exception of Budapest, most East European cities have experienced positive connectivity changes as leading banks have extended their office networks to these cities. Moscow is again the city with the largest connectivity growth, in addition to fast growing East Asian cities such as Seoul, Shanghai, and Beijing. Sydney, which seems to benefit from its strong ties to these East Asian cities, has experienced the sixth largest connectivity gain overall (Table 2). Figure 5: Standardized residuals for 132 cities for the sector financial services.
Compared to the previous three sectors, the geographical distribution of the standardized residuals for the law sector shows a rather different picture featuring more intra-regional variety (Figure 6). The relative connectivity decline of North American cities is less obvious here. San Diego and Boston have been doing relatively well, and this in contrast to Los Angeles, Denver and Montreal. The same mixed pattern can be found in Western Europe, albeit that a majority of cities has experienced increasing network connectivities. Madrid, Paris, Antwerp, Milan, and London are even amongst the ten cities with the largest connectivity growth (Table 2). East European cities, and particularly Saint Petersburg, Kiev and Budapest on the other hand, have experienced connectivity declines, and this in contrast to Bucharest, Sofia, and Zagreb. Similarly, the connectivity changes for Chinese and East Asian cities are also far less homogeneous than in previous sectors, with Shanghai and Beijing being amongst the stronger growers and Hong Kong amongst the strongest declining cities in the office networks of leading legal services firms. The measures for Latin American, Middle Eastern, and South Asian cities are rather more straightforward: all three regions generally experience declining connectivities, with Dubai as the major exception. Figure 6: Standardized residuals for 132 cities for the sector law.
And finally, Figure 7 depicts the geographical distribution of standardized residuals for the management consultancy sector. Not unlike the previous sector, cities in Latin America and especially in the Middle East have experienced declining network connectivities. The obverse is true for East Asian, Chinese and Indian cities. For North America and Eastern and Western Europe, the general tendency is less clear-cut. Indeed, in general, North American cities appear to score relatively well, with New York even belonging to the top five cities with the largest connectivity growth (Table 2). The latter may in part be reflective of the fact that the ranking of leading firms in this sector is more so than the other sectors dominated by US firms that have gone global, but still retain a strong focus on the US market. In Western Europe, German and English cities also did relatively well (except for London and Cologne). Apart from Warsaw and Budapest, East European cities generally experienced a relative connectivity decline in the management consultancy network. Figure 7: Standardized residuals for 132 cities for the sector management consultancy.
Table 2: Major positive and major negative standardized residuals per sector.
ConclusionsThis paper has implemented the GaWC network model to measure urban connectivity change for different service sectors in the period 2000-2008. Using information on the location strategies of APS firms gathered in 2000 and 2008 we applied a series of statistical and mapping tools to compute and visualize the connectivity changes for a set of 132 cities in the office networks of accountancy, advertising, financial services, law, and management consultancy firms. We have shown that there are a number of converging patterns, such as the rising connectivities of Chinese cities in general and of Moscow, Seoul, Beijing and Shanghai in particular, and this alongside the relative decline of the connectivities of North American and West European cities. At the same time, it is also clear that these general tendencies also have a more specific sectoral dimension. For instance, while North American cities have in relative terms become less connected in the office networks of leading financial services, some of these cities have managed to increase their connectivity in the office networks of management consultancy firms. In other words, despite some general patterns in the shifting positions of cities as globalized service centers, we have shown that leading service firms from different sectors have been globalizing along different geographical lines. Contemporary globalization is obviously not an end-product in itself but an on-going bundle of processes. This important point is especially relevant in the light of the recent financial/economic crisis: when garnering the data before the crisis in early 2008, we obviously could not fully realize that this research was generating instant history'. Given the usual lag time of about one year from preparing and carrying out data collection to the beginning of analyses, it seemed a reasonable assumption that we would have the latest, up-to-date results on the shape of the office networks of leading service firms. But much has happened since these data were collected in the first half of 2008, and we cannot know now what form the impact of the financial/economic crisis will have on the office networks of leading service firms. What we have provided in this paper, therefore, is a base line of global service provision on the eve of the crisis. This will be an essential tool for future study of the geographical impact of current ongoing transformations in economic globalization. REFERENCESAharoni, Y. (1993). Coalitions and competition: The globalization of professional business services. London: Routledge. Aharoni, Y. & Nachum, L. (2000). Globalisation of services: Some implications for theory and practice. London: Routledge. Daniels, P.W. (2007). A global service economy? In J.R. Bryson & P.W. Daniels (Eds.), The handbook of service industries (103-125). Cheltenham: Edward Elgar. Daniels, P.W., & Moulaert, F., (Eds.). (1991). The changing geography of advanced producer services. London: Belhaven Press. Derudder, B., Taylor, P.J., Ni, P., De Vos, A., Hoyler, M., Hanssens, H., Bassens, D., Huang, J., Witlox, F., Yang, X. (2010). Pathways of growth and decline: connectivity changes in the world city network, 2000-2008. Urban Studies, in press. Derudder, B., Taylor, P.J., Witlox, F. & Catalano, G. (2003). Hierarchical tendencies and regional patterns in the world city network: a global urban analysis of 234 cities. Regional Studies, 37(9), 875-886. Dicken, P. & Malmberg, A. (2001). Firms in territories: a relational perspective. Economic Geography, 77(4), 345-363. Edvardsson, B., Edvinsson, L., Nystrom, H. (1993). Internationalisation in service companies. The Service Industries Journal, 13(1), 80-97. Harrington, J.W. & Campbell, H.S. (1997). The suburbanization of producer-service employment. Growth and Change, 28(3), 335-359. Harrington, J.W. & Daniels, P.W. (Eds.). (2006). Knowledge-based services, internationalization and regional development. Ashgate Publishing, Ltd.: Aldershot. Hoyler, M., Freytag, T. & Mager, C. (2008). Connecting Rhine-Main: the production of multi-scalar polycentricities through knowledge-intensive business services. Regional Studies, 42(8), 1095-1111. Jones, A. (2002). The global city' misconceived: the myth of global management' in transnational service firms. Geoforum, 33, 335-350. Lambregts, B. (2008). Geographies of knowledge formation in mega-city regions: some evidence from the Dutch Randstad. Regional Studies, 42(8), 1173-1186. Leslie, D.A. (1995). Global scan: the globalization of advertising agencies, concepts, and campaigns. Economic Geography, 71(4), 402-426. Orozca-Pereira, R. & Derudder, B. (2010). The cities/services-nexus: Determinants of the location dynamics of advanced producer services firms in global cities. The Service Industries Journal, in press. Roberts, J. (1999). The internationalisation of business service firms: A stages approach. The Service Industries Journal, 19(4), 68-88. Sassen, S. (1995). On concentration and centrality in the global city. In P.L. Knox & P.J. Taylor (Eds.), World cities in a world-system (63-78). Cambridge: Cambridge University Press. Sassen, S. (2001). The global city (2nd ed.). Princeton, NJ: Princeton University Press. Taylor, P.J. (2001). Specification of the world city network. Geographical Analysis, 33, 181-194. Taylor, P.J. (2004). World city network. A global urban analysis. London: Routledge. Taylor, P.J. & Aranya, R. (2008). A global urban roller coaster'? Connectivity changes in the world city network, 200004. Regional Studies, 42, 1-16. Taylor, P.J., Catalano, G. & Walker, D. (2002a). Measurement of the world city network. Urban Studies, 39, 2367-2376. Taylor, P.J., Catalano, G. & Walker, D. (2002b). Exploratory analysis of the world city network. Urban Studies, 39, 2377-2394. Taylor, P.J., Catalano, G. & Walker, D.R.F. (2004). Multiple globalizations: regional, hierarchical and sectoral articulations of global business services through world cities. The Service Industries Journal, 24, 63-81. Taylor, P.J., Ni, P., Derudder, B., Hoyler, M., Huang, J., Lu, F., Pain, K., Witlox, F., Yang, X., Bassens, D. & Shen, W. (2009a). Measuring the world city network: new developments and results. GaWC Research Bulletin 300, http://www.lboro.ac.uk/gawc/rb/rb300.html. Taylor, P.J., Ni, P., Derudder, B., Hoyler, M., Huang, J., Lu, F., Pain, K., Witlox, F., Yang, X., Bassens, D. & Shen, W. (2009b). The way we were: command-and-control centres in the global space-economy on the eve of the 2008 geo-economic transition. Environment and Planning A, 41(1), 7-12. Taylor, P., Ni, P., Derudder, B., Hoyler, M., Huang J. & Witlox, F. (eds.) (2010) Global Urban Analysis: A Survey of Cities in Globalization. London: Earthscan. Warf, B. (2001). Global dimensions of U.S. legal services. Professional Geographer, 53, 398-406.
APPENDIX 1List of Abbreviations for Figures 3-7
NOTES* Heidi Hanssens (corresponding author), Ben Derudder, Frank Witlox, Department of Geography, Ghent University, Belgium; email: heidi.hanssens@ugent.be ** Peter J. Taylor, Michael Hoyler, Department of Geography, Loughborough University, UK *** Pengfei Ni, Chinese Academy of Social Sciences, PRC **** Jin Huang, Xiaolan Yang, Beijing University of Post and Telecommunication, PRC 1. Our approach implies that any given city's connectivity can change because of two reasons: (i) directly because an APS firm's presence in this city in and by itself changes (e.g., a firm moving into the city or upgrading the status of its office(s) will boost a city's connectivity because it now has more or more important connections across the world); but also (ii) indirectly because an APS firm's presence in other cities has changed (e.g., a larger number of offices of a given firm in other cities will increase a city's connectivity if the firm is present there because it now has more connections across the world). 2. This rather tentative basic assumption in WCN research has been repeatedly criticized as it tends to oversimplify the complex and diverse nature of the organizational architectures of international APS firms (see for instance Dicken & Malmberg, 2001; Jones, 2002; Lambregts, 2008). Although it is probably fair to assume that the GaWC methodology is adequate enough to capture the large patterns of change in the geography of global service provision as the use of large data sets will somewhat iron out such idiosyncrasies, the results should nevertheless be interpreted with the necessary caution. Moreover, as one of the referees aptly pointed out, the WCN approach would surely benefit from parallel primary research testing this basic assumption, even if this research only involves a small sample of the entire set of leading APS firms. 3. There was no way to overcome this two year delay: one year was because planning the project takes time and the second year was because of a one year time lag in reporting such data. Thus although the actual data gathering took places in 2008, the selection of firms is based on 2006 rankings. 4. This effect is present in all sectors, with correlations ranging between -0.41 for the sector accountancy and -0.17 for the law sector. Each of the correlations is significant at the 0.01 level, except for the financial services sector and the law sector, where the correlation is significant at the 0.05 level. 5. A non-longitudinal, cross-sectoral comparison unsurprisingly shows that the law sector and the accountancy sector are characterized by the least and most integrated office networks, respectively. Thus while the office networks of leading accountancy firms cover most leading cities in the world, the networks of law firms are far more concentrated in a limited number of cities.
Note: This Research Bulletin has been published in The Service Industries Journal, 31 (14), (2011), 2293-2307 |
||||||||||||||||||||||||||||||||||||||||||||||||||||||||||||||||||||||||||||||||||||||||||||||||||||||||||||||||||||||||||||||||||||||||||||||||||||||||||||||||||||||||||||||||||||||||||||||||||||||||||||||||||||||||||||||||||||||||||||||||||||||||||||||||||||||||||||||||||||||||||||||||||||||||||||||||||||||||||||||||||||||||||||||||||||||||||||||||||||||||||||||||||||||||||||||||||||||||||||||||||||||||||||||||||||||||||||||||||||||||||||||||||||||||||||||||||||||||||||||||||||||||||||||||||||||||||||||||||||||||||||||||||||||||||||||||||||||||||||||