GaWC Research Bulletin 321 |
|
|
|
This Research Bulletin has been published in Area, 42 (3), (2010), 281-292. doi:10.1111/j.1475-4762.2009.00924.x Please refer to the published version when quoting the paper.
IntroductionIn recent economic geography literature, there has been an increase in the debates surrounding the concept of the firm (Taylor and Asheim, 2001; Yueng, 2005; Jones, 2007), and with the complexity of the knowledge economy, the firm is no longer an unproblematized unitary and coherent actor (Grabher, 2004: 105), but a complex network of actors, or an opened black-box' (Jones, 2007). Further to this, we have seen an increase in debate surrounding what is termed buzz' (Bathelt et al., 2004) and how the firm contributes to/feeds off this buzz', and its relationship to scale (local, global, city, region etc) (Hess and Coe, 2006). There have been theoretical attempts to describe the notion of buzz, with other vernacular produced in order to describe the processes at work such as project ecologies' (Grabher, 2004), noise' (Grabher, 2002) and communities of knowledge' (Storper and Venables, 2004). Empirical agendas have also been undertaken to link these concepts to a particular industrial sector. Gertler and Levitte (2005), who focused on innovation in the Canadian biotechnology industry, suggested that local knowledge and global circulations are important to the successful innovative capacity of biotech firms. Also (in keeping with the geographical and industrial area of this paper), Grabher (2002) has highlighted how local noise' is very much crucial to the success of London's advertising industry, with the presence of global pipelines' highlighted by a weak' global tie, characterised by a two-way global information and organisational knowledge forms. In these studies, a principal idiom is networks, as the proliferation of social, intra- and inter-firm networks is what constitutes (and emanates from) the concept of buzz'. Therefore, a study of buzz, be it qualitative or quantitative, needs to engage with these particular networks that are present in any given location or geographical scale. It is at this point in the argument that this paper stakes its claim. In it, we want to argue that the use of social network analysis (SNA) can be used as a viable research tool for highlighting networks within a particular industry and locale, and we have used London 's advertising industry as a case study. Advertising is recognised as a key component of the creative economy, and as a result it is characterised by high levels of social interaction and networking that are prominent across the creative sector (Caves, 2000; Oakley, 2004; Pratt, 2008a, 2008b). However, in this paper we want to argue that buzz itself, while providing us with a useful paradigm with which to conceptualise the ubiquitous and often serendipitous nature of social connections in a city such as London, is rather opaque and often underplays the more formal, and quantifiable connections that are evident within a particular industrial sector of a city. Therefore, in this case study, building upon some of the previous work conducted in this area, we use the data on inter-locking board members of advertising companies in London, and visualise their network maps through network diagrams, known in SNA as sociograms. This method of analysis, under-utilised in the economic geography literature, points to the intensity of connections between firms and particular individuals, shows the paths of knowledge flow within the industry, and can highlight the key gatekeepers'. It has long been known that these interlocking directorates exist across many disciplines and fields, and that the same group of individuals sit on many of the same major company boards of directors. Kono et al., (1998: 864) documented that one of the major structural features of integrating corporate capitalists is interlocking directories. These interlocking directories have been shown to form a cohesive network within many industries (Pennings, 1980; Mizruchi, 1996; Thomas and Sonquist, 2001), and so this paper aims to fuse this methodology with the current prevailing themes in economic geography. Therefore, this paper will be structured into three sections. The first will outline the nuances of the buzz' (and its associated terms)1, the relevant literature surrounding the creative industries and the importance of inter-locking board networks in providing an additional conceptual component to the term. The second section will then briefly describe the methodological approach to the study, and then explore the visualised networks. The final section will provide the analysis, and highlight how this study (and its associated methodology) can aid the development of enquiry into social networks and buzz, not only within the creative industries, but other sectors of the knowledge economy. The Makeup of 'Buzz'Buzz, as it has come to be known, is an important concept in the knowledge economy, particularly in the creative and cultural industries. The wide acceptance of the importance of social networks to these industries (Caves, 2000; Cunningham, 2004) lends itself to the epistemological alignment with buzz'. In other words, the notion of buzz and the face-to-face contact (Storper and Venables, 2004) and noise' (Grabher, 2002) that it entails are symptomatic of the social networks that are so crucial to the functioning of creative industry practices. As is noted:
(Bathelt et al., 2004: 38, emphasis added) The coupling of this phenomenon to the local scale is an important caveat (hence the added emphasis), and Bathelt et al. expand the framework by adding what they refer to as global pipelines', which are more codified linkages external to the locale or region, but which still contribute to the learning ecologies and knowledge exchanges that go on (more of which will be developed later in this section). The creative and cultural industries, while still debated as a coherent economic group (or simply a political collectivisation see Christophers (2007) for this debate), do tend to show characteristics of local buzz through the intense social networking that characterises many of the sub-sectors: that is, the high levels of trust (both positive and negative), the interactivity that occurs in the local services (such as bars, restaurants and cafés), and the collaborative activities enacted through projects or events (Weller, 2008). Historically, the concept of buzz (as it is known in twenty-first century economic geography) can be attributed to Alfred Marshall when he talked of industrial atmosphere', which is a strong centre of specialised industry that attracts new shrewd energy to supplement that of native origin and maintain its lead (Marshall, 1920: 287). Despite the age of this concept and the fact that this was in relation to heavy manufacturing industry dominant at the time, it still holds an element of truth for the knowledge economy of today. Particularly resonant is the notion that an advantage can come about from the agglomeration of people and firms (albeit with an increased technological connectivity). The advantages of simply being there' (Gertler, 1995) and immersing in the social activities and industry chatter' are evident in the learning of current and developing innovations and knowledge, often shared informally between firms and people in informal settings (Jones, 2007). Additionally, the concept of buzz can be thought of as an idea or general excitement within a small cluster of actors working in an industry. Although difficult to quantify in a tangible way, it is often identified in hindsight, after an initial idea has filtered through into the mainstream and has been acknowledged (Grabher, 2002). Buzz can therefore be seen as stemming from a small cluster of actors that have a link (or links) to other clusters in order for the buzz phenomenon to spread and be recognised. However, Bathelt et al., (2004: 38) go on to suggest that;
The serendipitous nature of buzz is an appealing concept within the creative and cultural industries, particular as they are populated by large numbers of freelance and small-sized firms. And there is little doubt that having your finger on the pulse' of the industry when you are a one-man-band' is vital to your eventual success, but in terms of the larger more established firms within the industry, buzz can emanate from more formal settings; moreover, settings which can be quantified, namely inter-locking boards of directorates. This framework of research then is a timely intervention to the creative and cultural industries, as it is the inter- and intra-firm networking that is idiosyncratic of many of the sectors (Caves, 2000; Christophers, 2007), and fuels innovation in the wider knowledge economy (Howells, 2002), yet is minimally understood in economic geographic realms. The use of SNA in this paper is an attempt therefore to provide an alternative methodology of quantifying' this networking, through inter-locking boards of advertising companies in London, not only to provide an additional conceptualisation of buzz (which is underplayed hitherto in the literature), but also to provide much needed evidence of (official) inter-firm connectivity in the creative economy of cities. Interlocking directorates arise when two companies share one or more director (Kono et al., 1998: 863) and such interlocking directorates have been identified as a major characteristic of capitalism (ibid). They can provide a glimpse into the connectivity of firms within a sector and studying them with a SNA approach allows for a calculation of that connectivity (O'Hagan & Green, 2003). Inter-locking boards can be seen as integral to the theory of a small world network. A small world network is a network structure that is highly locally clustered but with small path lengths. Small world networks were first documented by Milgram (1967) when he became interested in how individuals have links with only some members of a society. He proposed that people have links with a small cluster of friends who in turn know each other; these clusters overlap and linking people join clusters together to make a much larger network. He tested this proposition by looking at the connections between two strangers and concluded that there existed six degrees of separation' (on average six intermediaries linked two strangers). This theory (not without its critics) was also shown to be applicable to fields' such as friendships and corporate elites etc. (Watts 1999; Davis et al., 2003). Newman (2001) for example, looked at scientific co-authoring and found that the university academic structure also had this small world network structure. It is this small world network structure then that we are looking to analyse empirically in this paper. Other work carried out focusing on London 's advertising industry highlights the serendipitous nature of buzz', namely Grabher's (2002) insightful and highly informative work on the project based nature of London 's advertising industry. He highlights how London 's advertising industry is projectised', the key to which is the buzz, or local creative milieu:
(Grabher, 2002: 258) The noise' which Grabher is denoting here is a feature of many of the creative and cultural industries (Caves, 2000; Ekinsymth, 2002; Pratt, 2008a, 2008b) but in particular advertising, as the short-term nature of the projects need highly mobile actors who can work from project-to-project at short notice. As a result, interpreting industry noise' into workable functions (what Grabher calls signals') is a key skill in negotiating the social networks from the periphery to the core. Hence, it is generally agreed that buzz is important and is local, and there have been research attempts at discovering how buzz is manifested, maintained, geographically spread, or connected through intra- and inter-firm networks (see Glückler, 2006). It is also a crucial concept in explaining the way in which firms interact with one another, and provides a framework in which the black box' of the firm can be opened (Taylor and Asheim, 2001; Ekinsmyth, 2002; Yeung, 2005a, 2006; Glückler, 2006; Jones, 2007; Weller, 2008). However, the concept of buzz, while generally accepted, still has a patchy empirical base to highlight what it actually is (Jones, 2008). Who does it involve? What are they saying to one another? How local is local? There have been attempts at answering these questions and we have already discussed Grabher's work in relation to the thematics of this paper. Other contributions of note include Gertler and Levitte (2005) who studied the biotechnology sector of Canada. While they were focusing on the innovation process of firms, they concluded that 'local'/relational linkages are especially important for raising capital (and, presumably, the expertise that comes with it) (Gertler and Levitte, 2005: 504). Another study, relevant to the creative and cultural industries is Watson's (2008) research into London 's music industry. Using qualitative data, he argues that;
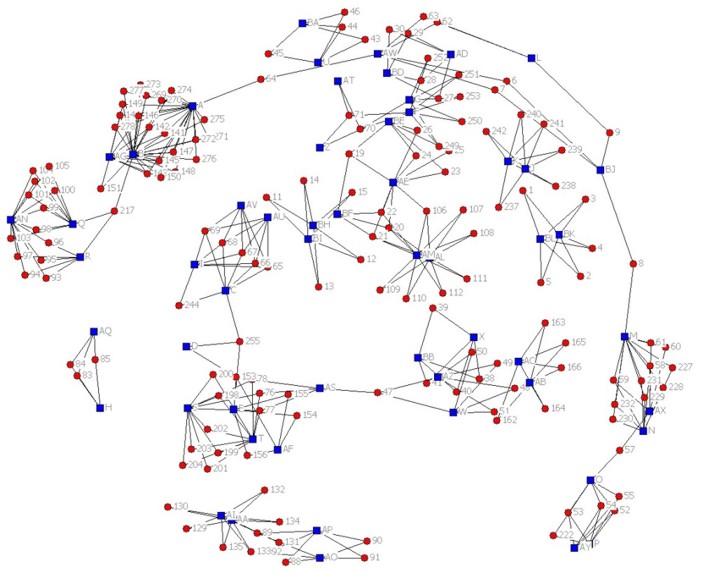
(Watson, 2008: 20) The informal nature of the music industry and the inherent trust that is needed to conduct work is a factor to a greater or lesser degree across the creative economy, and the local, face-to-face contact is a crucial aspect in building the networks of trust (Storper and Venables, 2004). Other ventures into the concept include Reimer et al. (2008), who focused on the UK's design industry, and noted that the city, particularly London, was the key place that encouraged buzz, although noted (by one interviewee at any rate) that it was due to the pace of life', rather than any creative' feel (Reimer et al., 2008: 163). These examples provide incidental data (in terms of location and industry) on certain measurable (quantitative and qualitative) aspects of buzz. Also, as Gertler and Levitte (2005) noted in their study, using mainly quantitative methods, investment from individuals is also likely to be localised, but they go on to suggest that firms must also be well connected to globally circulating knowledge and people (ibid.: 505), echoing Bathelt et al.'s (2004) conceptualisation that local buzz is complemented by more stable' global pipelines. These global pipelines' are said to be mutually reinforcing' of local buzz (ibid.: 41), an argument which is given empirical credence with a number of studies. However, while we are not disagreeing that these more codified' pipelines do indeed intensify the local learning through buzz, we want to suggest that this codification (or rigidity) of knowledge can be local as well as global, moreover, they can be measured. There is already a plethora of literature supporting the concept of the importance of local networking (most notably Saxenian, 1994), yet inter-locking board data is seldom used, and SNA even less so. MethodologyThe methodology of this paper will interdigitise the concept of inter-locking board directorates' data and SNA to provide a unique take on the formal aspects of localised networking, which we have argued can be considered a measurable component of the buzz' concept. The data for the network analysis was retrieved from the UK Companies House database (accessed online via a third party supplier, DASH). It used the UK SIC 2003 advertising classification2 search strategy with the added criteria of Inner and Outer London regions. Spurious data (and in particular boards of directors that are empty or not valid, e.g. ACME secretarial services) were removed from the dataset and the resulting data was then filtered to only include people on at least 4 company boards of directors. There are, however, a few issues with filtering the data in this way. Firstly, those people who connect to 3 disparate companies, but may have then turned out to have high network centrality scores, have been circumnavigated by selecting a cut-off point of 4 companies. If, however, the data was taken as a whole, those people may have been revealed as highly influential. The filtering process also results in a very people-centric analysis. In other words, the data reflects people on many boards of directors rather than boards of directors who have a wide variety of people. A board of directors in company A, for example, may contain a large number of highly connected people, but those people are only on 3 boards of directors and therefore both company and people are not selected during the filtering process. However, in order to maintain clarity, it was then necessary to have a cut-off point, as the sociograms would become unreadable as the significance of the methodology to the concept of measuring buzz reduced. For the purposes of analysis, the filtered data was reformatted into a rectangular matrix' (for the 2 mode network: company to director) and an adjacency matrix' (for the 1 mode networks: director to director or company to company). Attribute data was then associated to the chosen interlocking directorates. Also, the variable Rank of company (by net asset)' was obtained. This was used purposefully, as it is a diagnostic of the network dynamics. The size of the company is an important factor as it highlights how it is not always the largest companies that are the most connected' or the most central. Turnover was another variable that could have been used, but the data for this was intermittent, or in some cases, consisted of a range. We also obtained data on the holding company, as it allows us to see the broader company family tree'. Both the network data and attribute data were then imported into the software and the analysis of density and centralization (degree and eigenvector) carried out. The analysis and visualization presented in this paper are based on the UCINET and Netdraw software packages (Borgatti, et al., 2002). The companies and people involved in this network analysis have been made anonymous for confidentiality purposes moreover the purpose of the research is to highlight the functionality of SNA in empirically evaluating a city's industry, rather than to expose the most connected individuals or companies. FindingsThe dataset was large and there was a plethora of ways to dissect the information and produce various different narratives. In order to maintain clarity and relevance to the concept of buzz, we have split the findings into four parts, with each part outlining a relevant result and its implications for the notion of buzz in London 's advertising industry. While each part represents one particular area of relevance, due to the nature of the data, there will be a certain amount of cross over between sections in order to highlight particular points. Connectors and Cut PointsFigure 1 People and companies network diagram
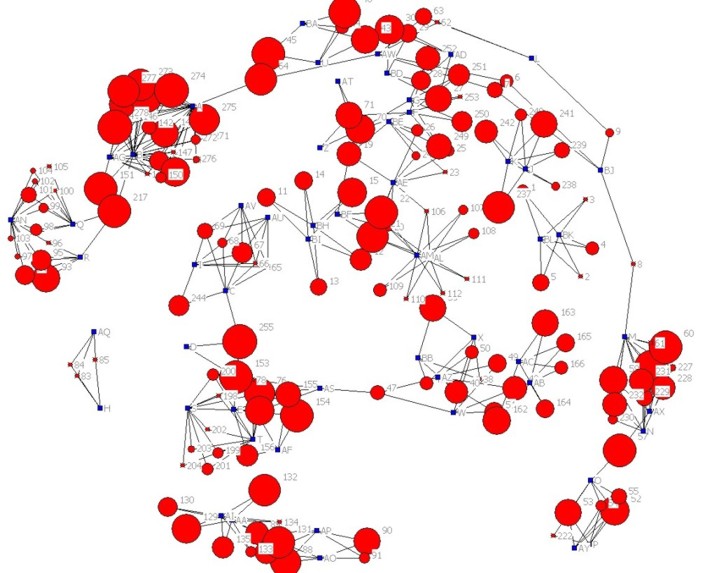
The sociogram in figure 1 shows the relationship between companies (red circles) and the people who sit on those company boards of directors (blue squares). This network diagram shows that collections of individuals sit on the boards of directors of a number of similar companies. Persons AL and AM, for example, sit on the same 9 company boards of directors. Figure 1 also shows that the advertising sector at this level is relatively well connected. There is, for example, at least one way of reaching company 45 from company 222, even though they span the whole' network. It can be seen from figure 1 that this connectivity comes about from key individuals or companies bridging between clusters, thus allowing the advertising sector to form one large cohesive group, suggesting that knowledge can disseminate quickly throughout the entire industry. There exists a small number of additional weak, but connected, component groups, and these individuals or companies we call cut-points' in the network (such as individual AS). Cut-points are nodes that, if they were removed, would separate a group of nodes into two unconnected parts. For example, if company 47 was removed, a small break-away grouping of companies and people would be split from the main component and then not be privy to the knowledge transfer from the wider industry. In addition to cut-point people and companies, there are also a few chains of nodes that join one network group to another. If a link from that chain' were removed (a relationship with another company was lost for example), the chain would be broken. This can be seen with the connection between person O, company 60 and person AX. This particular chain is far longer than these three nodes, and spans from person AX to company 94 and loops round again to form the main component. However, within this main component there are certain aspects of the chain that make the component very vulnerable; person O, company 60 and person AX are example of this vulnerability. So cut-points are key, but chains are vulnerable. Figure 2 People and companies network diagram with node size representative of company size
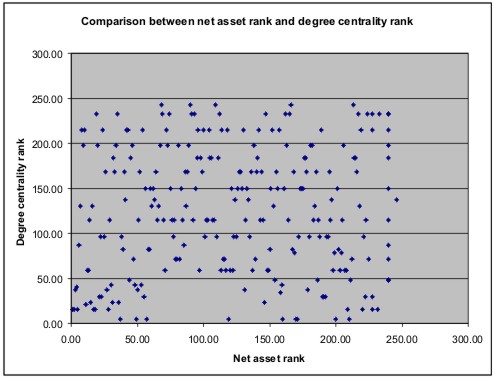
In figure 2, the sizes of the red nodes are representative of the company's net assets (ranked). When comparing figures 1 and 2, some companies in that chain (for example the cut-points) are not particularly large (in terms of net assets). They are, however, hugely important in providing a connection and cohesion to the network. Company 9 can be seen as one such instance where it is not one of the largest companies but does provide a cut-point role. Similarly, figure 2 shows that companies of a similar size do not cluster together, and that people on differing boards of directors do not sit on companies of a comparable size. Persons K and J, for example, sit on a range of differing sized companies. Hence, the same individuals appear on a small number of company boards of directors. In this network, 64 people sit on 286 company boards of directors. Out of all the possible company connections, 5.32% demonstrated ties and from all possible individual connections, 1.15% ties were found. These figures seem relatively low, especially when looking at the visualisation of the network (figure 2). Although the density levels are not high, figure 2 shows that the connections that do exist are strategic. This is because links are present between groups and this joins sub-sections of the network together. For example, the main component in figure 2 is one large group that is connected by at least one company or person, which makes it one cohesive mass. For the sector as a whole, there are small dense groups of companies/people loosely connected to other small dense groups - a network pattern that is characteristic of a small world network. A consequence of this is that large mass groupings exist with only a few connections that inter-join the dense sub-groups. In essence, the large mass group that make up the network is very reliant on a few companies and people (cut-points) who join sub-groups together. If one or two of these strategic people were to leave the network without replacement, the main component of the network would be splintered. Hence, cut-point individuals, such as AS, are no doubt highly sought after (by the smaller connected group at least) in terms of their knowledge of board chatter'; and cut point companies (such as company 9) become strategic knowledge gatekeepers' and are potentially trend-setters when it comes to prevailing fashions within the industry. The findings also points to a desire for heterogeneity in board selection, aligning with the broader prevailing arguments around buzz, which suggests that innovation and business development intensifies with a wider variety of component parts (Bathelt et al., 2004; Gertler and Levitte, 2005; Schilling and Phelps, 2007). There are a number of reasons why the network manifests itself like this way (large masses connected via strategic cut points). It could also be that the companies may have their headquarters in the same physical area (see point 4 in this section), and it is also possible that those boards of directors are friends and/or have worked together in the past. The most plausible factor however is that a collection of companies may all belong to the same holding company. Our analysis was conducted to test this hypothesis, and having compared board data for holding companies and their subsidiaries as a centralising factor, it seems that people who sit on the board of a holding company also sit on the board of their subsidiaries. This is hardly surprising, but there was also a small, but highly connected' number who crossed the company family', i.e. they were on boards for two or more different holding companies and their subsidiaries. It was therefore no surprise to see that is was these people who populated the cut-point' nodes in the network, again suggesting that these people would be highly sought after' for industry buzz, as the can transmit (or indeed restrict) knowledge between company family trees. Performance IndicatorsWe can also assess the impact of being in a certain network role, centrality or being in a dense group of companies/people, via a measurable performance indicator in this instance, the net assets available last year variable of a company. In order to do this, the net asset variable of each company was ranked and this was compared to centrality rank for that company. Spearman's Rank Correlation Coefficient (SRCC) was then used to test whether there is any correlation between each set of ranks. SRCC evaluates p = 0.0467. Because a critical value of 0.5 confidence levels with 2-tail testing = 0.138, the p value is too low to suggest that there is any correlation between the net asset rank and centrality rank. This is also confirmed in the scatter diagram in figure 3. This finding seems to suggest that being a certain size company has no bearing on that company being centralised (i.e. with many links) within Lodnon's advertising network. Small, medium or large companies can, therefore, play an important part in connecting companies and groups. Figure 3 Scatter diagram showing net asset rank against degree centrality rank
This finding very much resonates with the conceptual literature on the creative and cultural industries which suggests that firm size is not an indicator of networked importance. The long tail' of the industry sector (Caves, 2000; Florida, 2002) creates a large population of small and medium-sized firms who will begin to network in order to innovate and develop. Our findings suggest that this trend is continuing, with firms of varying sizes connecting with each through inter-locking boards, with no scalar' division of connectivity. Far-reaching InfluenceHaving seen how the networks of inter-locking boards in London 's advertising industry manifest themselves, we have been able to highlight the precise nature of the connections and their inter-city locations. Quantifying the networks (of inter-locking boards) has provided a description of the industry in London, laying out some of the key characteristics of the buzz' within the industry. It becomes clear, however, that while this research provides a snapshot' of the network or a skeletal mainframe of connectivity, the reasoning for the connections and intensity as well as the specifics of the communication are less clear. Therefore, additional SNA methods through which the advertising sector can be analysed that incorporate a quantification of these people's importance (and hence are a diagnostic of the intensity of an individual in the network), are degree centrality measures and the eigenvector index. Degree centrality is a simple measure that counts the number of ties a person has. Using this measure, the following people (table I) can be considered the most central in the network that has been visualised in figures 1 and 2: Table 1 Top 10 most connected people in the social network (degree centrality)
In addition, the eigenvector index is a mathematical measurement of the connectedness' of any particular node in a social network. The more connections that are related to a particular node, the higher the index of that node. It also measures the importance' or centrality' of each connection through other connected nodes (see Rahnau, 2000 for further details). Further the degree centrality measure, the eigenvector centrality looks at the whole' network rather than looking simply at a person's local (or proximal) ties. Eigenvector centrality statistically reveals those people who are central' to large important sub-groups, rather than visually as in figures 1 and 2. The top 10 people with the highest eigenvector centrality scores appear below in table II: Table 2 Top 10 most connected people in the social network (eigenvector centrality)
It is important to note that this a different kind of influence (or power') that that held by cut-point individuals who hold the network together, rather than being well connected which the eigenvector is diagnostic of. As can be seen from the two tables, while persons A and B are the most centralised' people using both measures, the rest of the top 10 differs, with those in table II having more influence' as their connections spread further through the network, as opposed to those in table I where a simple count of their connections has been made (so their connections could stop after just 1 step' in the network). Therefore, it could be said that while people AL and Q both have 12 connections, person Q's connections go on to other people who connect to other people (and so on) and so have a further reaching effect (i.e. influence) on the network than person AL, whose connections may stop after one connection. Person Q can therefore be said to be shortening the path' in the network for others, keeping the network relatively tightly compacted within the Soho/central London area suggesting that the advertising industry could be considered a small world' (Milgram, 1967), and hence indicative of the characteristics that constitute local buzz. Location, Location, LocationThe last, but arguably the most important variable that we used (and importantly for our discipline) was location. The postcodes for the top 10 connected companies were mapped, producing a highly centralised cluster in one specific area, with 5 of the top 10 located in one building. Further desk research showed that this building is an office block with many individual units available to rent to individual companies (sometimes known as incubator spaces' (Roodhouse, 2006)). One of the companies is an internationally-recognised advertising firm with a board of directors that comprises many influential people in the advertising industry. This would suggest that there is strong geographical effect on the networked-centrality of London 's advertising companies more so than size. Also, it is argued that creativity is nurtured more vehemently in medium and small sized firms, and the larger companies simply pay for their services when outsourcing the creative part of their production (Landry, 2002; Oakley, 2004; Pratt, 2008). Members of the boards of these companies would then be particularly active, working for a number of the larger companies as well as liaising with other small to medium sized companies on larger projects (Grabher, 2002, 2004), hence these companies holding strategic positions in the network. Whether this proximity and associated high network centrality is a cause or effect of the presence of an internationally recognised company will need to be the subject or a more qualitative research agenda. More immediately, it points toward the fact that London 's advertising industry has a distinct local inter-board connectivity, or several clusters of buzz: a set of networks of board members that are located in close proximity to each other, particularly in the Soho area of London. This ties in with Grabher's (2002) findings that Soho is seen as place to hang out' and not simply an agglomeration of companies for cost reduction strategies alone. However, what figures 1 and 2 show is that (for board members at least) while the clustering is not that prolific (only 5.32% of ties were made from all possible connections), it is the strategic connections that are the most important. Figure 1 in particular highlights those people that can be considered gatekeepers' or cut-points of the network (Rowley, 1997). These people bond a network together, they can spread ideas from one group of companies to another and they form an integral part of a collective understanding within the community. There are also people who are the points of contact within the network that can reach the broadest range and number of people or companies (as revealed by the eigenvector index); in other words, there are gatekeepers and networked individuals who provide access to the network as a whole. They also shorten the path length' for those within the network, assimilating large numbers of contacts and acting as a bridge between them akin to the small work theory (Milgram, 1967) discussed in the first section. This type of networking, while it may be facilitated by hanging out' meetings that serendipitously occur; is codified in the board room. Therefore, these findings suggest that while buzz is indeed a highly appropriate concept for explaining the exchange of tacit knowledge in a general city area, through the inter-locking board buzz, there is a distinct codification of knowledge, which is in some cases extremely centralised (i.e. in one building). As a brief suffix, while this methodology stops short of measuring the international aspect to inter-locking boards, these gatekeepers may very well be conduits of the pipelines from the global into the local buzz (Bathelt et al., 2004). ConclusionThe modern knowledge economy has benefited from new economic geographical thinking, and the concepts of buzz, project ecologies' (Grabher, 2004), noise' (Grabher, 2002) and communities of knowledge' (Storper and Venables, 2004) are all progressive attempts at comprehending its inherently complex and ubiquitous nature. However, while the theoretical march is in full flow, it is crucial for empirical studies to keep pace, as without rigorous and reliable data, these concepts will remain in the realm of theoretical abstraction. It is crucial therefore that, as researchers, we arm ourselves with the most cutting-edge methodological techniques. This paper has added SNA to the methodological arsenal of economic geographers, and through using it to evaluate and analyse London 's advertising industry, we have brought to the fore rigorous ways of displaying this much needed data. As a result, SNA has made the concept of local buzz is a little less opaque, and we can develop further understanding by using these inter-locking board networks as quantitative network calibrators, or platforms for more nuanced (i.e. qualitative), or more geographically inclusive (i.e. global) studies. The increasing importance of the network as a theoretical, conceptual and empirical tool for analysis only furthers the advantage of SNA as an research tool, as it can be applied to any data that are collected about networks at any scale', and it is not restricted to people or companies, or to within cities. What the study also shows is that the advertising industry, traditionally a highly competitive and cut throat' business (Grabher, 2004), and considered as having a distinctly different economic landscape to other cultural and creative industry sectors, is in fact relatively connected via its boards. It displays characteristics that are shared throughout the cultural economy sectors, such as a long tail' and the fact that the size of a company is by no means a diagnostic of importance. Advertising is notoriously dynamic and is dependent on trends and fashions (or in the most successful cases, trend-setting) and so the exchange of knowledge is crucial to economic viability. The data displayed in the sociograms show that the industry within London is indeed highly connected (with a handful of individuals holding the network together) allowing for information to flow more freely. This adds empirical weight to the long held belief that London is a key global city for advertising, and the highly connected nature of the industry is no doubt a catalyst for London 's success. Also, SNA allows us to display elements of descriptive depth' (such as centrality index scores) to the network, allowing for a measure of the connectivity of people within it. In other words, using a quantitative methodology, SNA is able to display some of the characteristics of the network (in this case study, the degree of connectivity of some of the people/nodes in the network) that goes beyond a simple count of connections. As such, it highlights not only the connectedness, but also the important people within London 's advertising industry. As such SNA can identify those people that are crucial in instigating, maintaining or communicating the industry noise' (as Grabher, 2002 puts it) or more generally, the local buzz. What this paper has not done however, and which could be a further line of enquiry, is to conduct a similar methodology of the global advertising industry and note any overlaps (in people and companies). This is obviously a larger undertaking but it could extend the networks that have already been displayed in this paper to other localities (New York would no doubt feature highly), and identify which people are the most connected globally'. Then we would also be able to identify the global gatekeepers', as well as pinpointing the board members who link the global networks with the local ones, thereby acting as conduits of global knowledge. In keeping with the earlier discussions in the first section of this paper, further study could also include qualitative research methods (akin to Watson, 2008 and Reimer et al., 2008) to add meat to the bones' that have been sketched out using SNA. Interviews, case studies or even ethnographic techniques (in particular, Schoeberger's (2001) corporate biographies which would be applicable to a global industry such as advertising) could be used to provide more descriptive textual data of the connections that are denoted here and how they are constructed. REFERENCESBathelt H, Malmberg A and Maskell P. (2004) Clusters and knowledge: local buzz, global pipelines and the process of knowledge creation. Progress in Human Geography 28(1): 31-56. Borgatti S.P., Everett M.G. and Freeman L.C. (2002). Ucinet for Windows: Software for Social Network Analysis. Harvard, MA: Analytic Technologies. Caves R. (2000) Creative Industries. Harvard University Press, Cambridge. Christophers B. (2007) Enframing creativity: power, geographical knowledges and the media economy. Transactions 9: 235-247. CIO (2008) Designer London: A Report into the Subsector of Design in London. Creative Industries Observatory, London. Available at http://www.creativeindustriesobservatory.com/UserFiles/File/Design%20Report/CIO%20Design%20Report(1).pdf, accessed 29th September, 2008. Cunningham S. (2004) The creative industries after cultural policy: A genealogy and some possible preferred futures. International Journal of Cultural Studies 7(1): 105-115. Davis G.F., Yoo M. and Baker W. (2003). The small world of the American corporate elite, 1982-2001. Strategic Organization 3: 301-26. Ekinsmyth C. (2002) Project organisation, embeddedness and risk in magazine publishing. Regional Studies. 36(3): 229-243. Florida R. (2005) Cities and the Creative Class. Basic Books, New York. Gertler M. (1995) Being there': proximity, organization, and culture in the development and adoption of advanced manufacturing technologies. Economic Geography 71: 1-26. Gertler M. and Levitte Y. (2005) Local nodes in global networks: The geography of knowledge flows in biotechnology innovation'. Industry and Innovation 12(4): 487-507. Glückler J. (2006) A relational assessment of international market entry in management consulting. Journal of Economic Geography 6: 369-393. Grabher G. (2002) The project ecology of advertising: tasks, talents and teams, in G. Grabher (ed.) Production in Projects: Economic Geographies of Temporary Collaboration. Regional Studies Special Issue 36(3): 245-63. Grabher G. (2004) Learning in projects, remembering in networks? Communality, sociality and connectivity in project ecologies. European Urban and Regional Studies 11(2): 103-123. Hess M and Coe N. (2006) Making connections: global production networks, standards, and embeddedness in the mobile telecommunications industry'. Environment and Planning A 38(7): 1205-1227. Jones A. (2007) More than managing across borders? The complex role of face-to-face interaction in globalizing law firms. Journal of Economic Geography 7: 223-246. Jones A. (2008) Beyond Embeddedness: economic practices and the invisible dimensions to transnational business activity. Progress in Human Geography 32(1): 71-88. Kono C., Palmer D., Friedland R. and Zafonte. M. (1998) Lost in space: The geography of corporate interlocking directorates. The American Journal of Sociology 103(4): 863-911 Landry C. (2002) The Creative City: A Toolkit for Urban Innovators. Earthscan Publications, London. Marshall A. (1920) Principles of Economics (8th edition). Macmillan and Co. London. Milgram S. (1967) The small world. Psychology Today 2: 60-67. Mizruchi M. (1996) What do interlocks do? An analysis, critique, and assessment of research on interlocking directorates. Annual Review of Sociology 22: 271-298 Newman M.E.J. (2001) The structure of scientific collaboration networks. Proceedings of the National Academy of Sciences 98: 4049. O'Hagan S. and Green M. (2003) Corporate knowledge transfer via interlocking directorates: a network analysis approach. Geoforum 35(1): 127-139. Oakley K. (2004) Not so cool Britannia. International Journal of Cultural Studies 7(1): 67-77. Pennings J.M. (1980) Interlocking Directorates San Francisco: Jossey-Bass Pratt A. (2001) Understanding the cultural industries: Is more less? Culturelink 35: 51-68 Pratt A. (2008a) Cultural commodity chains, cultural clusters, or cultural production chains? Growth and Change 39(1): 95-103. Pratt A. (2008b) Creative cities: The cultural industries and the creative class. Geografiska Annaler B 90(2): 107-117. Reimer S., Pinch S. and Sunley M. (2008) Design spaces: agglomeration and creativity in British design agencies. Geografiska Annaler B 90(2): 151-172. Roodhouse S. (2006) Cultural Quarters. Intellect, Bristol. Rowley J. (1997) Moving beyond dyadic ties: A network theory of stakeholder influences, Academy of Management Review 22(4): 887-910. Saxenian A. (1994) Regional Advantage. Culture and Competition in Silicon Valley and Route 128. Harvard University Press, London. Schilling M. and Phelps C. (2007) Interfirm collaboration networks: the impact of large-scale network structure on firm innovation. Management Science 53(7): 1113-1126. Schoenberger E. (2001) Corporate autobiographies: the narrative strategies of corporate strategists. Journal of Economic Geography 1(3): 277-298. Storper M. and Venables A. (2004) Buzz: face-to-face contact and the urban economy. Journal of Economic Geography 4: 351-370. Taylor M. and Asheim B. (2001) The concept of the firm in economic geography. Economic Geography 77(4): 315-328. Thomas K. and Sonquist J. (1977) Interlocking directorates in the top U.S. firms.Insurgent Sociologist 5:196-229. Watson A. (2008) Global music city: knowledge and geographical proximity in London's recorded music industry. Area 40(1): 12-23. Watts D.J. (1999) Small Worlds: The Dynamics of Networks between Order and Randomness. Princeton, N.J.: Princeton University Press. Weller S. (2008) Beyond global production ntworks: Australian Fashion Week's trans-sectoral synergies. Growth and Change 39(1): 104-122. Yeung H. (2005) Rethinking relational economic geography. Transactions of the Institute of British Geographers 30(1): 37-51. Yeung H. (2006) Firms, in Douglas I., Huggett R. and Perkins C. (eds.), Companion Encyclopaedia of Geography: From Local to Global. Routledge, London: 341-52.
NOTES* Oli Mould, Department of Geography, Loughborough University, UK; email: o.m.mould@lboro.ac.uk ** Sian Joel, Faculty of Engineering, Computing and Creative Industries, Napier University, UK; email: sialt0226n@hotmail.com 1. For the sake of clarity and simplicity, throughout the paper, the term buzz will be used to refer to the various other vernacular. While we are aware of the subtle differences between the term buzz and (for example), noise (see Grabher, 2002), we will crystallise these arguments by simply referring to these concepts as buzz. 2. The classification of SIC codes to the advertising industry was done by choosing those SIC codes that matched the DCMS definition of the advertising industry supplied in their Mapping Documents of 1998 and 2001.
Note: This Research Bulletin has been published in Area, 42 (3), (2010), 281-292 |
|||||||||||||||||||||||||||||||||||||||||||||