GaWC Research Bulletin 320 |
|
|
|
This Research Bulletin has been published in Area, 43 (2), 173-182. doi:10.1111/j.1475-4762.2010.00968.x Please refer to the published version when quoting the paper.
IntroductionAsian cities are closing in on London and New York in a ranking of competitiveness among the world's leading financial centres. This was the executive summary of the 6th edition of The Global Financial Centres Index (GFCI), published in September 2009. The GFCI is produced twice yearly by the Z/Yen Group think-tank in association with the City of London corporation, and rates major international financial centres in terms of competitiveness'. The latter is calculated through a factor assessment model', which combines external indices such as office rents, airport satisfaction and tax rates with assessments based on responses to an online questionnaire. The September 2009 GFCI reveals that Singapore and Hong Kong have managed to weather the financial storm better than most of their leading US and European counterparts (even to the degree that they are closing in on London and New York), while Shenzhen, Shanghai and Beijing have also substantially increased their competitiveness' during the financial crisis. Such observations are obviously in line with the anticipated geographical shift in the world-economy from West' to East' (e.g. Arrighi 1994; Frank 1998; Derudder et al. 2010): the financial crisis, it would seem, is acting as a major catalyst for a larger geo-economic sea change. This West to East' reading of the financial crisis is also evident in a recent paper by Aalbers (2009). In his article on geographies of the financial crisis', Aalbers (2009, 39) states that one of these geographies relates to the fact that we may also see a shift in the dominance of financial centres. The financial crisis does not directly lead to the fall of Wall Street (New York) and The City (London), but it does accelerate the trend towards a shift in financial centres. There are now more secondary financial centres in the world and the centres of increasing importance are to be found outside Northern America and Europe. Aalbers points to the rise of Hong Kong, Dubai, Shanghai, Mumbai and Singapore, but stresses that there will also be uneven geographies within this rise of the East' as factors such as quality of life and political stability are important. At the same time, however, this particular reading of the shifting geography of financial centres is met with considerable skepticism. The Banker, for instance, the leading international financial affairs publication owned by The Financial Times, recently issued a press statement in which they emphasized that amidst all apparent chaos and change it was actually pretty much business as usual for the leading banks, and, therefore, the financial centres in which they are located:
In their overview of the health of the world's leading banks in 2008, The Banker does note the strong position of China. There are, for instance, five Chinese banks in the Top 25 by pre-tax profits, more than any other country (e.g. the Industrial Bank of China and China Construction Bank were the most profitable banks in 2008). But rather than seeing this Chinese success' as a sign of a large-scale shift in the geography of banking centres, The Banker notes that this uncharacteristic 2008 profitability should primarily be understood as a matter of sound banking rather than shifting economic and financial geographies: the profitable banks have been those that stuck to the basics of banking more than anything else taking deposits and lending in their home markets. In other words, rather than an epochal shift in the geography of banking centres, The Banker suggests that beyond a limited number of spectacular bankruptcies stability has perhaps been the single most important feature of the geography of banks during the financial crisis. The purpose of this short empirical paper is to paint a more nuanced picture of how leading cities have been faring under the financial crisis. Because of the vagueness and complexity involved in the international financial centres' (IFCs) concept, we will focus on the more narrow but less blurry category of international banking centres' (IBCs). To map changes in the geography of IBCs, we use data on key indicators of the world's leading banks for 2007 and 2008. Rather than focusing on individual banks or the countries in which their headquarters are located, we aggregate indicators at the city-level to outline some key features of shifting IBC geographies. The remainder of this paper is organized as follows. The next sections introduce the IBC definition employed in this paper and the datasets and the way in which these were transformed for the purposes of our analysis. We then outline the major patterns that emerge from the data analysis. The paper is concluded with a brief review of the implications for future research on financial geographies in general and the geographies of the financial crisis in particular. IFC/IBC geographiesAs indicated in the introduction, it is very difficult to operationalize the complex and variegated notion international financial centre' (IFC). In principle, IFCs represent the primary markets where finance capital and currency is collected, switched, disbursed and exchanged. In the last two decades, there has been a trend towards disintermediation in finance, which has put the importance of markets and investors to the fore. Because markets have largely become virtual, increasing shares of the day-to-day activities in IFCs are related to the management of hedge funds, private equity funds, pension funds, and assets rather than banking sensu strictu. More importantly, however, the spatiality of this diversification is uneven: cities such as Luxemburg and Dublin are dominated by investors, Amsterdam and Frankfurt are examples of centres dominated by banks, while London has a balanced share of both. To deal with this fuzziness, we restrict ourselves to one specific element of what makes a financial centre', i.e. headquarters of leading banks in relation to key indicators of their overall performance. As a consequence, rather than dealing with shifting patterns in the geography of IFCs per se, in this paper we will focus on the more narrow but less blurry category of international banking centres' (IBCs). The straightforward IBC definition we adopt in this paper, therefore, is that of an agglomeration of banking headquarter activities in a specific location. Although less ambiguous than any characterization of the IFC concept, this working definition of IBCs also entails a number of potential ambiguities because of differences in the scale and scope of the activities that occur within these locations. For instance, a bank head office does not necessarily involve a large amount of employment. Indeed, some head offices are merely holdings locations of banks that own most of their assets through foreign subsidiaries, make most of their revenue outside of their home country, and employ most of their staff in other economies1. Unsurprisingly, therefore, a number of scholars have developed typologies of IBCs. Tschoegl (2000) reviews these typologies, which collectively lead him to the conclusion that IBCs should essentially be viewed as highly competitive marketplaces rather than command bunkers'. As he observes,
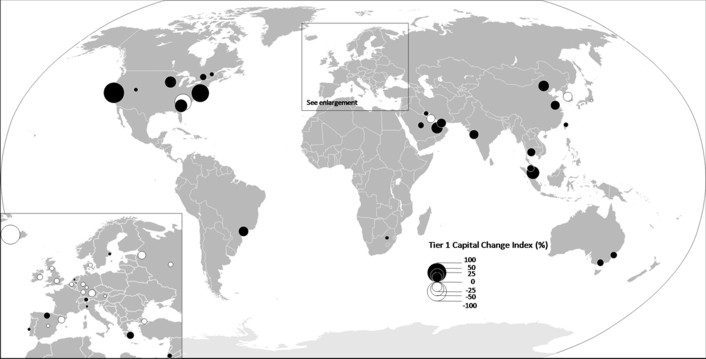
Furthermore, the straightforward focus on a specific location in space engendered by looking at head offices alone may obfuscate the complex spatialities of IBCs. As von Peter (2007) points out, the term centre' in principle also suggests a notion of space that emphasizes a position in relation to other locations. From this perspective, IBCs should be identified based on the position they occupy in relation to other locations. This would lead to a range of measures in which size' per se (however defined) is only one indicator of a banking centre's multifaceted dimensions. Although the best connected and most central locations are generally also the largest centres, an important network position need not come with size. And even where such network measures coincide with size, as for most top-tier IBCs, they may well help explain market share: a central position attracts deposits and the participation of foreign banks and thereby contributes to reported size (von Peter 2007, 43). Although these observations remind us of the complexity of the conceptual and empirical associations between size, connectivity and headquarter functionalities, the fact that these are somehow functionally connected (especially in leading IBCs) also implies that an analysis of key performance indicators of leading banks in relation to their headquarter location may shed light on the geography of IBCs. The Banker 1000 Data SetIn this paper, we use data derived from The Banker's well-known annual list of the world's leading banks2. Here we use the data reported in the July 2008 and July 2009 issues, which summarize the 2007 and 2008 performances of the world's leading banks respectively3. For each year, the selection of banks is based on the level of Tier 1 capital, but the dataset also contains myriad other measures of bank strength and performance. The use of the level of Tier 1 capital for selecting banks is a logical choice in the world of finance, as this is the core measure of a bank's financial strength from a regulator's point of view. Tier 1 capital is the shareholders' equity available to cover actual or potential losses. It is composed of core capital, which consists primarily of common stock, disclosed reserves and retained earnings, but excludes cumulative preference shares, revaluation reserves, hidden reserves, and subordinated and other long-term debt. There are, however, two potential problems when using (changing levels of) Tier 1 capital to assess the impact of the financial crisis. The first potential problem is an empirical problem. The way in which Tier 1 is calculated may differ as each of the national banking regulators has some discretion over how to count differing financial instruments in a capital calculation. For instance, depending on the legal framework, Tier 1 capital may also include (parts of) a bank's goodwill', an intangible asset that reflects the difference between the market value and selling price of a bank. In the pre-crisis era, goodwill was commonly deducted from Tier 1 as it does not have much (if any) liquidation value and cannot be sold by itself. In the course of the financial crisis, however, a number of regulators changed accounting rules so that (some of) the goodwill could count toward Tier 1 capital, thus helping banks toward meeting their regulatory capital requirements. As a consequence, Tier 1 calculations are open to some degree of political manipulation. To circumvent this and other possible multiplicities, The Banker uses a singular characterization of Tier 1 capital and other indicators of a bank's financial prowess such as assets, pre-tax profits, and profit-on-capital ratio4. The second potential problem is a conceptual one, and is related to the fact that Tier 1 capital is neither an unambiguous measure of size' nor are its changing levels unambiguously related to the crisis. Although the selection of the Top 1000' banks was based on their level of Tier 1 capital, it is quite difficult to simply equate this indicator with size' per se. In reality, big banks' have large assets, encompassing different markets and connecting different economies. Bank of America, for instance, ranked 1st in the 2007 edition of The Banker in terms of Tier 1 capital, is ranked only 10th in terms of asset size. Furthermore, as a dynamic solvability measure, changing levels of Tier 1 are ambiguously related to the crisis: declining solvability, for instance, can be both a sign of a bank's weakness (e.g. declining liquidity levels that ultimately resulted in solvability problems for RBS and Fortis after the ABN AMRO takeover) and of strength (e.g., the forced takeover of Merrill Lynch by Bank of America)5. However, at the city level these differences between Tier 1 capital and assets are not empirically that important: a simple ecological correlation between both measures results in a very high correlation (i.e above 0.9). Thus below we follow The Banker's lead and use Tier 1 capital for our comparisons. Our basic approach in this paper is to aggregate these key indicators at the level of individual cities for both datasets. Comparing these measures for 2007 and 2008 allows us to assess the heterogeneous impact of the 2008 financial crisis on IBCs beyond a simple review of spectacular but highly specific events such as bankruptcies and mergers & acquisitions. To make the different measurements comparable and exclude idiosyncratic results, a number of decisions regarding data handling needed to be made. First, we had to exclude a number of (predominantly small) banks from the analysis because they reported the same data for both years. Second, we systematically checked the headquarter locations in the dataset because some cities' referred to specific parts of major cities (e.g. Giza for Cairo and Midrand for Johannesburg) and/or some cities were listed under a different name (e.g. Mandaluyong City and Makati City for Manila). If and when appropriate, headquarter locations were relabeled to enforce a coherent geographical setting6. Third, indicators were aggregated at the city-level, after which we only retained cities that met at least one of two criteria: (i) cities with three or more headquarters in at least one of the datasets (thus including cities such as Reykjavik, which had three bank headquarters in the 2007 data but none in the 2008 data) and (ii) cities that rank in the top 25 in terms of Tier 1 capital in at least one of the datasets (thus including cities such as Edinburgh, which only houses two headquarters, albeit of very big banks). This resulted in a roster of 99 cities for further analysis. However, for reasons of clarity, our discussion will focus on those 52 cities that represent at least 5% of the level of Tier 1 capital of the most dominant city in one of the datasets (Paris in 2007 and New York in 2008). In the next section, we outline the major findings of our analysis. Changing Geographies of IFCsTier 1 changes between 2007 and 2008Table 1 and Figure 1 summarize the major changes in the level of Tier 1 capital between 2007 and 2008. The table lists the 15 largest positive and negative changes, the figure maps Tier 1 change for each of the 52 cities. Table 1 Largest changes in Tier 1 level
Figure 1 Largest changes in Tier 1 level (The Banker 2008 and 2009)
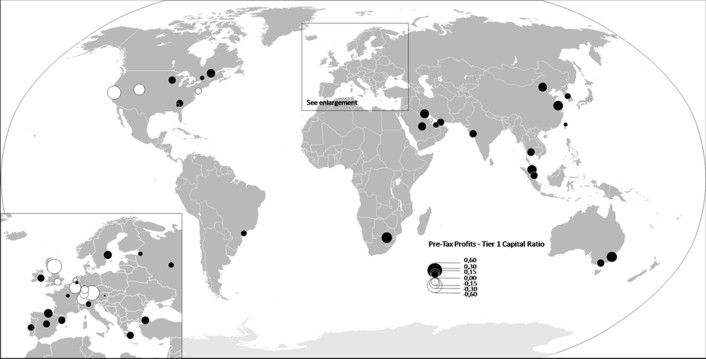
The largest positive changes can be found in San Francisco, New York, Singapore, Charlotte and Abu Dhabi respectively. The most notable negative changes, in turn, can be found in Reykjavik, Winston-Salem, Seoul, Munich and Manama. In some instances, these patterns of growth and decline are directly interrelated. The decline of Winston-Salem, for instance, can be attributed to the government-forced sale of Wachovia to avoid this bank's failure. Initially ranked 19th, the bank was purchased by San Francisco-headquartered Wells Fargo on 31 December 2008, so that the growth of San Francisco directly mirrors the decline of Winston-Salem. The near-doubling of Tier 1 capital in New York, in turn, is primarily due to the forced entry of New York-based investment banks in The Banker's list (in addition to the takeover of W ashington Mutual by Morgan Chase): after the bankruptcy of Lehman Brothers, erstwhile investment banks Goldman Sachs (ranked 13 in 2008) and Morgan Stanley (ranked 17 in 2008) were forced to become traditional bank holding companies from 22 September 2008 onwards. And finally, the rise of Charlotte can be traced back to the Merrill Lynch acquisition by Bank of America. Other notable patterns include the strong showing of Abu Dhabi and Singapore: all banks headquartered in both cities reported strong growth figures. Seoul banks, in contrast, uniformly posted bad figures, while Munich's position as an IBC has suffered immensely under the quasi-collapse of two of its largest banks (Bayerische Landesbank and Hypo Real Estate). Reykjavik, in turn, is no longer on the map of international finance after the collapse of all three of the city's major banks (Kaupthing, Landsbanki and Glitnir) following their difficulties in refinancing their short-term debt and a run on deposits in the United Kingdom. Taken together, the figure and the table clearly show that the most notable spatial pattern is the general decline of European cities: the only non-European cities recording a drop in Tier 1 capital are Winston-Salem, Seoul, Tokyo and Manama. Conversely, Athens is the only European city in the top 15 cities in terms of positive Tier 1 capital change. However, this Athens exception simply points to a delayed reaction to the financial crisis: the major Athens-headquartered banks (National Bank of Greece, Alpha Bank and Piraeus) managed to record healthy performance throughout 2008 because of strong credit demand in Greece. However, just before the end of the year (11 December 2008), Moody's Investors Service suddenly changed the outlook on these banks' financial strength ratings and long-term deposit and debt ratings to negative from stable. Thus Athens followed the path of other European cities shortly after the data gathering, and now finds itself in an even worse position as IBC. Most of the banks in the Middle Eastern centres have fared relatively well under the crisis with the exception of Manama. However, it can be noted that the city's smaller banks like most of their Middle Eastern counterparts - have actually had a good year in 2008, but their core capital gains are offset by the Tier 1 losses of Gulf International Bank. The latter bank is by far the largest Manama-based financial institution, and the forced sale of a significant portion of its noncore international securities portfolio was enough to let Manama's level of core capital take a nosedive. Pre-tax Profit Performance in 2008Although banks' profits and losses are volatile in time and space, aggregated levels of 2008 profits provide us with another and perhaps more forthright forecast of how the landscape of IBCs will be changing under the crisis. Table 2 and Figure 2 summarize aggregated pre-tax profits at the city-level. To properly contextualize these profits/losses, they are presented as relative measures to the level of Tier 1 capital contained within a city, thus generating a return on capital' ratio. The table lists the 15 centres with the highest levels of return on capital and the 13 cities that posted the largest average losses. Note that the map no longer features Reykjavik, as the city's banks have been wiped out in 2008. Table 2 Largest pre-tax profits/losses in 2008 (The Banker 2009)
Figure 2 Largest pre-tax profits/losses in 2008 (The Banker 2009)
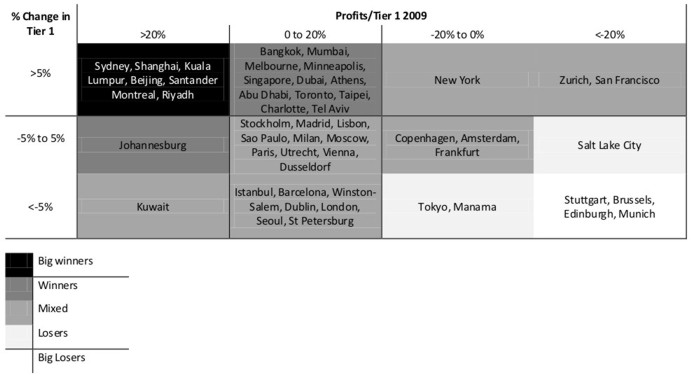
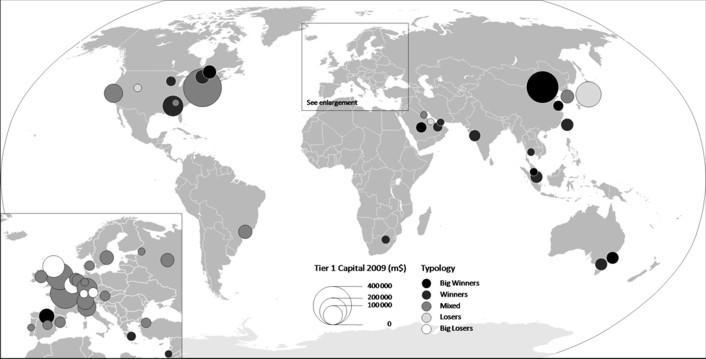
The five cities atop this ranking are Sydney, Johannesburg, Shanghai, Kuala Lumpur and Kuwait. With levels of return on capital of over 25%, the banks located in these cities have continued to perform at pre-crisis levels (or even better). The observation that for banks located in these cities 2008 has been pretty much business as usual' in terms of profitability is confirmed when looking at individual banks: it is remarkable how virtually all of the banks located in these cities post pre-tax profit levels that are in line with 2007 results. In other words: the large profits of banks that have their headquarters in these cities are not so much the result of one or two exceptional results, but rather the product of an overarching stability in the performance of key financial institutions in these cities. The five cities representing the largest losses (in addition to Reykjavik's demise) are Munich, Edinburgh, San Francisco, Zurich and Brussels. Munich's banks (especially Bayerische Landesbank and Hypo Real Estate) posted losses of almost 50% of their core capital, which confirms the city's decline as an IBC. In absolute terms, however, the worst losses were for Edinburgh and San Francisco-based banks, with Royal Bank of Scotland and Wells Fargo posting staggering 59.3 billion and 47.7 billion US$ losses respectively. If pre-tax profits are heralding fundamental changes in the geography of banking centres, then Figure 2 can indeed be read as a West to East' shift. Manama and Tokyo are the only cities posting (relatively small) net losses in 2008, as all other losses (and especially the larger ones) are associated with cities in Europe and the US. Notable exceptions are the losses posted by banks headquartered in Stockholm, Istanbul and especially Santander. Although Santander houses more than one headquarter of a top 1000 bank (i.e. Caja Cantabria), its position as an IBC is almost exclusively tied to the activities of Banco Santander (Spain's biggest bank, and in terms of market capitalization now also Europe's biggest bank). Banco Santander was the only partner that did not suffer from liquidity problems after the ABN AMRO takeover, in contrast to the Edinburgh-headquartered Royal Bank of Scotland and Brussels-headquartered Fortis which had to be bailed out by their respective states due to credit shortage. Banco Santander, however, secured the takeover of ABN AMRO-owned Brazilian bank Banco Real without running into liquidity problems, and in addition acquired Sovereign Bancorp (US), Alliance & Leicester (UK) and parts of savings bank Bradford & Bingley (UK). Typology of IBCs Under the CrisisOur overview of Tier changes between 2007 and 2008, and pre-tax profits in 2008, has shown that the IBC changes under the financial crisis are varied in geographical and substantive terms. Geographically, one can hardly speak of a large-scale West to East' shift given, for instance, the performance of Montreal/Toronto banks compared to Seoul/Manama banks. Furthermore, when comparing the figures and tables for both indicators and interpreting them in the light of the variegated meaning of changing Tier 1-levels (see above), it becomes clear that the impact of the crisis is also wide-ranging in terms of its effects. For instance, while the Wachovia-takeover by Wells Fargo boosts the Tier 1-level of San Francisco and marks the decline of Winston-Salem as a banking centre, it is obvious that it would be wrong to interpret 2008 as a good year' for San Francisco. On average, San Francisco banks posted losses that are over 20% of average Tier 1 levels, which implies that in spite of enormous Tier 1 growth the long term outlook of San Francisco as an IBC is perhaps less secure than before the crisis. Similarly, Kuwait-headquartered banks have managed to uphold their profitability during the crisis, but this does not entail a general rise of Kuwait as an IBC as the total level of core capital has lessened. In other words, a balanced appraisal of the impact of the financial crisis implies a combined appraisal of performance indicators. To this end, Table 3 presents a typology that combines both the results for Tier 1 change between 2007 and 2008 and pre-tax profits in 2008. We distinguish three levels of Tier 1 change (gain, stability, loss) and four levels of return on capital (large profits, small profits, small losses, large losses). The 20% threshold for pre-tax profitability is based on the Banker's (2009) assessment that in pre-crisis years return on capital was on average close to this level. In Figure 3, this typology is combined with levels of Tier 1 capital in 2008 to create a summarizing geography of IBCs in the context of the crisis. Table 3 A typology of international banking centres in the context of the financial crisis
Figure 3 A typology of international banking centres in the context of the financial crisis
Taken together, the table and the figure reveal the complexity of the geography of IBC performance. There a number of obvious winners and losers: Sydney, Shanghai, Kuala Lumpur, Beijing, Santander, Montreal, Riyadh are clear-cut winners in that they combine pre-crisis levels of return on capital with Tier 1 growth. Moreover, it should be emphasized that in general in these instances capital growth has been less government-based than the results of the banks' own efforts to raise their capital (in contrast to the Tier 1 growth of most US and European-based banks). Unambiguous losers are the European centres of Edinburgh, Brussels, Stuttgart and Munich: in spite of capital injections by governments, capital levels have plummeted, while future recovery of these cities as IBCs is uncertain given the enormous losses. Most IBCs feature in the grey zone of centres that exhibit mixed results. For instance, cities such as New York, Stockholm, Frankfurt and Istanbul couple a relative stability in terms of Tier 1 capital with a relatively flat' year in terms of profitability. And finally, the remaining cities such as Bangkok/Johannesburg and Salt Lake City/Tokyo are relative winners/losers in that they combine a relatively good/bad performance on one the key indicators with a mediocre performance for the other indicator (e.g., Salt Lake City banks combining Tier 1 stability with large losses and Johannesburg banks combining Tier 1 stability with large profits). Concluding CommentsIn this paper, we have aimed to paint a more detailed picture of the impact of the financial crisis on IBCs. Based on an appraisal of a combination of different key indicators (change in core capital and return on capital), we have shown that the geographical impact of the crisis is not simply a matter of a shift from West to East'. Although most clear-cut winners are indeed located outside Northern America and Europe as suggested by Aalbers (2009), a number of Western centres such as Sydney and Santander are amongst the IBCs with the strongest performing banks in the unfolding crisis. Similarly, a number of Middle Eastern and Pacific Asian banks have gone against the overarching regional trend and have been dragged down by the crisis. Thus although Abu Dhabi, Riyadh and Dubai on the one hand and Beijing, Shanghai and Kuala Lumpur on the other hand managed to weather the storm because of the strong performance of banks headquartered in these cities in the period under investigation, one can also note the relative poor showing of Kuwait/Manama and Seoul/Tokyo. This systematic account of shifting IBC geographies obviously implies that other financial practices remain unassessed: our analysis has focused on just one element of what defines a financial centre. Furthermore, there are, as Engelen and Faulconbridge (2009), Lee et al. (2009), Aalbers (2009) and Klagge (2009) have recently highlighted, a large number of geographical puzzles associated with the credit crisis, and geographers are in principle well-positioned to provide nuanced accounts of the crisis (e.g., Hallsworth and Skinner 2008). With respect to this broader financial geography, we see three pertinent research agendas that may further inform the empirical analysis presented in this paper. First, the prominent role of governments raises a number of questions with respect to the role of the state in IBC-formation. The near-collapse of major Belgian banks Fortis and Dexia entailed intense discussions and negotiations between the Belgian and the Dutch governments on the one hand and the Belgian and the French governments on the other hand. On both occasions this quickly resulted in a break-up of the banks along national lines' and, therefore, a de facto rollback of their transnationalization. In other words, despite decades of European economic and financial integration, once the going gets tough a simplistic throwback to economic nationalism seems to be the only available response. As a consequence, some earlier tendencies in research on financial centres, whereby it was at least implicitly suggested that financial integration heralded the end of geography' may need a complete rethink. At the same time, the renewed role of states may well be exaggerated. With regulators pushing banks to increase capital, there has been feverish issuance activity in the capital markets, and this has often occurred through government capital injections. However, The Banker (2009) observes that even when government capital is removed from the calculations, the overall picture of rising and declining banks (and therefore IBCs) is not drastically altered as the banks own efforts to increase their capital were often sufficient to level most of the disruptions brought about by the financial crisis. In any case, future research on IBCs and financial centres will, once again, have to come to terms with the potentially revamped role of territorial states. Second, the financial crisis and its often disrupting effects on IBCs and financial centres provide the ideal background for research that tries to make sense of the patterns outlined in this paper. Faulconbridge (2004), for instance, has criticized earlier research on financial geographies because of its preoccupation with attribute properties (e.g. financial turnover, number of banks, etc.) (see also Faulconbridge et al. 2007; Engelen and Grote 2009). Obviously, our analysis has been based on the interpretation of such indicators, and this means that a lot more research needs to be done to make sense of the processes behind these patterns of growth and decline. This will only be possible if, as Faulconbridge (2004) explains in his treatise on the London/Frankfurt financial relations, one conceptualizes cities as part of a relational financial network. Key dimensions of shifting financial geographies such as the complementarity/competition between cities and the ability of key actors to influence the financial network from a distance need to be put centre stage if one wishes to develop a deeper understanding of shifting financial geographies (e.g. Beaverstock et al. 2001; Poon 2003). Third, the poor showing of Manama highlighted in this paper contradicts the strong performance of a number of its key financial institutions that largely operate beyond the remit of classical' finance (see Bassens et al. 2010). R ecent research on financial geographies has suggested that much more attention should be paid to this existence of other', non-mainstream' circuits of financial intermediation and accumulation (Pollard and Samers 2007). For instance, the double-digit growth of the Islamic financial sector' in the last few years has challenged the idea that the rise of financial centres in the Gulf region can simply be understood as the result of the dissemination of Western capitalist practices. Although some processes and events in this region may well lend themselves to such an interpretation, it denies the rather commonsensical observation that globalization, financialization and urbanization in this part of the world have been increasingly mediated through Islam. Although the Islamic financial sector has also suffered from credit shortage, Bassens et al. (2010) suggest that it has been affected less than mainstream financial institutions. It is quite possible that Manama's poor showing in our analysis may in part be the result of the fact that capital has been pouring into other' types of financial products that are not adequately reflected by The Banker's data. For one thing, the credit crisis emphasizes the relevance of research on financial geographies that have long stayed under the radar because of the disproportionate focus on traditional financial institutions and the financial centres in which they are located. This overview of research agendas implies that a number of key issues have not been addressed in this short empirical paper. Furthermore, the financial crisis is obviously not an event' that can be isolated in time and space, but rather it is part of an on-going bundle of processes that is economic globalization. This means that the patterns we have identified may be deepened, altered or perhaps even be reversed in the coming years. Although it is hard to predict which of these future scenarios will come to pass, we do know that we will not be able to assess such changes unless we have a good empirical understanding of the shifting financial and wider corporate landscape (Taylor et al. 2009 2010). REFERENCESAalbers M 2009 Geographies of the financial crisis Area 41 34-42 Arrighi G 1994 The long twentieth century: money, power, and the origins of our times Verso, London Bassens D, Derudder B and Witlox F 2010 Searching for the Mecca of finance: Islamic financial services and the world city network Area 42 35-46 Beaverstock JV, Hoyler M, Pain K and Taylor PJ 2001 London and Frankfurt as world cities: a relational study of contemporary urban change Anglo-German Foundation, London Choi S-R, Park D and Tschoegl AE 2003, Banks and the world's major banking centers, 2000 Review of World Economics (Weltwirtschaftliches Archiv) 139 550-68 Derudder B, Taylor P, Ni P, De Vos A, Hoyler M, Hanssens H, Bassens D, Huang J, Witlox F, Shen W and Yang X 2010 Pathways of change: shifting connectivities in the world city network, 2000-2008. Urban Studies 47 1861-77. Engelen E and Faulconbridge J 2009 Introduction: financial geographies the credit crisis as an opportunity to catch economic geography's next boat? Journal of Economic Geography 9 587-95 Engelen E and Grote MH 2009 Stock exchange virtualisation and the decline of second-tier financial centres the cases of Amsterdam and Frankfurt Journal of Economic Geography 9 679-96 Faulconbridge J 2004, London and Frankfurt in Europe's evolving financial centre network Area 36 235-44 Faulconbridge J, Engelen E, Hoyler M and Beaverstock J 2007, Analysing the changing landscape of European financial centres: the role of financial products and the case of Amsterdam Growth and Change 38 279-303 Frank AG 1998 ReORIENT: global economy in the Asian age University of California Press, Berkeley Hallsworth AG and Skinner F 2008 Visibly in trouble: Northern Rock, a post-mortem on a financial crisis Area 40 278-83 Klagge B 2009 Finanzmärkte, Unternehmensfinanzierung und die aktuelle Finanzkrise Zeitschrift für Wirtschaftsgeographie 53 1-13 Lee R, Clark GL, Pollard J and Leyshon A 2009 The remit of financial geography before and after the crisis Journal of Economic Geography 9 723-47 Pollard J and Samers M 2007 Islamic banking and finance: postcolonial political economy and the decentring of economic geography Transactions of the Institute of British Geographers 32 313-30 Poon JPH 2003 Hierarchical tendencies of capital markets among international financial centers Growth and Change 34 135-56 Taylor PJ, Ni P, Derudder B, Hoyler M, Huang J, Lu F, Pain K, Witlox F, Yang X, Bassens D and Shen W 2009 The way we were: command-and-control centres in the global space-economy on the eve of the 2008 geo-economic transition Environment and Planning A 41 7-12 Taylor PJ, Ni P, Derudder B, Hoyler M, Huang J and Witlox F eds 2010 Global urban analysis: a survey of cities in globalization Earthscan, London The Banker 2008 Top 1000 world banks http://www.thebanker.com/top1000.php Accessed 20 September 2009 The Banker 2009 Top 1000 world banks http://www.thebanker.com/top1000.php Accessed 20 September 2009 Tschoegl AE 2000 International banking centers, geography, and foreign banks Financial Markets, Institutions and Instruments 9 1-32 Von Peter G 2007 International banking centres: a network perspective BIS Quarterly Review December 33-45 NOTES* Ben Derudder, Department of Geography, Ghent University, Belgium, ben.derudder@ugent.be ** Michael Hoyler, Peter J. Taylor, Department of Geography, Loughborough University, UK; email: m.hoyler@lboro.ac.uk, p.j.taylor@lboro.ac.uk 1. As one of the reviewers pointed out, this is especially true for large multinational banks from small open trading economies like the Netherlands and Switzerland. 2. For an earlier analysis of major IBCs with data from The Banker, see for example Choi et al. (2003). 3. The data solely relate to a firm's banking activities. In the case of bancassurance groups, for instance, the data reflect the banking business only. 4. For Tier 1 capital, for instance, The Banker follows the guidelines put forward by the Bank for International Settlements (BIS). 5. Likewise, improving solvability can be a sign of strength but also of weakness if it is the result of state capital injections. 6. We have taken a very restrictive stance in this exercise: our goal was not to recast cities into city-regions but to rectify data errors. Thus many small cities in Switzerland, Germany and the US are still listed individually.
Note: This Research Bulletin has been published in Area, 43 (2), 173-182 |
|||||||||||||||||||||||||||||||||||||||||||||||||||||||||||||||||||||||||||||||||||||||||||||||||||||||||||||||||||||||||||||||||||||||||||||||||||||||||||||||||||||||||||||||||||||||||||||||||