GaWC Research Bulletin 291 |
|
|
|
This Research Bulletin has been published in European Urban and Regional Studies, 16 (4), (2009), 423-437. Please refer to the published version when quoting the paper.
INTRODUCTIONThis paper focuses on attempting to explain the factors that determine the spatial distribution of Europe’s Internet backbone networks. These backbone networks can be regarded as the infrastructural underpinning that enables the Internet to function, seamlessly and apparently place-lessly from the viewpoint of the user. According to Malecki (2004, p. 24):
One of the basic attributes of the Internet is that it interconnects numerous different and widely dispersed networks. This attribute, which is responsible for its global character, only occurs because of the existence of backbone networks. In reality, backbone networks are extensive interregional networks, built on fibre optic cables, which are interconnected at the main nodes of the Internet, where data peering between them takes place. So, it would not be an exaggeration to suggest that the study of the spatial allocation of the Internet’s backbone networks is synonymous with the study of the Internet’s spatial dimensions, at least as far as its infrastructural architecture is concerned. Backbone networks are not the only way to explore the Internet’s spatiality, but certainly can be regarded as one good approach1. Why might we expect the Internet’s backbone networks to be worthy of study from a geographical perspective? The answer is that such networks are “not a utopian public good available to everyone, whether core or periphery” (Gorman and Malecki, 2000, p. 132); on the contrary, they are usually owned by private firms, whose main objective is to maximize the returns on their investment. By accepting that these investments take place in the frame of a market economy which works reasonably efficiently, then it is clear that the decision on where to invest in backbone networks will be based on the suppliers’ perceptions of where demand will be highest, and, hence, rates of return greatest. What is uncertain yet is what are the factors that determine this demand, and this is what this paper is concerned with. The structure of this paper is as follows: the next part elaborates on the importance of studying the Internet and its backbone networks from a geographical point of view. Then, a review of recent empirical studies regarding the Internet’s spatial aspects is provided. The next part outlines the quantitative methodology that this study follows in order to explain the spatial distribution of backbone networks in Europe, the basic elements of which are principal components analysis and regression analysis. The results of the analysis are presented in the fifth section, and the paper finishes by presenting the main conclusions. The rationale of the studyThe authors’ motivation for choosing such a subject to study is the growing importance of Information and Communication Technologies (ICTs) in the economy. ICTs, which include the Internet and its backbone networks, seem to play a significant and growing role in the ‘new economy’ era, with processes of production, distribution and exchange increasingly reliant on them. What is more, their allocation generates impacts, differentiated at a spatial level. The infrastructural character of the Internet’s backbone networks is the feature that enables them to play a significant role in influencing potential income, productivity, and employment. The main characteristic of infrastructure in general is that it is part of the overall capital stock which is important for the subsistence of general purpose technologies (GPT) which are essential for the maintenance and growth of production (Biehl, 1991). There is no doubt that the Internet is a GPT (Malecki, 2002), with even its most standard applications, such as email, being integral to the production, distribution and exchange of goods and services (Batty, 1997). This infrastructural characteristic of the Internet is an essential element in some of the well known theoretical approaches concerning the information age. Thus the “cyberplace”, which is identified as “the impact of the infrastructure of cyberspace on the infrastructure of the traditional place”, can be found among the other typologies of place in Batty’s “virtual geography” (Batty, 1997, p. 340). In addition, the importance of the physical dimension of the Internet and of ICTs more generally is also recognized by Castells (1996) in his influential conception of the “space of flows”, the first layer of which is devoted to ICT infrastructure. These networks connect the nodes and the hubs of the space of flows, which are the actual nodes of the urban network, enabling this way the emergence of the global city. According to Castells (1996, 417):
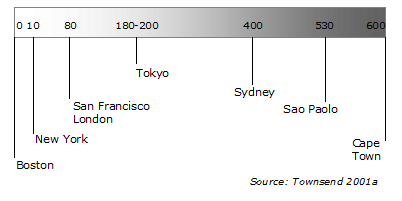
Global cities only exist because technology enabled interaction among the remote centres of production. The Internet and mainly its backbone networks carry a significant part of this interaction. Information, knowledge as well as the products of the knowledge economy are being distributed around the world’s settlements through what are known as digital highways, diminishing in this way the importance of traditional barriers such as national borders, but at the same time highlighting the locational advantage of being part of those networks. In other words, the valuable goods of the modern economy are being transported over the Internet in much the same way as transport networks have carried industrial goods over the last 200 years (O'Kelly and Grubesic, 2002). In addition to approaching the Internet as infrastructure, there is a growing discussion about the implications of the Internet for the broader geography of activities and especially for the centralization or decentralization impacts on spatial structure that the Internet may generate. The Internet appears to promote a ‘double edged effect’, that is of simultaneously stimulating both centrifugal and centripetal forces. If we take the example of rural areas, the former can be identified as the benefits that people in rural areas gain from investments in ICTs, such as the access to cheaper and better quality services, the diffusion of knowledge etc. The centripetal forces have the same source; investments in ICTs in rural areas make local markets more accessible to larger, external businesses (Gorman and Malecki, 2000), thereby increasing competition. This may result in diminishing local production because small businesses are unable to compete with larger ones (Richardson and Gillespie, 2000). So, not only do ICTs “not automatically result in the decentralization of economic activity” (Richardson and Gillespie, 2000, p. 201) but they can and do have both centralizing and decentralizing effects, contrary to the early ‘death of distance’ conceptualisations of their impacts, which saw only their decentralizing potential (Malecki and Gorman, 2001). Without compensating public policy actions, ICTs may result in increasing the gap between urban (core) and rural (peripheral) areas (Richardson and Gillespie, 2000). Furthermore, ICTs in general and the Internet backbone networks in particular tend to concentrate in the major agglomerations. Although they have managed to remove some of the geographical barriers that remote locations face, this evolution has not weakened people’s and economic activities’ tendency to cluster in urban areas (Moss and Townsend, 2000). On the contrary, population and economic activities tend more and more to agglomerate in core metropolitan regions, leading Malecki (2002, p. 419) to conclude that “world cities are alive and well”. In addition, access to ICTs is a driving force, among others, for urban development. Urban and metropolitan authorities consider ICT infrastructures, including Internet backbone networks and POPs, significant for the creation of comparative advantage (Hepworth, 1989). Indeed, according to the results of a survey in 500 European companies, telecommunications’ quality is the fourth most important factor for location decisions (Cushman&WakefieldHealey&Baker, 2004). At this point, it is worth underlining some technical details concerning the implications of Internet backbone geographies. It is commonly believed that every city which is connected to a backbone network will be equally accessible as any other city on the network because data travels at the speed of the light over fiber-optic networks. However, this is not the case because there is considerable congestion at networks hubs which can diminish data speed (Moss and Townsend, 2000). Although a delay of a few milliseconds in network performance and accessibility (Figure 1) will not be observed by end-users, the aggregate impact of these milliseconds can differentiate the network efficiency and accessibility of a city, leading to the loss of some of the city’s comparative advantage (O'Kelly and Grubesic, 2002). So, the study of the Internet’s geography it is also useful for approaching cities’ comparative advantage in the frame of today’s economy. Finally, an additional rationale for undertaking this study is to contribute to the broader field of world cities research. Peter Taylor (2004) refers to an ‘evidential crisis’ in the burgeoning field of world cities research, by which he means the gap between the theoretical sophistication in the work of Sassen (2000) and Castells (1996) and others and the dearth of empirical evidence to back up their claims concerning emerging networks of flows. In particular, Taylor highlights the surprisingly limited use of relational data in the key studies in the field, given that it is precisely relations between cities that constitute the key to understanding the new world city networks that analysts contend are emerging. In recent years, attempts to tackle this evidential crisis have been advanced, including the work of Taylor and others in the Globalisation and World Cities (GaWC) network (see Taylor, 2004, for an account of this work), in which inter-locking networks of advanced producer service firms constitute the relational data. Other approaches to getting at the relations between cities have concentrated on airline networks (e.g. Derudder and Witlox, 2005), and on emerging geographies of advanced telecommunications networks and the Internet, which we review in the section below and to which our study contributes. Figure 1: Internet transmission speed timeline from Boston to major international destinations in milliseconds (late ‘90s)
Empirical research regarding backbone networks’ spatial distributionThis section critically reviews some empirical studies concerning the spatial distribution of the Internet’s vital components, such as its backbone networks and peering points. The Internet, and the backbone networks which underpin it, is actually an “urban technology” (Rutherford et al., 2004, p. 1), in as much as it is located primarily in cities, where demand is concentrated (Gorman and Malecki, 2000). Moss and Townsend (2000, p. 38) illustrate the Internet backbone networks’ spatial pattern among urban areas:
At a world level, the dominance of American cities in the development of the Internet is well documented, and is reflected in their huge agglomeration of backbone networks and peering points (Townsend, 2001a; Gorman and Malecki, 2000). It seems that historical evidence is more than useful in understanding these dynamics. As with agglomeration economies, which are influenced by an initial and maybe accidental allocation of resources, it seems that backbone networks’ current spatial allocation reflects in part the legacy of being part of the early Internet (Malecki and Gorman, 2001; Moss and Townsend, 2000). At a more specific level, empirical studies have concluded that a moderate positive relationship exists between Internet accessibility2 and city size (Wheeler and O'Kelly, 1999; O'Kelly and Grubesic, 2002). Population is not the exclusive factor for the distribution of the Internet’s infrastructure (which determines Internet accessibility) among cities. Other factors influence its allocation as well. If, in traditional economic geography, agglomeration economies are usually represented by population or employment, in e-economic geography agglomerative forces pull the allocation of ICT infrastructures to centres of information-intensive services and to locations “with high levels of local knowledge” (Malecki, 2004, p. 36). Table 1 presents an overview of some empirical research conducted for the period 1997-2003. The majority of the studies focus on the US Internet, whilst Europe does not seem to feature much. This dualism is not accidental, given that the Internet begun in the USA and is more developed there than in Europe. Additionally, it is easier to find data for the US Internet than for the rest of the world. Table 1: Internet quantitative studies review
The third column of Table 1 presents the network component which is the object of the study concerned. Almost all studies focus on the networks’ fiber-optics links and not on their peering points (Grubesic and O'Kelly, 2002), underplaying effectively the importance of the Internet’s nodes. The importance of backbone networks from the geographical point of view is illustrated by the fourth column of the table, which categorizes the spatial units studied. Most studies focus on cities and not on the networks themselves. The main findings of this review can be found in the fifth column, where the basic indicators of each study are described. Most of the studies reviewed are based on the number of total connections (connectivity) that a city (or a backbone network) shares with the rest of the world, or the total bandwidth capacity that a city (or a backbone network) enjoys. These two indicators are significant in underlining the competitive advantage among cities and shaping a new form of urban hierarchy, just like other more conventional indicators such as population. What these indicators cannot do is to examine the one to one relations between the cities and the ISPs (Internet Service Provider)3. This concerns the interconnectivity of ISPs, which is vital for their efficiency. But the most important from the geography point of view is the former, which seems to be related with the urban system. The total number of connections (or the bandwidth) between any two cities may reflect the data that these two cities can potentially interchange and in some way the volume of the economic and social interactions that may take place between these two cities. By assuming that the market economy works efficiently, supply meets demand and consumers (users in this case) act rationally, then from the supply side, ISPs would invest to install as much bandwidth as needed in order to meet the demand for this infrastructure and from the demand side, users would pay to use as much bandwidth as they would really need. So all the installed bandwidth would be used and as long as the data interchange reflects to some degree the interaction between two cities, then the installed bandwidth would indicate the interaction between these two cities. But in fact, most installed bandwidth is unused. For example, in 2004 it was lit only 3% of the total bandwidth capacity in Frankfurt (Rutherford, forthcoming) and by the end of 2006 only 14% of the total capacity of major submarine cables (Roberts 2006). But before rejecting the previous argumentation as a market failure, the special characteristics of this infrastructure should be considered. What really costs in backbone networks is digging trenches in order to install ducts, rather then laying fiber once the ducts are installed. So, unlike the case for transport infrastructure, what really costs is the network’s first installation and not its expansion in terms of extra fiber and bandwidth. Therefore, and according to the neoclassical rationale, it could be said that the volume of unlit ‘dark fiber’ and the ISPs’ philosophy of “build it and they will come” (Malecki, 2004, p. 23) indicates the expectations about the future demand for this infrastructure and consequently the potential interaction between the two cities. However, it has to be underlined here that apart from the direct links between two cities, data can be transferred between them through indirect routes via other nodes (cities). This may not cause problems to an individual user but will result in lower total interconnectivity for the city and in lower capacity for interaction between cities, affecting users such as large firms. The methods used in the studies reviewed are presented in the seventh column of Table 1. The most preferred methods of quantitative analysis are descriptive analysis, network analysis, and correlations. The former refers to simple descriptive analysis of bandwidth volumes and connection levels, resulting in rankings of cities with the highest levels of bandwidth or the greatest number of connections. The second refers to techniques introduced by Taaffe et al. (1996) for the study of transport networks that have been used to examine the Internet’s topological structure. Finally, correlations between bandwidth or connectivity measures and various socio-economic indicators have been used in order to explain the spatial distribution of the Internet’s infrastructure. To sum up the results of this review of the methods of analysis used, it can be concluded that much effort has been expended in order to apply network analysis methods, which were initially developed for transport purposes, to backbone networks in the USA, indicating in this way a new urban hierarchy based on fiber backbone networks. In contrast, only a few studies have tried to explain the factors that shape the spatial allocation of such networks. What is more, little effort has been expended in studying the Internet’s geography in Europe4. Of course, the Internet has a longer history in North America but recent developments in Europe have increased the need for investigating this region’s spatial allocation of backbone networks. This paper attempts to address the relative lacunae in existing research on the Internet’s geography in two ways; firstly by focusing on the analysis of Internet backbone networks specifically in Europe; and secondly in concentrating on attempting to identify the factors that shape the Internet’s geography, rather than in analyzing its topological characteristics. Methodological approachThe approach of this study is then to identify, through the use of statistical methods, the factors that influence the likelihood of European cities being connected to the Internet’s backbone networks. In fact three measures of connectivity were used (described in more detail below); firstly whether is a city is connected or not to one or more backbone networks; secondly the level of connectivity of those cities that are connected to at least one Internet backbone; and thirdly the number of different backbone networks that a city is connected to. The first step was to construct a data-base of socio-economic variables that we hypothesised as being likely to exert an influence on the geography of the Internet’s backbone across Europe’s urban system. A data set of 37 socio-economic variables for EU25 NUTS3 and 27 variables for NUTS2 regions was established (the choice of NUTS2 and NUTS3 regions is explained below). A description of these variables, the data sources and the time reference can be found in the Appendix. What should be noted here is that the main modelling strategy was to collect as many socio-economic variables as possible, for which there are reasons derived from theory that they will help explain the Internet’s geography. The selected variables can be grouped into the following thematic areas:
The analysis was conducted for the EU25, rather than for the whole of Europe, as regional data-sets for non-EU countries usually have many gaps. Although the previous discussion would imply that data at the level of urban areas would be most appropriate, given that our concern is with infrastructures connecting urban centres, the lack of comparable socio-economic data for European urban areas led to the NUTS36 and NUTS2 regional levels being chosen instead. Comparability requirements also resulted in effort being expended to select variables relating to the year 2001, or as near to that year as possible7. Turning now from the data sets to the methods for analysing them, the exploratory analysis undertaken was based on statistical modelling techniques and more specifically on different regression analysis methods. Instead of using the whole set of the independent variables collected as the regressors in the modelling procedure, an alternative method was selected in order to avoid multicollinearity problems, which would have occurred if all the exploratory variables were included in the regression models. Principal Components Regression (PCR) is a combination of two different methods, Principal Components Analysis (PCA) and Regression Analysis and it is known in the relevant literature as one of the few methods in order to surpass multicollinearity problems (Massy 1965, Mardia et al 1979, Afifi and Clark 1996, Liu et al 2003, Fekedulegn et al 2002, Filzmoser and Croux 2002, Basilevsky 1994, Abdul-Wahab et al 2005). In more details, PCR is a two step method. First a set of principal components is calculated using ordinary PCA. These components are linear combinations of the original independent variables. In addition, because of the orthogonal transformation that takes place during the PCA process, the components are uncorrelated and consequently no multicollinearity problems appear in the subsequent regression analysis. Then a selected number of the principal components replace the original independent variables as the new regressors (Filzmoser and Croux 2002, Fekedulegn et al 2002). The main objective of the components’ selection process is to eliminate the non-significant principal components and it is based on stepwise regression procedure (Fekedulegn et al 2002, Abdul-Wahab et al 2005, Filzmoser and Croux 2002, Liu et al 2003). At the end, the regression analysis is carried out and the regression coefficients for the reduced set of orthogonal components are calculated. The latter can be mathematically transformed using the linear relations between the initial independent variables and the orthogonal components, resulting in this way to a final equation with the original independent variables. However, as Mardia et al (1979, 244) highlighted “[i]f the principal components have a natural intuitive meaning, it is perhaps best to leave the regression equation expressed in terms of the components”. Three explanatory statistical models were produced. The first is based on logistic regression and tries to explain the likelihood of a NUTS3 region being connected with at least one backbone network. The dependent variable for this model, which is based on KMI Research Group Maps8 (2001), is a binary variable indicating whether a region is part of at least one backbone network or not. The data for this variable was initially provided for cities and was then converted into a NUTS3 regional level measure across the whole of the EU25. The independent variables for this logistic regression model are the principal components produced from the PCA, which was applied to the socio-economic variables data set of the 1206 NUTS3 EU25 regions. The second model is also at NUTS3 level, but it is focused only on the interconnected regions (i.e. those with at least one backbone network node within them) and tries to explain the socio-economic factors that affect a region’s level of connectivity, using a multiple linear regression model. The dependent variable is the number of redundant connections that a region shares with the rest of Europe. For example, Hamburg region shares 894 redundant9 links with 200 cities, which are located in 175 NUTS3 regions, while Naples is connected with 5 cities, which are located in 5 regions. As before, this variable is based on KMI Research Group Maps (2001) and was originally provided at the urban level. So, a summarization took place at NUTS3 level, excluding the intra-region connections. The independent variables are the result of the PCA which was applied to the socio-economic data set for the 184 interconnected NUTS3 regions. The third model tries to explain the number of different Internet backbone providers present in each region, which can be regarded as another expression of regional connectivity, using again multiple linear regression, but this time at the NUTS2 level. The shift from NUTS3 to the larger NUTS2 regions took place in order to use variables related to the knowledge economy, which are not available at NUTS3 level. As before, the independent variables are the components that resulted from PCA applied to the socio-economic dataset for the 139 interconnected NUTS2 regions. The dependent variable is the number of different ISPs with at least one network node in each region, which again is based on KMI Research Group Maps (KMI Research Group, 2001). ResultsThe results of the models described above are presented here. Model I is the logistic regression model. The first step was the exclusion of highly correlated variables (Pearson > 0.9 or <-0.9). After some additional tests, some more variables were excluded because of multicollinearity problems, resulting in a final set of 27 variables. PCA was carried out on these variables for the 1206 NUTS3 regions, resulting in six principal components being identified, which together explained 67.5% of the total variance and fulfilled all the proposed tests for the validity of this type of analysis (Field, 2000). A rotation of the six principal components then took place in order to distribute better the initial variables across the components. The method used for the latter was the varimax, an orthogonal rotation method and the most widely used. This procedure resulted in the components loadings presented in Table 2, which help us interpret the principal components, since they represent the correlation between the initial variables and the components. The first component is associated with urban regions with levels market accessibility. It is most highly correlated with regions with above levels of population density, with regions classified as urban, with regions with high levels of potential accessibility by air and by rail, and, to a lesser extent, regions located in the European ‘pentagon’. The second component we have labelled as Europe’s prosperous core, as identifies prosperous, developed regions in the territorial heartlands of northern Europe. It is positively associated with non-objective 1 and non-lagging regions and with regions located in Europe’s pentagon, GDP per capita, and with population growth in the 1995-2003 period. The third component identifies the major urban centres and transport hubs, which are characterized by high levels of total population, by high levels of endowment in transport infrastructure (railways, roads, large airports), and by high levels of total service sector GVA. The fourth component identifies the most urbanised regions, with are characterised by the highest population densities and by the largest percentage of artificial surface, as well as by high levels of GDP per capita and high levels of total service sector GVA. The fifth component identifies mainly inland regions, since it is negatively correlated with the number of seaports and the number of airports (which in abundance usually characterise insular regions), and positively correlated with non-coastal regions and with potential accessibility by rail. The sixth and final component identifies service-dominated regions, which are characterized by a share in the service sector. Table 2: Model I, logistic regression model for NUTS3 region
The next step was to feed a logistic regression model, based on the Backward Stepwise method, with the above principal components. After three steps, the model selected the following four components as contributing most to predicting the likelihood of a region being connected to a backbone network; the major urban centres and transport hubs (Component 3) and the most urbanised regions (Component 4) were the most important, followed at some distance in importance by the inland regions (Component 5), though this was negatively associated with being connected to an Internet backbone, and the service-dominated regions (Component 6). Because there is no R² for the Logistic Regression, the Nagelkerke R² is used in order to test the model’s goodness of fit. For this case it is 0.364, a value that could be regarded as acceptable for logistic regression models. Table 3 presents the components that were finally entered in the logistic regression, and their main statistics. The residuals of the regression model do not cause any concern, since the only outliers (studentized residuals greater than 3) are the regions of West Inner London in UK and Hauts de Seine in France. The odds in both cases are overestimated because neither of these regions have an Internet backbone node within them but they both share many socio-economic characteristics with the highly interconnected neighbouring metropolitan regions of London and Paris (and from which they are likely to derive access to the Internet backbone though Metropolitan Area Networks). Table 3: Model I
So, the likelihood of a region being interconnected with at least one backbone network are greater if it is a major urban centre and transport hub; if it is a highly urbanised region with high per capita GDP and a high level of service sector GVA, and if its employment is service-dominated. This confirms of course the expectation that being connected to an Internet backbone is primarily a metropolitan phenomenon; a region’s degree of metropolitan-ness is a more powerful predictor of whether it will be connected to a backbone network than is its location with respect to the geographical core of Europe or its level of wealth per se. In addition, and less expectedly, it seems that the location of a region on Europe’s coast, increases that region’s likelihood of being connected to backbone network. This phenomenon emerges both in the well developed countries in terms of ICTs, which also happen to be primarily coastal, such as Denmark, Finland and the UK, but also in the “gateway cities for high-bandwidth backbone connections” (Rutherford et al., 2004, p. 19), whose connectivity may take place because they act as gateways for the backbone networks’ onward connections. The latter refers to cities such as Bari in Italy, which is the gateway city for the Greek submarine broadband connection, or the French west coast, which connects UK with continental Europe. In addition, coastal regions’ connectivity in terms of Internet infrastructures probably also mirrors their transport connectivity, in that the roll-out of backbone networks follows the previous layers of network infrastructure (which tend to run along low-lying coasts rather than inland, across mountains) simply because it is easier to install fibre cables next to or underneath an existing road or rail network rather than building a new network from scratch (see for example Rutherford, 2005). The second of our three models attempts to explain the factors that determine not the presence or absence of a backbone connection amongst all of Europe’s 1206 NUTS 3 regions, but rather the degree of inter-connectedness of the (considerably fewer) regions with at least one backbone connection. The measure of inter-connectedness used is the number of redundant backbone connections that interconnected NUTS3 regions share with all the other interconnected ones. It refers thus to the 184 interconnected NUTS3 regions, and is based on linear regression, rather than the logistical regression of the first model. Following the same methodology as the previous model, after the correlation tests, the 27 non-correlated variables were entered in a PCA model, which resulted in 7 principal components, which together explain 74% of the total variance (Table 4). It should be highlighted here that although the set of independent variables for this model is the same as for the previous one, the PCA results are different because the number of regions included in this model is much smaller compared with model I (i.e. 1206 NUTS3 in model 1 and only 184 in model II). The first component identifies urbanized and accessible regions, with the highest correlations being with the binary variables representing above average shares of artificial surfaces, above average population densities and regions typologised as densely populated city core regions. Relatively high correlations are also found for potential accessibility by air and by rail, and for daily market accessibility by car. The second component identifies Europe’s largest metropolitan regions, with the highest correlations being with measures of metropolitan scale; the size of total service sector GVA, population size and with the amount of traffic in commercial airports (measured in millions of passengers per year). Relatively high correlations are also found with potential accessibility by air, a typology identifying central or very central regions in multimodal accessibility terms, and with population density. The third component identifies Europe’s small urbanized tertiary centres. Positive correlations are found with population density, the share of employment in the service sector and the percentage of artificial surfaces, while negative correlations are found with population size and the length of road and rail networks (probably acting here as surrogates for the geographical scale of the region). The fourth component identifies Europe’s inland accessible regions. It is positively correlated with non-coastal regions and with potential accessibility by rail and daily market accessibility by car, but it is negatively correlated with the number of seaports and airports. The fifth component identifies Europe’s dynamic, prosperous regions, since it refers to regions which are non-lagging regions and non-objective 1, with high levels of per capita GDP, high levels of GVA per employee in services, and experiencing population growth. The sixth component identifies established tertiary centres, which are characterized by high levels of GVA per employee in services and a high percentage accounted for by service activities, as well as a relatively high potential accessibility by rail, but which are negatively correlated with GDP growth and with the share of employment in secondary sector industries. The seventh and final component identifies border regions, which are characterised by border locations within countries. Table 4: Model II, linear regression model for NUTS3 regions
The components were entered into a stepwise linear regression model, which achieved an R² of 55%. Beta values and the main statistics for this model can be found in Table 5. Regarding the regression’s residuals, they do not create any concern. Only the region of Roma has a residual greater than 3 standard deviations, indicating an overestimation of the region’s connectivity. According to the results of the model, the regional characteristic that most positively influences Internet backbone connectivity is metropolitan scale (Component 2), followed by established tertiary centres (Component 6), inland accessible regions (Component 4), urbanised and accessible regions (Component 1), and dynamic prosperous regions (Component 5). Given the explanatory dominance of Component 2 in the overall model, we can then confirm the importance of metropolitan scale to explaining the likelihood of a connected region having a high degree of connectivity with other connected regions. Interestingly, although the first model suggested that the likelihood of a region being connected with at least one backbone network is increased if it is located on the coast of Europe, when the focus is on the levels of connectivity of the (many fewer) inter-connected regions, as it is in this model, we find that higher connectivity is associated with inland regions. Perhaps unsurprisingly given the scale of the European landmass and the complex history of its settlement and development, the most inter-connected urban regions are not, primarily, located around its coastal periphery.
As with the previous cases, for the 22 non-correlated variables PCA was applied. This resulted in 5 principal components being identified (Table 6), which explain 73% of the total variance. The first component identifies knowledge-intensive service regions, being strongly positively related to the percentage of employment in knowledge intensive services (and specifically in market services, financial services and high-tech services), the share of employment in service industries, performance with respect to the Lisbon Agenda, the level of human resources in science and technology, GDP per capita, and, albeit much less strongly, accessibility. The second component identifies major corporate and service hubs, being positively related to the scale of service sector GVA, the level of population in total and the highly educated population, the number of headquarters from the top 1500 companies that can be found in the region, and the volume of traffic to the region’s airports. The third component identifies Europe’s inland core regions, as it is negatively correlated with the number of seaports and airports and positively correlated with inland regions, a general accessibility classification and with location in Europe’s pentagon. The fourth component identifies large transport-rich regions (in terms of the length of road and railway networks within them) while the fifth and final component is slightly correlated with regions with high employment rates. Table 6: Model III, linear regression model for NUTS2 regions
After entering the above components in a stepwise linear regression model, three components were identified that determine the number of Internet backbone providers present in a region, with a goodness of fit of 57%. B values and the regression’s main statistics are illustrated in Table 7. The results demonstrate that the number of Internet backbone providers is positively associated with knowledge-intensive service regions (Component 1), with the major corporate and service hubs (Component 2), and with locations in Europe’s inland core (Component 3). Regarding the regression’s residuals, no concerns emerge since the only outliers are the regions of Hamburg and Île de France. The number of Internet backbone providers for the former is underestimated, since this region is the most well-connected one. On the contrary, Paris’ connectivity seems to be overestimated by the model; despite its importance in the European urban hierarchy, it is not the most interconnected region in Europe in terms of the number of Internet backbone providers. The results from the third model confirm the importance of the knowledge economy in shaping the Internet’s geography. The regions in Europe with the highest number of Internet backbone providers are those with the highest incidence of knowledge-intensive services (particularly of market services, financial services and high-tech services), with the highest level of human resources in science and technology, with the highest levels of service sector GVA and with the highest number of corporate headquarters. Table 7: Model III
CONCLUSIONSThis study has attempted to shed some light on the factors that determine the spatial allocation of the Internet’s backbone networks in Europe. Such backbone networks form the infrastructural underpinning of the modern knowledge economy, and we can expect that the geography of the knowledge economy in Europe both shapes, and to an extent is shaped by, the spatial allocation of backbone networks. In a Europe in which the Internet can be accessed over a variety of widely deployed network technologies, including DSL over copper telephone lines, cable TV networks, Wi-Fi networks and 3G mobile phones, the Internet appears to be ‘everywhere’, to be ubiquitously available. When we start examining the places at which the Internet’s usage is aggregated into nodal points and funnelled through fibre-optic cables, it becomes clear, however, that the Internet has a distinctive geography, that it is not thinly spread and ubiquitous, but rather highly aggregated and geographically-differentiated. It is this aggregation and differentiation that it is revealed by the Internet’s backbone infrastructure; thus of the 1206 NUTS3 regions in our analysis, less than one-in-seven have an Internet backbone node within them, and of the relatively small proportion that do have a node within them, their level of connectivity with other regions and the number of providers operating with them are further highly differentiated. Using the results of the analyses presented above, how are we then to explain the distinctive geography of Internet backbone network provision in Europe? Table 8 summarizes the principal components which proved to be significant regressors for our three measures of backbone connectivity, For our first model, it was the major urban centres and transport hubs that emerged as having the highest likelihood of being connected to an Internet backbone, while for those NUTS3 regions that were connected (model 2), the highest levels of connectivity were associated with Europe’s largest metropolitan regions. In our third model, in which the spatial scale changed to NUTS2 regions, it was the knowledge-intensive regions which emerged as having the highest number of backbone network providers. In section 4 above, a number of types of socio-economic variables were advanced as influences upon the location of backbone networks; these were grouped into levels of development; services and the knowledge economy; spatial structure; and physical transport and accessibility. In each of our three models, all of these types of socio-economic variable emerged as having some explanatory power. Or, to put it another way, there are no mono—causal explanations for the Internet’s backbone geography. The level of development has some purchase in all three models, though it tended to be measures of the scale of development – such as the absolute size of population or GDP – that were more significant than relative measures of wealth or prosperity in influencing the Internet’s backbone geography. The variables relating to services and the knowledge economy were of considerable explanatory importance, particularly in models 2 and 3 which concerned levels of connectivity, rather than connectivity as opposed to non-connectivity. Thus in model 2, measures of the service economy such as the share of employment in services and service sector productivity had explanatory power, while in model 3, in which a wider variety of knowledge economy measures could be included (because of being at NUTS2 level), the knowledge-intensity of employment, the incidence of higher level skills and the presence of corporate headquarters emerged as overwhelmingly important predictors of the number of Internet backbone providers. Spatial structure also emerged as a prime predictor of the Internet’s geography, particularly in the sense of levels of urbanisation and population densities. Thus being connected to the Internet’s backbone is an overwhelmingly urban region phenomenon, while the levels of connectivity of regions which are connected is clearly related to their degree of ‘metropolitan-ness’. Another, less expected, spatial variable which emerged as having relevance to understanding the Internet backbone’s geography was location with respect to Europe’s coastline; being connected to an Internet backbone was positively associated with coastal locations, whereas high degrees of connectivity in the relatively small number of connected regions was, on the contrary associated with inland, more centrally located regions. Finally, physical transport and accessibility also play a role in influencing the geography of the Internet; generally speaking, the backbone networks of the Internet tend to locate in regions which are already well provided with transport infrastructure and which have airports with substantial volumes of passenger traffic. While it is clear that all four of these groups of variables have explanatory power in helping us to understand the geography of Internet backbone provision, it can be concluded that the factors with the greatest explanatory purchase are urban size, metropolitan status and knowledge-intensity. Although there is no simple or single explanation of the backbone geography in EU25, we can conclude that it is, nevertheless, both familiar and predictable, since it is reflects largely the existing spatial, development and knowledge economy structures of metropolitan Europe. The Internet and its backbone networks seem not challenge existing paths but rather to bolster the present metropolitan core areas of Europe. Table 8: Principal components, which were included in the three regression models
ACKNOWLEDGEMENTSThe authors would like to thank Prof. Edward Malecki for reading and commenting an earlier version of this paper as well as the two unknown referees for their valuable comments. In addition, the first author would like to thank the Greek Foundation Scholarship for sponsoring his PhD research. REFERENCESAbdul-Wahaba S. A., Bakheitb C. S. And Al-Alawi S. M. (2005) Principal component and multiple regression analysis in modeling of ground-level ozone and factors affecting its concentrations, Environmental Modelling & Software 20, 1263–71. Afifi A. A. And Clark V. (1996) Computer-aided multivariate analysis. Chapman & Hall, London. Basilevsky A. (1994) Statistical factor analysis and related methods. John Willey & Sons, INC, Winnipeg, Manitoba. Batty, M. (1997) 'Virtual Geography', Futures, 29, 337-352. Biehl, D. (1991) 'The role of infrastructure in regional development', IN Vickerman, R. W. (Ed.) Infrastructure and Regional Development. London, Pion Limited. Castells, M. (1996) The Rise of the Network Society, Oxford, Blackwell. Cushman&Wakefieldhealey&Baker (2004) European Cities Monitor. Derruder, B. and Witlox, F. (2005) ‘An appraisal of the use of airline data in assessments of the world city network’, Urban Studies, 42, Dodge, M. and Shiode, N. (2000) 'Where on Earth is the Internet? An empirical investigation of the geography of Internet real estate', IN Wheeler, J. O., Aoyama, Y. & Warf, B. (Eds.) Cities in the Telecommunications Age: The Fracturing of Geographies. New York, Routledge. Espon (2004) Project 1.2.1. Transport services and networks: territorial trends and basic supply of infrastructure for territorial cohesion. Luxemburg. Espon (2005a) Potentials for polycentric development in Europe. Luxemburg. Espon (2005b) Project 1.2.2. Telecommunication Services and Networks: Territorial Trends and Basic Supply of Infrastructure for Territorial Cohesion. Luxemburg. Eurostat (2006) 'Regional Data', (http://epp.eurostat.cec.eu.int/portal/, 13/12/2006). Fekedulegn B. D., Colbert J. J., R.R. Hicks J. And Schuckers M. E. (2002) Coping with Multicollinearity: An Example on Application of Principal Components Regression in Dendroecology, United States Department of Agriculture, Forest Service, Northeastern Research Station, Research Paper NE-721. Field, A. (2005) Discovering Statistics using SPSS for Windows, Lonodon, Thousand Oaks, New Delhi, SAGE Publications. Filzmoser P. And Croux C. (2002) A Projection Algorithm for Regression with Collinearity, in JAJUGA K., SOKOLOWSKI A. and BOCK H. (Eds) Classification, Clustering and Data Analysis. Springer, Berlin. Gorman, S. P. and Kulkarni, R. (2004) 'Spatial small worlds: new geographic patterns for an information economy', Environment and Planning B-Planning & Design, 31, 273-296. Gorman, S. P. and Malecki, E. J. (2000) 'The networks of the Internet: an analysis of provider networks in the USA', Telecommunications Policy, 24, 113-134. Gorman, S. P. and Malecki, E. J. (2002) 'Fixed and fluid: stability and change in the geography of the Internet', Telecommunications Policy, 26, 389-413. Grubesic, T. H. and O'kelly, M. E. (2002) 'Using points of presence to measure accessibility to the commercial Internet', Professional Geographer, 54, 259-278. Hepworth, M. (1989) Geography of the Information Economy, London, Belhaven Press. KMI Research Group (2001) 'PAN European fiberoptic network routes planned or in place', http://www.kmiresearch.com/ Liu R. X., Kuang J., Gong Q. And Hou X. L. (2003) Principal component regression analysis with SPSS, Computer Methods and Programs in Biomedicine 71, 141-47. Malecki, E. J. (2002) 'The economic geography of the Internet's infrastructure', Economic Geography, 78, 399-424. Malecki, E. J. (2004) 'Fibre tracks: explaining investment in fibre optic backbones', Entrepreneurship and Regional Development, 16, 21-39. Malecki, E. J. and Gorman, S. P. (2001) 'Maybe the death of distance, but not the end of geography: the Internet as a network', IN Leinbach, T. R. & Brunn, S. D. (Eds.) Worlds of E-Commerce: Economic, Geographical and Social Dimensions. West Suusex, Wiley. Mardia K. V., Kent J. T. And Bibby J. M. (1979) Multivariate analysis. Academic Press Inc., London. Massy W. F. (1965) Principal Components Regression in Exploratory Statistical Research, Journal of the American Statistical Association 60, 234-56. Moss, M. L. and Townsend, A. M. (2000) 'The Internet backbone and the American metropolis', Information Society, 16, 35-47. O'kelly, M. E. and Grubesic, T. H. (2002) 'Backbone topology, access, and the commercial Internet, 1997-2000', Environment and Planning B-Planning & Design, 29, 533-552. Richardson, R. and Gillespie, A. (2000) 'The economic development of peripheral rural areas in the information age', IN Wilson, M. I. & Corey, K. E. (Eds.) Information Tectonics. Wiley. Roberts, D. (2006) 'Broadband gluttons', Financial Times, London Rutherford, J. (2005) 'Networks in cities, cities in networks: Territory and globalisation intertwined in telecommunications infrastructure development in Europe', Urban Studies, 42, 2389-2406. Rutherford, J. (forthcoming) 'A technological urban hierarchy of Europe? Analysing inter-city telecomunications connections as measurements of world city network formation', Urban Studies. Rutherford, J., Gillespie, A. and Richardson, R. (2004) 'The territoriality of Pan-European telecommunications backbone networks', Journal of Urban Technology, 11, 1-34. Sassen, S (2000) Cities in a World Economy (2nd Adition), Pine Forge Press, California. Schintler, L. A., Gorman, S. P., Reggiani, A., Patuelli, R., Gillespie, A., Nijkamp, P. and Rutherford, J. (2004) 'Complex Network Phenomena in Telecommunication Systems', Tinbergen Institute, Discussion Paper. Shahin, J. (2006) ‘'A European history of the Internet’Internet', Science and Public Policy 33: 681-693. Taaffe, E. J., Gauthier, E. L. and O'kelly, M. E. (1996) Geography of Transportation, New Jersey, Prentice-Hall, Inc. Taylor, P. (2004) World City Network: A Global Urban Analysis. Routledge, London and New York. Townsend, A. M. (2001a) 'Network cities and the global structure of the Internet', American Behavioral Scientist, 44, 1697-1716. Townsend, A. M. (2001b) 'The Internet and the rise of the new network vities, 1969-1999', Environment and Planning B-Planning & Design, 28, 39-58. Wheeler, D. C. and O'kelly, M. E. (1999) 'Network Topology and city accessibility of the commercial internet', Professional Geographer, 51, 327-339. Zook, M. A. (2002) 'Hubs, nodes and by-passed places: a typology of e-commerce regions in the United States', Tijdschrift voor Economische en Sociale Geografie, 93, 509-521.
NOTES* Emmanouil Tranos, CURDS, Newcastle University, UK, Email: emmanouil.tranos@ncl.ac.uk ** Andy Gillespie, CURDS, Newcastle University, UK, Email: andy.gillespie@ncl.ac.uk 1. Other options in order to explore the Internet’s spatiality is using Points of Presence (POP) (Grubesic and O’kelly, 2002), the physical address of IP (Dodge and Shiode, 2000) or the adoption of e-commerce by business (Zook, 2002). 2. In this case, Internet accessibility indicator is based on connectivity matrices and on the methodology proposed by (Taaffe et al., 1996). 3. This term is widely used for the companies who provide access to the Internet. However, it can also be used to describe the backbone networks as well. For the remaining of this paper, the second definition of this term is adopted. 4. An interesting review of the European history of the Internet from the governance point of view can be found at Shahin 2006. 5.It is shaped by London, Hamburg, Munich, Milan and Paris. 6. NUTS stands for the Nomenclature of Territorial Units for Statistics. There 1214 NUTS 3 and 254 NUT2 regions in EU25. For the context, a NUTS 2 region is the Inner London and a NUTS3 the Inner London – West. 7. According to ESPON (2005b) this is the year that the roll out on those networks stopped. This timing could not be unrelated with the dot-com bubble burst and the unwilling of investing on new technologies after the 2001 crash. 8. This data was initially provided by KMI research as a map for the needs of ESPON 1.2.2 Project (ESPON, 2005b), in which one of the present authors was involved. The data has been re-analysed for this paper. 9. The redundant links between any two cites refer to the overlapping links connecting those two cities and can guarantee Internet connectivity even if one of them is down (Gorman and Malecki, 2002).
AppendixTable A1: Model 1 and 2 variables (NUTS3 Regions)
Table A2: Model 3 variables (NUTS2 Regions)
Note: This Research Bulletin has been published in European Urban and Regional Studies, 16 (4), (2009), 423-437 |
|||||||||||||||||||||||||||||||||||||||||||||||||||||||||||||||||||||||||||||||||||||||||||||||||||||||||||||||||||||||||||||||||||||||||||||||||||||||||||||||||||||||||||||||||||||||||||||||||||||||||||||||||||||||||||||||||||||||||||||||||||||||||||||||||||||||||||||||||||||||||||||||||||||||||||||||||||||||||||||||||||||||||||||||||||||||||||||||||||||||||||||||||||||||||||||||||||||||||||||||||||||||||||||||||||||||||||||||||||||||||||||||||||||||||||||||||||||||||||||||||||||||||||||||||||||||||||||||||||||||||||||||||||||||||||||||||||||||||||||||||||||||||||||||||||||||||||||||||||||||||||||||||||||||||||||||||||||||||||||||||||||||||||||||||||||||||||||||||||||||||||||||||||||||||||||||||||||||||||||||||||||||||||||||||||||||||||||||||||||||||||||||||||||||||||||||||||||||||||||||||||||||||||||||||||||||||||||||||||||||||||||||||||||||||||||||||||||||||||||||||||||||||||||||||||||||||||||||||||||||||||||||||||||||||||||||||||||||||||||||||||||||||||||||||||||||||||||||||||||||