GaWC Research Bulletin 281 |
|
|
|
This Research Bulletin has been published in Urban Studies, 47 (10), (2010), 2195-2215 under the title 'Refining the Air Traffic Approach to City Networks'. Please refer to the published version when quoting the paper.
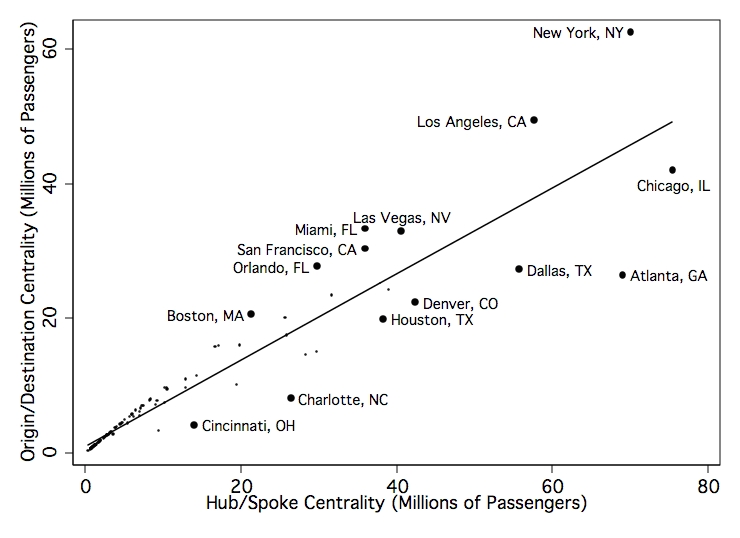
Over the past several decades, researchers have adopted the concept of networks, as both metaphor and formal statistical model, to understand the structure and organization of modern urban systems. Some have described the replacement of more traditional ‘spaces of places’ by newer ‘spaces of flows’ (Castells 1996). Others have investigated the economic consequences of cities’ positions in domestic and global networks (e.g. Irwin and Kasarda 1991; Alderson and Beckfield 2004). Indeed, this pairing has been described as the “perfect marriage of a theoretical approach and an analytic technique” (Smith and Timberlake 1993:197). The overriding challenge for research on urban networks has been one of measurement: how can the linkages between cities be operationalized? The muchlamented lack of data, sometimes referred to as the literature’s ‘dirty little secret’ (Short et al. 1996), has led to a number of creative but often unacceptable solutions. Some infer relations between cities on the basis of institutions located within them (e.g. Taylor 2001; Alderson and Beckfield 2004), while others assume that relations made possible by infrastructure reflect actual interactions (e.g. Townsend 2001; Bowen 2002). Airline traffic data has been proposed as a promising solution to these difficulties, but as Derudder and Witlox (2005) demonstrated, these data introduce their own complications. The hub-and-spoke structure of airline routes conflates the economic organization of the urban system and the corporate organization of the airline industry, while the popularity of air travel for a range of purposes blurs the distinction between leisure and business oriented exchanges among cities. In this paper, I refine the air traffic approach to defining city networks by excluding intermediate destinations (i.e. layovers) and separating business from leisure travel, using publicly available data to build more precise and theoretically motivated picture of the space of flows. I begin with a review of the role of networks in modern urban systems and describe the limitations of the most common methodological approaches in this area. Turning to the air traffic approach in particular, I then consider the unique challenges that accompany data distorted by the influence of air carrier hubs and passengers with unknown travel purposes, and offer a solution for overcoming them. Using the Airline Origin and Destination Survey (US Department of Transportation 2006) to examine airline traffic patterns among 115 US metropolitan areas in 2006, I find that cities’ centrality in a network that omits intermediate destinations and non-business travelers better explains employment generally, and employment in professional and management occupations in particular, than urban networks that do not make such theoretically critical distinctions. To demonstrate the usefulness of this more precise network operationalization, I then test a model of interurban business exchanges in the US, finding that while cities’ internal attributes have some influence, such relational factors as economic similarity are also important. I conclude with a discussion of the limitations of these results and direction for future research. CITIES AND NETWORKS: THEORY AND METHODOLOGICAL CHALLENGESFor centuries it was cities’ spatial centrality – their size within and dominance over a surrounding hinterland – that conferred upon them status in the urban hierarchy and economic significance in the urban system (von Thünen [1826] 1966, Christaller [1933] 1966). However, recently the importance of centrality in space has given way to centrality within an aspatial network (Neal 2008a), as the roles of cities have increasingly become “a function of cross-border networks rather than simply the most powerful city of an empire” (Sassen 2002:17). Castells (1996) captured this transition in his contrast between the historical organization of urban systems as ‘spaces of places’ and their emerging organization as ‘spaces of flows.’ In the former case, cities derived their functions from the natural and human resources provided by its surrounding territory or hinterland. For example, areas of sparsely populated, arable land gave rise to numerous small town agricultural centers, while cities surrounded by these agricultural centers emerged as centers of commerce (i.e. central places). In the latter case, however, cities’ functions derive from their linkages to other places, which not only allow cities to draw resources from and serve the needs of distant lands, but also establish distinctly structural urban roles like hubs where flows converge (e.g. New York), bridges where disconnected parts of the network are linked (e.g. Miami), and even isolates with few extraregional relationships (e.g. Detroit). Being central within a network of exchanges can have a range of implications for a city depending on the nature of the exchange. In the cases of migration, tourism, or business travel, where the exchanges are actual human movements, centrality serves to concentrate human capital and consumer demand within certain cities. For example, although quite far from the border, Chicago’s position in the flow of Mexican immigrants into the US generates a unique blend of cultural tastes visible in the city’s many supermercados, but is also evident in the low-cost labor that staff the city’s hotels and restaurants in its rise as a major tourism destination. Examining exchanges of this sort, many have found that cities’ centrality is not only positively associated with employment structures (Taaffe 1956; Goetz 1992; Cattan 1995), but also causally responsible for it (Irwin and Kasarda 1991; Ivy et al. 1995; Brueckner 2003). Of course, such centrality can also strain a city’s resources and infrastructure when inflows exceed capacity thresholds, as when refugee flows overwhelm border towns, when college students overrun spring break destinations, or simply when commuters clog the business district’s arteries. A second type of interurban exchange involves the movement of capital and authority, where the distribution of centrality among cities establishes the urban hierarchies of command and control implied by theories of metropolitan dominance (McKenzie 1933) and more recently of the new international division of labor (Cohen 1981). Early examples include the bank correspondent linkages that served to integrate the pre-electronic US financial system (Conzen 1977), but more recently as production and management functions spatially decoupled, control networks developed to connect headquarters to their operational facilities and other subsidiaries (Ross 1987; Alderson and Beckfield 2004). Because they mediate the relationships between all other places, cities that are central within networks of this type of exchange set the urban economic agenda. A particularly clear example of this form of centrality is found in the global city triumvirate of New York, London, and Tokyo; these places are the key nodes where economic activity in their respective regions is coordinated and transmitted onto the world stage (Sassen 2001). The exchange of information represents yet a third dimension of the urban network, and one that has been shaped and reshaped by technological change. While news of events in Europe took three months or more to reach a Philadelphia newspaper in 1790, the city’s privileged position in the exchange of information secured its primate city position for several decades. But, with the 1818 launch of four-times monthly ‘packet service’ from Liverpool to New York by the Black Bell line, the network’s structure changed and the locus of centrality in the US urban system shifted (Pred 1973). Such exchanges of information in physical form via express courier services, now reserved for official documents or investment instruments, continue to structure the US urban economy into a steep and spatially independent hierarchy that divides powerful senders from subordinate receivers (Wheeler and Mitchelson 1989). Increasingly, however, it is cities’ positions along networks of electronic information exchange that are a source of economic control (Townsend 2001). Whatever the specific mode of information transmission, centrality within a network of information exchanges is key because it concentrates within certain cities the raw materials of creativity and innovation. Such exchanges of people, capital, and information define (frequently overlapping) urban networks that play an important role in the economic lives of modern cities. However, difficulties in measuring these exchanges have limited researchers’ ability to explicitly examine their effects. Indeed, virtually all studies of city networks begin with a lamentation concerning the lack of comparative and relational data. In response, some have sought to develop creative empirical solutions that would allow relationships between cities to be inferred from institutions within cities. In the simplest cases, a city’s centrality in the network is equated with some internal attribute(s), ranging from a comprehensive political-cultural-financial soup (Hall 1966; Reed 1981), to more narrowly focused counts of headquarters and corporate service firms (Friedmann 1986; Sassen 2001), and even to major spectacles like the Olympics or the 1995 Rolling Stones World Tour (Short et al. 1996). More sophisticated analyses used the presence of certain institutions to derive an urban network in which linkages are assumed to exist between the locations of corporate headquarters and their subsidiaries (Ross 1987; Alderson and Beckfield 2004) or between cities with similar populations of corporate service firms (Taylor 2001). While these assumptions are facially valid, rarely is empirical evidence offers that supports this methodology. As Nordlund (2004) has noted, “treating such [attribute] values as structural data misses the whole point with network analysis…[creating] something that looks like structural data, although it is not” (p. 293). Indeed, using the economic attributes of individual cities to make assumptions about their network linkages, which in turn are used to explain the cities’ economic attributes, approaches circularity. Theoretical understandings of the structure and significance of urban networks are fundamentally rooted in understanding intercity relationships, but there is limited empirical evidence that the relationships between cities can be constructed from attributional data. One common alternative has involved analysis of the infrastructures that make relationships between cities possible. Although now obsolete due to consolidation and technological innovations in the banking industry, some examined linkages in the correspondent banking system that allowed larger city banks to provide services to customers of independent banks in smaller towns (Lieberson and Schwirian 1962; Conzen 1977). More recently, others have examined transportation infrastructures, making use of readily available airline schedules (Ivy et al. 1995; Bowen 2002; Zook and Brunn 2006) or Internet backbone cable locations (Wheeler and O’Kelly 1999; Townsend 2001; Devriendt et al 2008). This is problematic, however, because such networks capture only where passengers or information could travel, but not where they do travel; they measure accessibility, but not access. Thus, the structure of city networks based on infrastructure is often defined more by the institutions maintaining them – banks, airline carriers, or internet service provides – than by the actual exchanges of capital, people, or information they carry. Because attribute- and infrastructure-based methods yield results that are often inappropriate for investigating urban networks, many have turned to airline traffic patterns for a solution (e.g. Irwin and Kasarda 1991; Smith and Timberlake 2001; Derudder and Witlox 2005). The analysis of intercity networks mapped using air traffic has a long history, first as an empire building strategy (e.g. Prince of Wales et al. 1920) and later to explore the economic consequences of commercial aviation (e.g. Taaffe 1956) and its deregulation (e.g. Goetz and Sutton 1997). Importantly, this approach differs from the purely infrastructural approaches above because it examines the movement of people through the infrastructure, rather than examining the infrastructure itself. Beyond the methodological advantages of directly capturing relationships rather than inferring them from attributes, and of capturing actual exchanges rather than simply the opportunity for exchange, the air traffic approach is particularly appropriate for modern urban network research for a number of substantive reasons (Keeling 1995; Rimmer 1998). Despite advances in information and communications technology, faceto- face interactions remain an integral part of business transactions, academic collaborations, and political machinations, and air travel is the preferred method of making such connections. Air travel also plays a primary role in the rapidly growing tourism industry and in the movement of time-sensitive documents and other highvalue, low-bulk goods including scientific equipment. Moreover, the mere announcement of ‘new non-stop service to New York’ (or Los Angeles, or Chicago, etc.) at a mayoral press conference is a symbolic marker of urban status, and a signal of aspirations for enhanced openness and/or domination. Finally, while air traffic data directly document the movement of people and things, an air traffic network also implicitly captures the exchanges of the capital, power, and information those people and things embody. Although the air traffic approach to defining urban networks overcomes many common methodological challenges in this area of research, it introduces a unique set of issues. Derudder and Witlox (2005) highlighted several of these, but here I focus on two theoretically significant distinctions that are difficult to make empirically and thus are often ignored: intermediate versus terminal destinations, and business versus leisure travel. Intermediate versus Terminal DestinationsMany studies examine city networks defined by actual passenger movements, where the strength of the linkage between a pair of cities defined as the number of passengers flying between them (Cattan 1995; Keeling 1995; Rimmer 1998; Brueckner 2003). This approach yields hub/spoke networks because, by including intermediate destinations (i.e. layovers), their structure depends upon the corporate organization of the airline industry and more specifically the post-deregulation hub-and-spoke system (Goetz and Sutton 1997). A simple example illustrates the problem. A passenger flying from Phoenix to New York with a layover in Atlanta would be reflected in a hub/spoke network by two distinct interurban exchanges: Phoenix–Atlanta and Atlanta–New York. Because Atlanta participates in both exchanges, it appears twice as central as either Phoenix or New York, despite the fact that the passenger’s involvement with the Atlanta economy might involve little more than the purchase of a Coke while waiting for the next flight. A city’s centrality in a hub/spoke network depends primarily on “transportation carriers’ individual corporate choices…[and] can therefore be quite a transitory and artificial characteristic…that generates activity of great operational significance to airports” (Fleming and Hayuth 1994:18). Thus, a recent empirical analysis of such a hub/spoke network not surprisingly found that “the structure of the US airline network reflects…the competitive business strategies of commercial airlines” (Xu and Harriss 2009:87)1. However, because many studies of city networks are not primarily concerned with understanding airport operations or the business strategies of commercial airlines, examining hub/spoke networks that capture the actual physical movements of passengers is often inappropriate. Of greater significance to the urban economy is the movement of capital, power, and information carried by those passengers, but unlike the passengers themselves, these resources do not linger in layover stops. An executive’s decision-making authority, for example, moves directly from the origin city to the destination city, but is not especially relevant and is rarely exercised in a layover airport’s food court. Thus, a slightly different type of network – an origin/destination network – better captures the interurban exchange of relevant resources by defining linkages only between initial origin and final destination cities. In the example above, an origin/destination network would not include Atlanta at all, and would more accurately capture the movement of resources from Phoenix to New York (Derudder et al. 2007). To test the differential explanatory abilities of these two types of network, I hypothesize that centrality in a hub/spoke network is more closely associated with employment in air transport occupations (H1A), while centrality in an origin/destination network is more closely associated with employment in all other occupations (H1B). Business versus Leisure TravelWhile studies examining origin/destination networks come closer to capturing the exchange of key resources between cities, their results must still be interpreted cautiously because the content of the exchanges is often unknown (Irwin and Kasarda 1991; Irwin and Hughes 1992; Smith and Timberlake 2001). As air travel has become more affordable, the proportion of passengers traveling for pleasure has increased (Dresner 2006). Thus, although many studies aim to examine such sophisticated economic processes as world city status or employment in advanced producer services, the vast majority of exchanges captured in the networks they analyze are related to tourism. This is problematic not only because business and leisure travel represent the exchange of different types of resources between cities, but also because business and leisure travelers differ in their travel patterns. Some cities are primarily leisure destinations (e.g. Las Vegas), while others are primarily business destinations (e.g. Washington, DC), and still others attract complex and interacting combinations of both types of passenger (e.g. Miami). The distorting effects of aggregating business from leisure travel can be observed in prior findings. Choi, Barnett, and Chon (2006) found a modest correlation (r = .46) between the structures of city networks based on Internet backbone and airline origin/destination. This limited correspondence is likely driven by the fact that for both networks the content of the exchanges is unknown. In the former case much of the bandwidth is occupied by pornography (Purdue 2002), while in the latter most of the passengers are on vacation; neither is a particularly suitable index of world city status. Comparing an airline origin/destination network to a network based on corporate service firm location, Taylor et al. (2007) found a much higher correlation (US r = .85; non-US r = .78), but the large residuals observed for tourist destinations (e.g. Las Vegas, Honolulu) and regional corporate centers (e.g. Buffalo, Charlotte) suggest that aggregating business and leisure traffic suppressed a still stronger correlation. Owing to the empirical difficulty of distinguishing business from leisure passengers (Walters 1978; Dresner 2006), only two studies of origin/destination networks, both focused on European cities, have directly addressed this issue. Using cross-sectional data from the 2001 Dateline Consortium study of European longdistance mobility, one found that cities’ sociodemographic and economic characteristics are more highly correlated with business than leisure traffic (r = .81 vs. .58; Limtanakool et al. 2007). A second, using proprietary data, found that business-class travelers are more concentrated in what they describe as “clear-cut business cities” (Derudder et al. 2008:14). To test the differential explanatory abilities of network capturing business and leisure travel, I hypothesize that centrality in a leisure travel network is more closely associated with employment in the tourism industry (H2A), while centrality in a business travel network is more closely associated with employment in management and professional occupations (H2B). The distinction in these hypotheses between industry and occupation, while subtle, is important. Leisure travel is driven by a desire to consume the product of an industry (i.e. entertainment), while business travel is driven by a need to fulfill the obligations of an occupation. REFINING THE AIR TRAFFIC APPROACHOthers have made progress in highlighting and overcoming the challenges of the air traffic approach to city networks. However, each of their empirical solutions relies on non-public data from Marketing Information Data Transfer (MIDT) or Association of European Airlines (AEA) databases, obtained in each case only with the cooperation of a member airline (e.g. Derudder and Witlox 2005; Derudder et al. 2007; Taylor et al. 2007; Derudder et al. 2008). As a result, while their solutions are methodologically promising, they are limited in their practical feasibility. In this study, data from the publicly available Airline Origin and Destination Survey (US Department of Transportation 2006) is used to define the networks under consideration. This survey, derived from data reported by air carriers to the Office of Airline Information and released quarterly by the US Bureau of Transportation Statistics, provides details about a 10% random sample of all domestic commercial air travel, including major airlines, low-cost carriers, and charter services. This data is provided in three separate tables, linked by common identifiers, that reflect nested definitions of a ‘trip’ and contain slightly different variables: (1) coupon data corresponds to a single takeoff and landing, (2) market data corresponds to all flight segments from origin to destination, and (3) ticket data corresponds to an entire itinerary. The analyses below merge and use information from both the coupon and market data tables, including the date of travel, number of passengers, and fare. These data are available electronically since 1993 and in print since at least 1946, thus potentially allowing very long-range longitudinal analysis. It has been used primarily for regulatory and government purposes (i.e. airport construction/expansion), but also in social science research (e.g. Irwin and Kasarda 1991). The Origin and Destination Survey is an ideal data source for examining urban networks because it captures actual exchanges between US cities, thereby overcoming the pitfalls of the attribute- and infrastructure-based approaches addressed above. In these analyses, the focus is restricted to travel in 2006 among the 115 metropolitan areas (i.e. core based statistical areas) served by one or more commercial airports representing at least 0.05% of all domestic enplanements (i.e. primary hub airports). Thus, for example, passengers using either O’Hare or Midway airports are recorded simply as Chicago passengers. In the two cases where a single airport jointly serves two metropolitan areas – Bradley International serves Hartford, CT and Springfield, MA; Raleigh-Durham International serves Raleigh and Durham, NC – the two metropolitan areas were combined. Comparing Hub/Spoke and Origin/Destination NetworksTo examine the differences between them, I define two city networks: a hub/spoke network and an origin/destination network. In the hub/spoke network, the strength of the linkage between two cities is equal to the number of passengers flying between them. In contrast, in the origin/destination network, the strength of the linkage between two cities is equal to the number of passengers originating in one and ultimately destined for the other, without regard to any intermediate stops between them. Each city’s importance within these two networks is operationalized using degree centrality (Freeman 1978/79), because this measure can be used with valued networks and has been identified as “an unambiguous indicator of world city-ness” (Alderson and Beckfield 2004:828)2. Additionally, degree centrality is easily interpretable: in the hub/spoke network it equals the total number of passengers passing through the city at any point in their journey, while in the origin/destination network it equals the total number of passengers for whom the city is either their origin or final destination. As discussed above, many analyses of air traffic-based city networks examine a hub/spoke network when the research question would be better answered through examination of an origin/destination network. To uncover the type of error this can yield, Figure 1 displays the results of a bivariate regression (B = .639, p < .001; R2 = .883) using centrality in the hub/spoke network to predict centrality in the origin/destination network. This result suggests that, on average, only about 64% of passengers using a city’s airport(s) remain in the city; the rest are just ‘passing through.’ However, because many cities are not average, their centrality in one network cannot be inferred from their centrality in the other. Compared to expectations based on the hub-spoke network, cities that lie above the regression line are more central in the origin/destination network, while cities that lie below are less central. The practical distinction between these two groups of places is obvious: cities in the lower right are the operational hubs for major airlines (e.g. Atlanta, Dallas), while cities in the upper left are true nodes in the exchange of resources among US cities (e.g. New York, Los Angeles). But, this distinction has theoretical implications. Studies that rely on hub/spoke networks overestimate the importance of hub cities. As Table 1 demonstrates, only a small percentage of hub city passengers remain in the city. Indeed, only 30 percent of all passengers flying to or from Cincinnati ever step outside the airport. To use Friedmann’s (1986) language, such places are ‘basing points’ in the articulation of capital in only a very narrow sense, as artifacts of a deregulated industry driven by economies of scale. In contrast, the importance of terminal cities is underestimated because the vast majority of their passengers leave the airport to take part in the city, whether on Wall Street in New York or on Main Street U.S.A. in Orlando’s Disneyworld. Not merely waypoints in the national economy, these are places where capital, power, and information are ultimately produced and consumed. This suggests that analyses of hub/spoke networks should be restricted to studies specifically focused on the airline industry, while the analysis of origin/destination networks are more appropriate for studies of advanced urban economies. To test this claim, I use data from the 2006 American Community Survey to examine the relative ability of centrality in these two types of networks to explain total employment in air transportation occupations (SOC 53-2000) and all other occupations. The results of two ordinary least squares regressions, using centrality in the hub/spoke and origin/destination networks to predict the number of individuals employed in these two occupational categories, are reported in Table 33. Consistent with H1A, centrality in the hub/spoke network had a strong positive effect on employment in air transportation jobs, independent of centrality in the origin/destination network, which had a weak (and, indeed, slightly negative) effect. Similarly, consistent with H1B, centrality in the hub/spoke network had no effect on employment in non-air transportation jobs, independent of centrality in the origin/destination network, which had a strong positive effect. These results reflect that fact that the majority of those who travel to hub cities do so only to consume additional airline services (i.e. connecting flights). But, those that have reached their final destination are no longer captive consumers of the airlines alone; they have come to the city qua city, and not merely to the city qua rest stop. Therefore, the origin/destination network is a more appropriate object of study for research not focused on the economic impact of the air transportation itself. Comparing Business and Leisure NetworksFocusing only on the origin/destination network for the reasons described above, I now compare two city networks that capture distinct types of exchanges: business and leisure. Although passengers’ reasons for traveling are not explicit in this data, they can be inferred from a combination of ticket characteristics, which I use to construct proxy assignments of passengers into business and leisure groups. Seeking to capture the most traditional group of business travelers – those whom Uriely (2001) calls ‘traveling professional workers’ and for whom flexibility and convenience are primary motivating factors – I operationalize business passengers as those who are traveling alone and paid statistically significantly (α = .05) greater than the route’s average fare. In contrast, seeking to capture those for whom value and companionship are primary motivating factors, I operationalize leisure passengers as those who are traveling with others and paid statistically significantly (α = .05) less than the route’s average fare. To reduce the computational requirements for implementing these criteria in data of this size (6.8 million passenger records) and complexity (over 13,000 distinct route combinations), the following analyses are conducted only on single-destination round-trip flights taken during the second quarter of 2006. Additionally, to avoid unnecessary double counting, only the outbound segment of a round-trip flight is used in constructing the networks. As a proxy measure, this approach has some limitations. For example, it fails to identify as ‘business passengers’ those who do not have expense accounts at their disposal (e.g. academics, non-profit workers, etc.). Similarly, it may misclassify those who bring work with them while on vacation or those whose employers, to cut costs, book business travel using lower cost carriers or seat assignments. However, it nonetheless offers several advantages over the alternatives. First, by using existing data it overcomes the sheer impracticality of a large, independent survey of travelers. Second, by relying on publicly and longitudinally available data, it can be easily replicated in different samples and at different times. Third, by using individuals’ actual willingness to pay rather than passengers’ cabin class (e.g. Derudder et al. 2008), it more accurately classifies those who purchase unusually high-cost (e.g. last-minute) tickets in coach class as business travelers and those who find unusually good bargains on upgraded seats as leisure travelers. As in the previous section, cities’ importance in these networks is operationalized using degree centrality, but key differences in business and leisure travel patterns must be taken into account. Because leisure travel is undertaken to consume goods and services at a specific destination, in-degree centrality, which counts only the number of passengers flying to a city, is used to measure cities’ importance in the leisure network. In contrast, the direction of business travel does not necessarily indicate the direction of the associated exchange of resources. For example, if a businessperson is traveling to conduct a training session, information moves from the passenger’s origin to the destination, but if the trip is taken to identify potential new vendors, the information moves from the passenger’s destination to the origin. Therefore, cities’ importance in the business network is measured using undirected degree centrality (Limtanakool et al. 2007). Because most analyses of air traffic-based city networks consider all passengers together, implicitly combining travel taken for fun and profit, they examine an ambiguous exchange network. To uncover the type of error this can yield, Figure 2 displays the results of a bivariate regression (B = .619, p < .001; R2 = .767) using centrality in the leisure network to predict centrality in the business network. This result suggests that, on average, for every 1,000 leisure passengers destined for a city, 619 business passengers either began or ended their journey there. But again, because many cities are not average, business centrality cannot simply be inferred from leisure centrality. Cities that lie above the regression line are especially central in the business network, while those that lie below are more central in the leisure network, thus dividing places into theoretically significant but often empirically neglected types (see Table 3). Some cities are unambiguously devoted to the pursuit of pleasure, serving as major leisure destinations for families (e.g. Orlando), college students (e.g. Brownsville/South Padre), and adults (e.g. Las Vegas). These cities are absolutely central in the circulation tourism dollars, but their position in the movement of business travelers and their baggage of capital, power, and information is much less significant. Leisure passengers passing through Kahului, for example, outnumber business passengers 5-to-1. Thus, although tourism continues to grow as a globally significant industry making these places increasingly economically important, they are still not the basing points of command and control implicated in Friedmann’s (1986) or Castells’ (1996) understanding of the city network. This is more the domain of a second group of cities where business centrality outpaces leisure centrality. In America’s world cities where high-volume exchanges of all types converge (e.g. Chicago, New York), business traffic represents a larger than average proportion of the total, while for more regional centers that are unlikely tourist destinations (e.g. Minneapolis, Detroit, Atlanta), business-oriented exchanges actually surpass exchanges of other types. It is clear that these places – the cities above the line in figure 2 – are the focal points of the urban economic network. Though less distinct, a third potential type of city in which business and leisure centralities are closely matched (e.g. Miami or Seattle) is also worth noting. Florida (2005) has argued that there is a close connection between the knowledge-based occupations that drive the new economy and the lifestyle and cultural amenities that drive reinvented downtowns. If such a linkage is enduring and not simply an artifact of dot-com idealism, then places that effectively bridge the networks of business and leisure might be still more significant than cities central in only one network. While they do not capture the volume of business-related exchanges of clear-cut business cities, they capture a specific and increasingly critical segment of them focused on creativity and innovation. These descriptive analyses suggest that it is essential for studies of city networks to be clear about the content of the intercity exchanges, and moreover when those studies are focused on advanced economic processes, to focus only on businessrelated exchanges. To test this, I examine the relative ability of centrality in the business and leisure networks to explain total employment in the Arts, Entertainment, and Recreation industry (NAICS 71) and in Management, Business, and Financial occupations (SOC 11 and 13), again using data from the 2006 American Community Survey. The results of two regressions, using centrality in the business and leisure networks to predict the number of individuals employed in these industrial and occupational categories, are reported in Table 4. These results do not support H2A, finding that while employment in the tourism industry is significantly associated with leisure centrality, it is more strongly associated with business centrality. This unanticipated result may be driven by the use of an industrial category that includes tourism-related businesses but also establishments catering to the consumption preferences of ‘creative class’ professionals (Florida 2005). However, consistent with H2B, employment in management occupations is much more strongly associated with business centrality than with leisure centrality, which has a slight (yet significant) negative effect. These results suggest that for research on cities’ higher-order economic processes, and potentially also on their cultural economies, the network of business exchanges is a more appropriate object of study. A MODEL OF BUSINESS EXCHANGES IN THE UNITED STATESThe analyses presented in the previous section are admittedly simple bivariate predictions of employment in a few limited sectors, but are intended primarily to examine the importance of distinguishing origins/destinations from hubs and business from leisure passengers. By making these distinctions, it is now possible to construct a more robust picture of intercity relations in the US. Thus, in this section I apply the lessons from these simple analyses to take closer look at the economic organization of the contemporary US city network. Specifically, I now turn to developing a model that explains the structure of the US city network by answering the question: What factors account for the volume of business exchanges between a pair of cities? The first, and perhaps most obvious, influences are features fixed within the origin and destination cities. Because larger cities have more sophisticated business and financial sectors, and larger populations of potential business travelers generally, they should be the origin or destination of more business exchanges. Cities that are home to corporate headquarters or major regional offices should also engage in more such exchanges. A number of other, harder to define urban characteristics are also likely to be influential, including whether the city has a history as a business center. To capture the influence of these city-specific characteristics on exchanges between pairs of cities, Lansing et al. (1961) suggested a variation on the traditional fixed effects regression model. In such a model, a dummy variable is included for each metropolitan area in the sample; for each dyadic observation of business exchanges, the dummy variables corresponding to both the origin and destination cities are coded 1, while the others are coded 0. The resulting coefficient estimates capture the common influence of all characteristics fixed within the corresponding city, and represent the additional number of business exchanges that are expected if the city is either the origin or destination. Additionally, this fixed-effects specification eliminates the inflation of type-I error that would normally result from the ordinary least squares analysis of dyadic data such as these (Simpson 2001). While city-specific effects play a significant role in structuring the organization of business exchanges, they ultimately remain focused on individual cities and thus shed no light on the role of relationships between cities. The interaction potential between two cities is frequently modeled as a multiplicative function of their sizes and inverse function of their distance, mirroring the formula for classical gravitational attraction (Zipf 1946; Stewart 1948; Hammer and Ilke 1957). In the case of business exchanges, this might take the form:
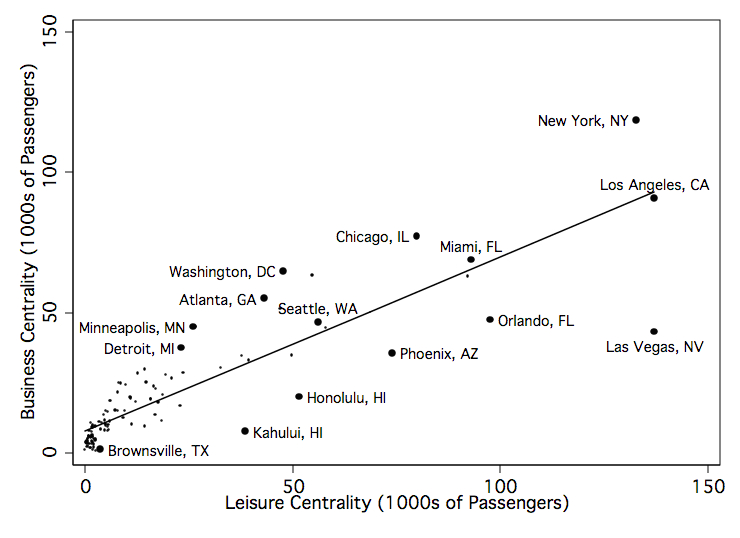
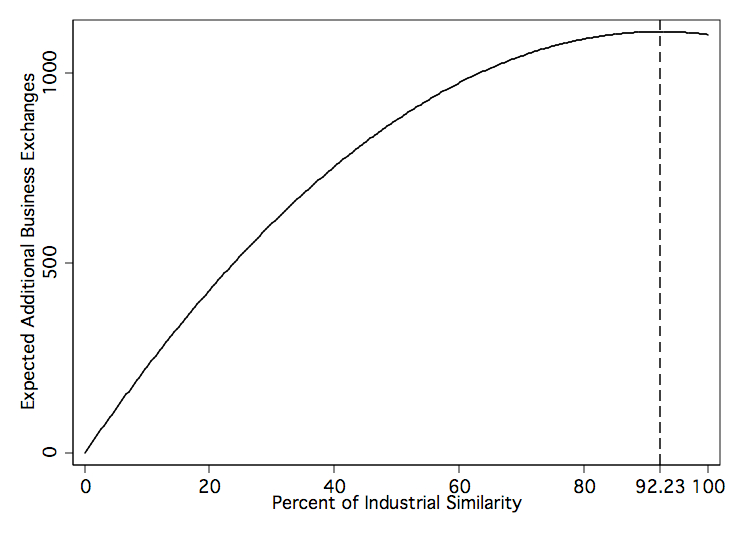
Here, the product of the number of businesspeople in cities i and j in the numerator reflects a multiplier-effects assumption that while exchanges are more common for big cities, they are even greater when the cities at both ends of the route are large. The denominator reflects a distance-decay assumption that the likelihood of such interactions is lower when they are separated by greater distance. While this specification is well suited to explain, for example, business exchanges between firms in the same city, where interactions are more likely among those working next door than across town, it is less appropriate for exchanges conducted via airline transportation, which is used primarily for long distance interaction. Thus, in defining the ‘gravitational attraction’ of two cities in this network, I introduce a small but critical modification to the traditional formula: GRAVITYij = BUSINESSi x BUSINESSj x ln(DISTANCEij) (2) Multiplying rather than dividing by the distance between cities reflects the assumption that air-based business exchanges will be primarily between more distant city pairs. The two variables, BUSINESSi and BUSINESSj, are the total employment in Management, Business, and Financial occupations (SOC 11 and 13) in 2006 for cities i and j, drawn from the 2006 American Community Survey. Because this multiplicative specification yields very large values, to aid in the presentation and discussion of results, GRAVITYij is rescaled, dividing all observations by one billion. This gravity measure treats the likelihood of business exchanges as simply proportional to cities’ sizes, as if such exchanges are made at random among all opportunities for interaction. However, exchanges between some cities are more likely than others because they are involved in similar or complementary activities that serve to draw them together. For example, a greater than random volume of business exchanges among Seattle, San Jose, and Austin is likely because all three have technology-focused economies. To operationalize cities’ industrial similarity, I use a variation of the dissimilarity index defined by Duncan et al. (1960):
where EMPLOYMENTai comes from the 2006 American Community Survey and equals the percentage of city i’s workforce that is employed in industry a. Aggregating across the 13 major industrial categories in the American Community Survey, SIMILARITYij equals the percentage of workers that are employed in the same industries and proportions between the two cities. Initial screening of the data suggest that the relationship between cities’ industrial similarity and their number of business exchanges may be curvilinear, so a quadratic term is also included in the model below. Thus, I test the hypothesis that the number of business exchanges between two cities, i and j, are a function of fixed within-city effects, occupational gravity, and industrial similarity using the following regression model: Business Exchangesij = βiDi + βjDj + β116GRAVITYij + β117SIMILARITYij + β118SIMILARITYij2 + ε (4) To permit the explicit estimation of all 115 city fixed-effects, a constant term is omitted. Table 5 presents ordinary least squares estimates for a reduced, city-effects only model and a full model that also includes the relational factors4. By including only within-city effects, the first model assumes a ‘space of places,’ where each city’s role in the network is a simple function of its own characteristics, rather than a ‘space of flows,’ where cities’ roles depend on their relationships with other cities. This implies, for example, that the number of corporate headquarters in a city may increase the number of exchanges the city participates in, independently of the characteristics of its exchange partner. Turning to the estimates, these results suggest that any route involving New York will carry 965 more business passengers regardless of the city at the other end of the exchange, in essence, just because it is New York. Conversely, any route involving Amarillo will carry 66 fewer business passengers because it is, after all, Amarillo. This naïve model explains 63.2% of the variation in intercity exchange volumes, appearing to suggest that some cities are business oases that attract and generate economic activity, while other places are business deserts that serve to dry up potential exchanges. However, this approach inappropriately treats cities as islands, thereby ignoring the influence of relational effects that take into account the characteristics of cities’ exchange partners. When such effects are included, here in the form of occupational gravity and industrial similarity, estimates of the fixed within-city effects either become statistically non-significant or trend toward non-significance, thus dramatically reducing the ostensible oasis-ness of cities typically considered key business or creative centers. That is, while the naïve ‘space of places’ model suggested any business exchange involving New York, Los Angeles, or Chicago would be quite strong, no matter what city completed the dyad, after taking into account relational factors, it becomes clear that there is nothing particularly Midas-like about these places. This finding supports earlier claims that for the key nodes in the city network, significance derives not from cities’ internal characteristics but rather from their position in the system (Castells 1996; Sassen 2001). The statistical significance of GRAVITY is unsurprising given the wide support for such gravity-type effects social and economic contexts, but serves to confirm that multiplier effects are at work boosting the volume of business exchanges among larger cities, and that such exchanges when conducted by air tend to bridge longer distances. Of greater interest is the quadratic significance of SIMILARITY. The coefficient estimates are difficult to interpret directly, but Figure 3 illustrates the influence of different levels of industrial similarity on the number of business exchanges between two cities, controlling for the city and gravity effects. More industrially similar pairs of cities are expected to engage in more business exchanges, but the effect of being industrially similar levels off near 80% and declines after about a 92% correspondence in the two cities’ industrial structures. This suggests that the network may be partly structured by a ‘goldilocks’ principle: Too little economic overlap and the cities’ firms have nothing in common, but too much overlap and there is no need for inter-city business exchanges because fruitful partnerships can be found within the city. Cities exchanging the greatest numbers of business passengers and their associated resources are those with an economic overlap that is ‘just right’ for capitalizing on potential synergies. This relationship between business exchange volume and industrial similarity also suggests that the network is clustered by economic specialization: high-tech cities exchange with one another, for example, but not with financial centers, which constitute a separate cluster. To the extent that such clustering prevents information about, and investment in, emerging economic opportunities from exiting closed circuits, it may allow some cities and regions to monopolize strategic information or advantageous industries (e.g. Silicon Valley, Route 128). Such network closure has the potential to slow economic growth by reducing the diffusion of innovations, and to lock cities into dying industries and downward trajectories by reinforcing path dependencies (e.g. Detroit, Cleveland). While these models reveal much about how the city network is organized, examining where they fail in their explanations also sheds light on some important patterns. Table 6 lists the largest positive and negative residuals resulting from the full model. The positive residuals – city pairs that have more business exchanges than expected – appear to occur in dyads with unique characteristics that increase their likelihood for interaction. For example, the Boston-San Francisco exchange may be driven by these cities roles as banking centers, while the Los Angeles-Honolulu linkage is rooted in geographic and historic linkages. In contrast, many of the negative residuals – city pairs with fewer exchanges than expected – are concentrated in the Boston-Washington corridor, where business exchanges are likely underestimated by this data because rail is a more common mode of transportation than air. City pairs with negative residuals that are located outside the northeast may represent missed opportunities, as dyads either underserved by the commercial airlines or offering an unrealized potential for business partnerships. CONCLUSIONWhile offering a more robust application of the air traffic approach to examining city networks, the limitations of these analyses also highlight several promising directions for future research. First, the data examined above is restricted to US cities, although the methodological innovations described are more general. Intra-national and regional networks among cities continue to be influential (Esparza and Krmenec 2000), however the structure of the networks examined here likely exhibit characteristics specific to the US context, including the historical influence of federal hub/spoke regulation and the geographical influence of large distances separating bi-coastal urban centers. Moreover, because urban transportation and financial networks are fully international, it is important to seek genuinely relational data on a global sample of cities to examine their effects. Derudder and Witlox (2005), for example, made progress in this direction by obtaining and analyzing MIDT data, but issues of access arise with such proprietary datasets. Until truly global data are more readily available, a crossnational comparison of intra-national networks may be possible by combining the US Origin and Destination data with similar data from other countries. While not directly examining a global network, a multi-level design would allow researchers to explore how national-level characteristics influence internal spaces of flows. Second, because the direction of business travel does not necessarily indicate the direction of a business exchange, the analyses above ignore the direction of travel and assume all exchanges are reciprocal (Limtanakool et al. 2007). However, the asymmetries that occur when economic resources flow only (or more heavily) in one direction are worth noting because they reflect and reinforce relations of power and dependence. These asymmetries can establish a power-geometry wherein “some [cities] are more in charge of [the system] than others; some initiate flows and movements, others don’t; some are more on the receiving end of it than others; some are effectively imprisoned by it” (Massey 1993: 61). A city that only initiates or receives exchanges, and thus is only partially central to the network, is less structurally advantaged than a city that participates reciprocally in both sending and receiving relations. Therefore, future research on urban networks must seek to clarify not only the content and volume, but also the direction, of intercity exchanges. Third, these analyses are restricted in scope by focusing on the subset of business-related exchanges that are conveyed via air by those with expense accounts. Air traffic-based networks capture exchanges between cities that are separated by some minimum distance, but not those between places for which alternate modes of transport are more efficient. This biasing effect of an air-focused network is apparent in the negative residuals in table 6, and would be still more dramatic in other world regions where high-speed rail infrastructures are better developed (e.g. Europe) or where air infrastructures are underdeveloped (e.g. Africa). Moreover, identifying business passengers based on airfare likely does not capture business-related exchanges generated by those without expense accounts (e.g. small business owners, government operatives, nonprofit workers, academics) or those who conduct some business while on holiday (Uriely 2001). Such an economic approach risks marginalizing less corporate, but no less important, places and flows (Robinson 2002). These scope limitations not only reinforce the earlier claim that it is critically important to be clear about the content of the exchanges under investigation, but also call for greater inclusiveness in future research on city networks. Finally, these analyses provide a cross-sectional snapshot of the businessoriented US city network. But, a notable and as yet untapped advantage of the Airline Origin and Destination Survey data is its availability over time, which allows researchers to examine changes in the structure and organization of the network. Some suggest that competition among America’s largest cities for the title of ‘global city’ has led to losses in New York’s presumed supremacy, as well as a division of labor among the upper levels of the American urban hierarchy (Markusen and Gwiasda 1993). Others argue that once insignificant places like Bentonville, Arkansas and second or third-tier cities like Des Moines or Fargo are becoming increasingly integrated into the network, and as a result increasingly able to capture the higher-order economic functions once reserved for only the largest cities (Kotkin 2003, Neal 2008a). Here, a dynamic network approach could help to demonstrate such transformations. In seeking to refine the air traffic approach to examining city networks, this paper has outlined a more methodologically precise and theoretically informed path for future research in this area. Using air traffic patterns among US cities, I demonstrate that excluding layovers and non-business passengers yields a city network that more closely corresponds to common theoretical assumptions and to the hypotheses they imply. Further analyses of the resulting origin/destination business network revealed that its structure is driven by gravity-type effects and industrial similarity rather than simply by the internal attributes of individual cities. While city networks are undoubtedly complex, they are likely to become still more important in the operation of urban systems in the future. As scholarship in this area moves forward, it will therefore be essential to avoid inappropriate or insufficiently specific data and seek a closer connection between the method of networks and the theory of cities. ACKNOWLEDGEMENTSI want to thank editor Michael Timberlake and three anonymous reviewers for their helpful comments, as well as Jennifer Watling Neal, Anthony Orum, and Pamela Popielarz for providing feedback on earlier drafts. REFERENCESAlderson, Arthur S. and Jason Beckfield. 2004. “Power and Position in the World City System.” American Journal of Sociology 109: 811 – 51. Bowen, John. 2002. “Network Change, Deregulation, and Access in the Global Airline Industry.” Economic Geography 78: 425 – 39. Brueckner, Jan K. 2003. “Airline Traffic and Urban Economic Development.” Urban Studies 40: 1455 – 69. Castells, Manual. 1996. The Rise of the Network Society. Malden: Blackwell. Cattan, Nadine. 1995. “Attractivity and Internationalization or Major European Cities: The Example of Air Traffic.” Urban Studies 32: 303 – 12. Choi, Junho H., George A. Barnett, and Bum-Soo Chon. 2006. “Comparing World City Networks: A Network Analysis of Internet Backbone and Air Transport Intercity Linkages.” Global Networks 6: 81 – 99. Cohen, R. B. 1981. “The New International Division of Labor, Multinational Corporations, and Urban Hierarchy.” Pp. 287 – 315 in Urbanization and Urban Planning in Capitalist Society, edited by Michael Dear and Allen J. Scott. New York: Methuen. Conzen, Michael P. 1977. “The Maturing Urban System in the United States, 1840 – 1910.” Annals of the Association of American Geographers 67: 88 – 108. Christaller, Walter. [1933] 1966. Central Places in Southern Germany, translated by Carlisle W. Baskin. Englewood Cliffs, NJ: Prentice Hall. Derudder, Ben and Frank Witlox. 2005. “An Appraisal of the Use of Airline Data in Assessing the World City Network: A Research Note on Data.” Urban Studies 42: 2371 – 88. Derudder, Ben, Lomme Devriendt, and Frank Witlox. 2007. “Flying Where You Don’t Want to Go: An Empirical Analysis of Hubs in the Global Airline Network.” Tijdschrift voor Economische en Sociale Geografie 98: 307 – 24. Derudder, Ben, Frank Witlox, James Faulconbridge, and Jon Beaverstock. 2008. “Airline Data for Global City Network Research: Reviewing and Refining Existing Approaches.” Geojournal 71: 5 – 18. Devriendt, Lomme, Ben Derudder, and Frank Witlox. 2008. “Cyberplace and Cyberspace: Two Approaches to Analyzing Digital Intercity Linkages.” Journal of Urban Technology 15: 5 – 32. Dresner, Martin. 2006. “Leisure Versus Business Passengers: Similarities, Differences, and Implications.” Journal of Air Transport Management 12: 28 – 32. Duncan, Otis Dudley, W. Richard Scott, Stanley Lieberson, Beverly Duncan, and Hal. H. Winsborough. 1960. Metropolis and Region. Baltimore, MD: Johns Hopkins Press. Eberstein, Isaac W. and W. Parker Frisbie. 1982. “Metropolitan Function and Interdependence in the U.S. Urban System.” Social Forces 60: 676 – 700. Eberstein, Isaac W. and Omer R. Galle. 1984. “The Metropolitan System in the South: Functional Differentiation and Trade Patterns.” Social Forces 62: 926 – 40. Esparza, Adrian X. and Andrew J. Krmenec. 2000. “Large City Interaction in the US Urban System.” Urban Studies 37: 691 – 709. Fleming, Douglas K. and Yehuda Hayuth. 1994. “Spatial Characteristics of Transportation Hubs: Centrality and Intermediacy.” Journal of Transport Geography 2: 3 – 18. Florida, Richard. 2005. Cities and the Creative Class. New York: Routledge. Freeman, Linton C. 1978/79. “Centrality in Social Networks: Conceptual Clarification.” Social Networks 1: 215 – 39. Friedmann, John. 1986. “The World City Hypothesis.” Development and Change 17: 69 – 83. Goetz, Andrew R. 1992. “Air Passenger Transportation and Growth in the U.S. Urban System, 1950 – 1987.” Growth and Change 23: 217 – 38. Goetz, Andrew R. and Christpher J. Sutton. 1997. “The Geography of Deregulation in the U.S. Airline Industry.” Annals of the Association of American Geographers 87: 238 – 63. Hall, Peter. 1966. The World Cities. London: Heinemann. Hammer, Carl and Fred Charles Ilké. 1957. “Intercity Telephone and Airline Traffic Related to Distance and the ‘Propensity to Interact’.” Sociometry 20: 306 – 16. Irwin, Michael D. and John D. Kasarda. 1991. “Air Passenger Linkages and Employment Growth in U.S. Metropolitan Areas.” American Sociological Review 56: 524 – 37. Irwin, Michael D. and Holly M. Hughes. 1992. “Centrality and the Structure of Urban Interaction: Measures, Concepts, and Applications.” Social Forces 71: 17 – 51. 44 Ivy, R. L., T. J. Fik, and E. J. Malecki. 1995. “Changes in Air Service Connectivity and Employment.” Environment and Planning A 27: 165 – 79. Keeling, David J. 1995. “Transport and the World City Paradigm.” Pp. 115 – 31 in World Cities in a World-System, edited by Paul L. Knox and Peter J. Taylor. New York: Cambridge University Press. Kotkin, Joel. 2003. “Bye-Bye, Big Apple. Omaha and Orlando are Jumping Now.” The Washington Post, September 7, B1. Lansing, John B., Jung-Chao Liu, and Daniel B. Suits. 1961. “An Analysis of Interurban Air Travel.” Quarterly Journal of Economics 75: 87 – 95. Lieberson, Stanley and Kent. P. Schwirian. 1962. “Banking Functions as an Index of Inter-City Relations.” Journal of Regional Science 4: 69 – 81. Limtanakool, Narisra, Tim Schwanen, and Martin Dijst. 2007. “Ranking Functional Urban Regions: A Comparison of Interaction and Node Attribute Data.” Cities 24: 26 – 42. Markusen, Ann and Vicky Gwiasda. 1993. “Multipolarity and the Layering of Functions in World Cities: New York City’s Struggle to Stay on Top.” International Journal of Urban and Regional Research 18: 167 – 93. Massey, Doreen. 1993. “Power Geometry and a Progressive Sense of Place.” Pp. 59 – 69 in Mapping the Futures: Local Cultures, Global Change, edited by J. Bird, B. Curtis, T. Putnam, G. Robertson, and L. Tickner. London: Routledge. McKenzie, Roderick D. 1933. The Metropolitan Community. New York: McGraw-Hill. Neal, Zachary. 2008a. “From Central Places to Network Bases: A Transition in the US Urban Hierarchy, 1900 – 2000.” Globalization and World Cities Research Bulletin 267. Leicestershire, UK: Loughborough University. –––. 2008b. “The Duality of World Cities and Firms: Comparing Networks, Hierarchies, and Inequalities in the Global Economy.” Global Networks 8: 94 – 115. Nordlund, Carl. 2004. “A Critical Comment on the Taylor Approach for Measuring World City Interlock Linkages.” Geographical Analysis 36: 290 – 96. Pred, Allan R. 1973. Urban Growth and the Circulation of Information: The United States System of Cities, 1790 – 1840. Cambridge, MA: Harvard University Press. Prince of Wales, Geoffrey Salmond, Winston Churchill, Colonel Amery, Earl Haig, and Hugh Trenchard. 1920. “Imperial Air Routes.” The Geographical Journal 55: 263 – 70. Purdue, Lewis. 2002. EroticaBiz: How Sex Shaped the Internet. New York: Writers Club Press. Reed, H. C. 1981. The Pre-Eminance of International Financial Centres. New York: Praeger. Rimmer, Peter J. 1998. “Transport and Telecommunications Among World Cities.” Pp. 433 – 70 in Globalization and the World of Large Cities, edited by Fu-Chen Lo and Yue-Man Yueng. New York: United Nations Press. Robinson, Jennifer. 2002. “Global and World Cities: A View from off the Map.” International Journal of Urban and Regional Research 26: 531 – 54. Ross, Christopher O. 1987. “Organizational Dimensions of Metropolitan Dominance: Prominence in the Network of Corporate Control, 1955 – 1975.” American Sociological Review 52: 258 – 67. Sassen, Saskia. 2001. The Global City: New York, London, Tokyo. Princeton, NJ: Princeton University Press. –––. 2002. “Locating Cities on Global Circuits.” Environment and Urbanization 14: 13 – 30. Short, J. R., Y. Kim, M. Kuus, and H. Wells. 1996. “The Dirty Little Secret of World Cities Research: Data Problems in Comparative Analysis.” International Journal of Urban and Regional Research 20: 697 – 717. Simpson, William. 2001. “QAP: The Quadratic Assignment Procedure.” Paper presented at the North American Stata Users’ Group Meeting, March 2001. Smith, David A. and Michael Timberlake. 1993. “World Cities: A Political Economy/Global Network Approach.” Research in Urban Sociology 3: 181 – 207. –––. 2001. “World City Networks and Hierarchies, 1977 – 1997.” American Behavioral Scientist 44: 1656 – 78. Stewart, John Q. 1948. “Demographic Gravitation: Evidence and Applications.” Sociometry 11:31 – 58. Taaffe, Edward J. 1956. “Air Transportation and United States Urban Distribution.” Geographical Review 46: 219 – 38. Taylor, Peter J. 2001. “Specification of the World City Network.” Geographical Analysis 33: 181 – 94 Taylor, Peter J., Ben Derudder, and Frank Witlox. 2007. “Comparing Airline Passenger Destinations with Global Service Connectivities: A Worldwide Empirical Study of 214 Cities.” Urban Geography 28: 232 – 48. Townsend, Anthony M. 2001. “Network Cities and the Global Structure of the Internet.” American Behavioral Scientist 44: 1697 – 716. Uriely, Natan. 2001. “’Traveling Workers’ and ‘Working Tourists’: Variations across the Interaction between Work and Tourism.” International Journal of Tourism Research 3:1 – 8. US Department of Transportation. 2006. Airline Origin and Destination Survey (DB1B): Coupon and Market Tables. Washington, DC: Bureau of Transportation Statistics. Von Thünen, Johann Heinrich. [1826] 1966. von Thünen’s Isolated State. Translated by Carla M. Wartenburg, Edited by Peter M. Hall. Oxford: Pergamon Press. Walters, A. A. 1978. “Airports – an Economic Survey.” Journal of Transport Economics and Policy 11:125 – 160. Wheeler, James O. and Ronald L. Mitchelson. 1989. “Information Flows among Major Metropolitan Areas in the United States.” Annals of the Association of American Geographers 79: 523 – 43. Wheeler, David C. and Morton E. O’Kelly. 1999. “Network Topology and City Accessibility of the Commercial Internet.” Professional Geographer 51: 327 – 39. Xu, Zengwang, and Robert Harriss. 2008. “Exploring the Structure of the U.S. Intercity Passenger Air Transportation Network: A Weighted Complex Network Approach.” Geojournal 73: 87 – 102. Zook, Matthew A. and Stanley D. Brunn. 2006. “From Podes to Antipodes: Positionalities in Global Airline Geographies.” Annals of the Association of American Geographers 96: 471 – 90. Zipf, George Kingsley. 1946. “The
NOTES* Zachary P. Neal, Department of Sociology, Michigan State University; Email: zpneal@msu.edu 1. Eberstein and Frisbie (1982) and Eberstein and Galle (1984) encounter a similar problem using commodity movements by truck to define a city network. Cities located in the middle of the continent (e.g. Chicago, St. Louis, Houston) invariably appear central, but this is an artifact of their intermediate location in the interstate highway system. 2. Although more sophisticated measures of centrality are available (e.g. closeness, betweenness) and have been used by others in similar contexts (e.g. Smith and Timberlake 2001; Alderson and Beckfield 2004; Neal 2008b), they cannot be computed on networks that capture the volume of intercity exchanges rather than simply their presence or absence. While it is possible to dichotomize valued network data to permit the use of other 3. Because estimates of employment in the highly specific ‘air transportation’ occupation group were unavailable for some smaller areas, this analyses includes only 104 of the 115 metropolitan areas under investigation. 4. Because auxiliary analyses confirmed that ordinary least squares and zero-inflated negative binomial regressions yielded highly correlated predictions (r = .965), for ease of interpretation the simpler ordinary least squares approach was used.
Table 1: Percentage of Total Passengers Remaining in the City
Table 2: Influence of Hub/Spoke and Origin/Destination Centrality on Employment
** p < .01, * p < .05
Table 3: Ratio of Business-related to Leisure-related Flows
Table 4: Influence of Business and Leisure Centrality on Employment
** p < .01, * p < .05
Table 5:. Regression Predicting the Number of Business Exchanges for a Pair of Cities
** p < .01, * p < .05
Table 6: Largest Residuals from Full Model
Figure 1: Comparison of Centrality in Hub/Spoke and Origin/Destination Networks
Figure 2: Comparison of Centrality in Business and Leisure Networks
Figure 3: Influence of Economic Similarity on Business Exchanges
Note: This Research Bulletin has been published in Urban Studies, 47 (10), (2010), 2195-2215 |
|||||||||||||||||||||||||||||||||||||||||||||||||||||||||||||||||||||||||||||||||||||||||||||||||||||||||||||||||||||||||||||||||||||||||||||||||||||||||||||||||||||||||||||||||||||||||||||||||||||||||||||||||||||||
 (3)
(3)