GaWC Research Bulletin 278 |
|
|
|
This Research Bulletin has been published in Town & Country Planning, May 2008, 224-231. Please refer to the published version when quoting the paper.
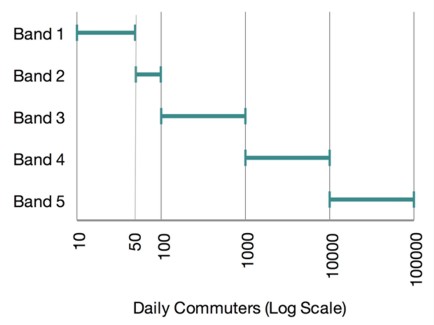
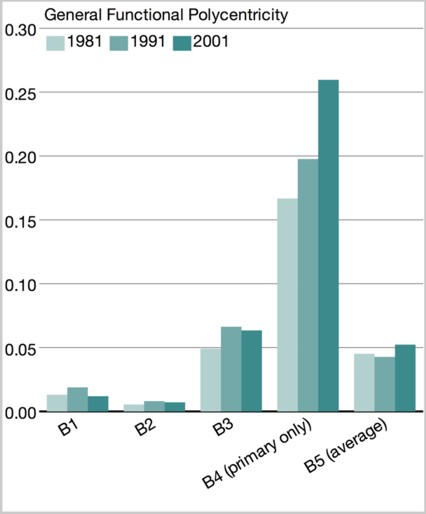
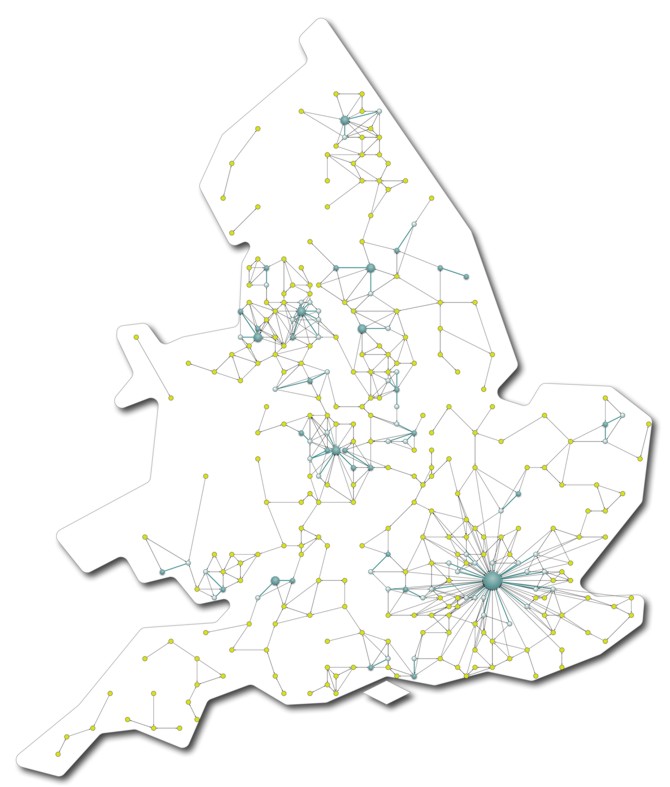
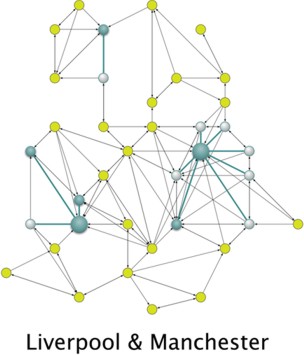
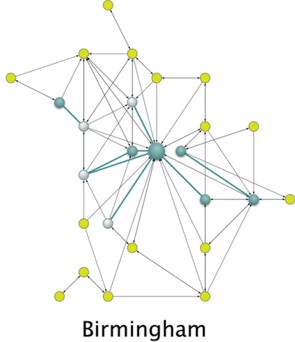
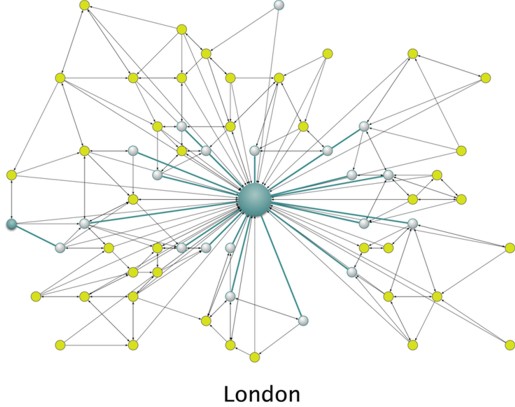
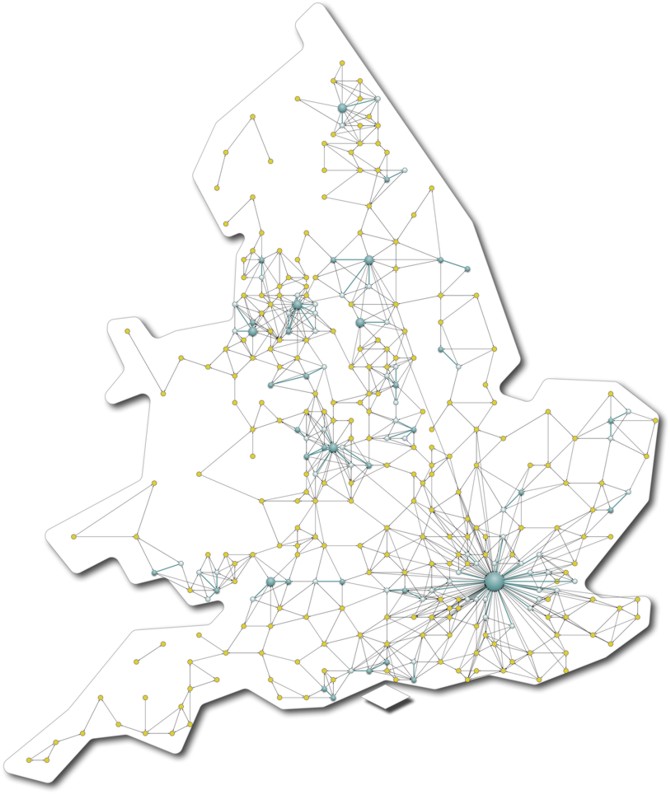
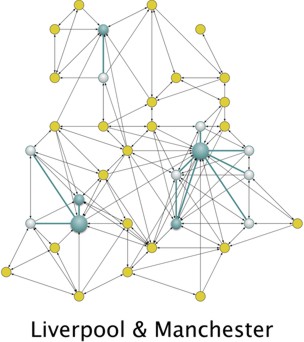
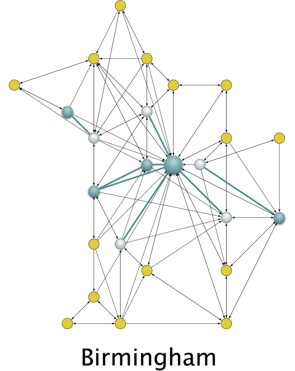
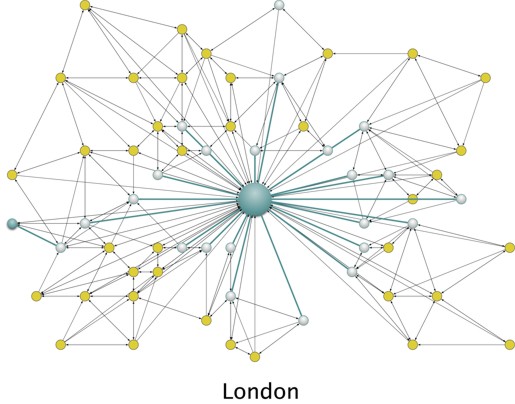
Not quite a decade ago, the late Michael Breheny suggested that the increasing tendency for people both to live and to work at the urban periphery was symptomatic of relatively deep changes in live-work patterns. The wise policy-maker, he said, would be subtle, seeking to bend the trend' rather than reverse it.1,2 A little over half a decade ago, Michael Batty argued using computer simulations that a polynucleated urban landscape could be expected to arise spontaneously as a consequence of the relentless positive feedback carving out an urban pattern slowly over time, just as slowly meandering rivers carve out a landscape through an inexorable process of erosion. Batty borrowed a phrase from George Holmes' The Oxford History of Medieval Europe deeper continuity' and argued that such a process had played little part in the theory of cities in the latter half of the twentieth century.3 These two approaches, one purely theoretical (Batty), the other based on workshops and interviews (Breheny), lead us in the same direction, a direction all but confirmed in the recent State of the English Cities report:4 that we can expect live-work patterns to become more dispersed over time; that these changes are a consequence of deep undercurrents; and that the consequence is that this gradual dispersal is not something that will easily be reversed. State of the English Cities also reports that large cities are losing population as smaller cities gain population,4 a statistic pointing to dispersal. However, the rate of population decline in the large cities is itself declining, and so is the rate of population growth in the smaller cities. This suggests that the larger cities are turning things around, and State of the English Cities does indeed note the recovery of the larger cities. Clearly, something is going on; something significant and cross-regional. It is, in short, an issue for this island. FUNCTIONAL POLYCENTRICITYCensus data from 1981, 1991 and 2001 enable us to visualise the way in which these theories have played themselves out in practice. The work reported here used Census data to examine commuting between districts in England and Wales and explored the extent and nature of changes to the commuting networks of England and Wales using recently developed methods for calculating functional polycentricity, a brief description of which follows. Functional polycentricity is a mathematical index of how densely connected and how balanced is a network of nodes connected by a particular function.5 Nodes can be businesses, individuals, geographical areas such as districts, regions or even nation states, or some other actor'. The functional connection may be commuting, financial transactions, or business acquaintances, and any given network will have one type of node and one type of function. In the examples presented here, the nodes are geographical areas (districts) and the general function is commuting. Commuting is, of course, directional and has two components: commuting into a district (in-commuting) and commuting out of a district (out-commuting). Each of these components is considered to be a specific function for our purposes. The basic principle is to combine the density of the network how many connections there are, divided by the maximum number of possible connections with how balanced that network is. An example of a very unbalanced network would be one in which all but a single node are connected to that single node (a node cannot connect to itself for our purposes), like a star. An example of a balanced network would be three nodes connected up to form a triangle. As presented here, there are two types of functional polycentricity. Special functional polycentricity is calculated for a network having a single specific function, such as in-commuting or out-commuting. General functional polycentricity is calculated for several networks having different functions. In this article, those two functions will be in-commuting and out-commuting, but we shall discuss commuting in general, and use indices of general functional polycentricity. The recent POLYNET project6 found that functional polycentricity of commuting networks varies depending on the scale of the commuting flows in question. Between any given pair of places there will be a certain number of people who commute to work each day this is the flow' of commuters. In the case of a large town and nearby surrounding villages, we would expect that some of those living in each of the villages might commute daily to the town, and perhaps that a few of those who live in the town might commute to each of the villages. It is probably also the case that there are those who live in one village and commute to another. Lastly, it will probably be the case that the numbers of people commuting from each village to the town will be much greater than the numbers of people commuting either from town to village or from village to village. In this example we therefore have two commuting networks, one of which comprises relatively large flows from village to town, the other comprising relatively small flows either from town to village, or from village to village. To enable us to explore these different sizes of commuter flow, we can split the flows into bands'. In the example above, we may have two bands: one of from 5 to 50 people per day to capture the smaller flows; and a second band of above 50 people per day to capture the larger flows. We could then set out two networks, one showing smaller flows, the other the larger flows. In the work presented here, we use five different bands, varying from small daily flows of between 10 and 50 people, to very large daily flows of between 10,000 and 100,00 (see Fig. 1). We have calculated and mapped indices of general functional polycentricity for in-commuting and out-commuting for each of these five bands for the years 1981, 1991 and 2001 (see Fig. 2). Secondly, we have produced network cartograms' showing the two highest levels of commuter flow, bands 4 and 5, for 1981 and 2001 (shown in Figs 3 and 4). Lastly, we have produced a diagram outlining those areas on the band 4 cartogram where the commuting networks appear to be relatively dense, on which is superimposed current regional boundaries (shown in Fig. 5). AND THE POINT IS...Current English regions reflect the functional realities of England and Wales reasonably accurately for the most part, but there are anomalies that need closer attention. There are also reasons to believe that the general structure of the commuting networks suggests that we are shifting towards a resurgence of the city-state, at least in economic terms. Such a change should not surprise us. The city-state is neither new nor unusual. Pre-Columbian Meso-American society was constructed around city-states, as was ancient Greece. The demise of the city-state came with the rise of industrial society, and as we move to a post-industrial city that does not need to be structured around the requirements of manufacturing industry, perhaps we should not be too surprised that the familiar urban landscape that co-evolved with industry should change too. One could say that it may merely be reverting to type. Evidence for such an assertion can be found by examining the two network cartograms more closely. Each contains band four (1000-10,000 people) and band five (10,000-100,000 people) commuting networks, showing both origins and destinations. For the legibility purposes, each is accompanied by three insets', which are simply enlarged versions of those parts of the network that are densest, and therefore hardest to read. When we look at these networks we see:
If we now look at the 1981 network and compare it with the 2001 network we see that:
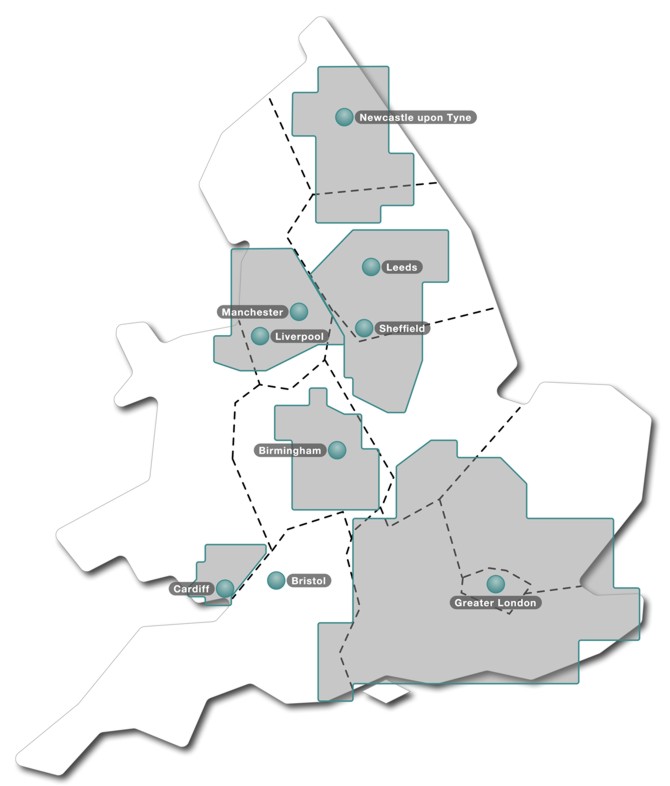
It would be correct to conclude from this that England and Wales are becoming more connected, and that they are also becoming more functionally polycentric. The bar chart of functional polycentricity (Fig. 2) shows that this is indeed the case. The dense band 4 networks are particularly interesting, since we can sketch in the boundaries of where density falls off, and compare these boundaries with the current regional boundaries. Fig. 5 shows this for 2001. What we see here is that for the most part the regional boundaries match the network density boundaries reasonably closely, with five notable exceptions:
Clusters similar to these have also been identified elsewhere.7 What is notable is also unsurprising: The clusters show little respect for administrative boundaries, be they regional or national a simple fact that once again alerts us to the need to look at the evidence. Here, the evidence tells us that the regions as they currently exist mostly make sense, but that we should not lose sight of what lies across the boundary. We can also see from the band 4 networks that England and Wales are functionally a single entity, with relatively clear concentrations of commuting around some of the larger cities, roughly reflecting the pattern of regional boundaries. And as places become increasingly connected to one another, at least in terms of commuting, so the island itself can be seen as a hugely interconnected whole. The band 5 networks are less interesting, reflecting as they do a mostly monocentric commuting structure at this scale. But even here, at a scale where large cities might be expected to be absolutely dominant, we can see from the graph in Fig. 2 that polycentricity is increasing, albeit much more slowly than that the level of band 4. Besides the fact that the number of band 5 networks has increased (see Fig. 6) we can also see that, in some instances, what were one-way flows in 1981 have become two-way flows by 2001 (Figs 3 and 4). To summarise so far:
In short, England and Wales as a whole is becoming more polycentric, but it is also becoming increasingly dominated by large city-regions that, in functional terms, look increasingly like embryonic city-states. If this is indeed the case, then it raises some vital policy issues. One in particular stands out: if cities do become more powerful, how can we keep things together? CITY-STATES AND THE SPATIAL IN-BETWEENThere is a sense in which strategic spatial planning in England and Wales is pursued at scales that do not fully reflect the way in which England and Wales function, at least in terms of commuting. This is inevitable. No single system can hope to fully embrace the subtleties with which we are dealing, but we need to be alert both to what the most appropriate scales for developing strategy are, and to the anomalies that will inevitably dog whatever scales are eventually chosen. If you look again at Fig. 5 you see, crudely, a lumpy archipelago of city-states in what is in effect an overcrowded peri-urban sea. This, the spatial in-between, is a problem of post-industrial spatial planning on this island, as Ravetz pointed out seven years ago in City-Region 2020,8 and as was identified as a significant issue nearly four decades ago by the Redcliffe-Maud Commission on Local Government.9 Post-industrial? Perhaps it would make more sense to call it a non-industrial form of spatial-political distribution rather than a post-industrial one. Based around the notion of the city-state, such political divisions pre-date the notion of the nation state and, for that matter, the region. As noted above, we should not be too surprised that now that the UK's economy does not rely on manufacturing industry, its spatial form should change to reflect that. But this does not make things easy. The city-states themselves can and should be nudged in the general direction of the ideal of Howard's original Social City,10 or Hall and Ward's Sociable City,11 but this still leaves the issue of the peri-urban areas and, closely connected to this, cross-boundary regional issues. As Tim Marshall argued in a previous issue of this journal, the system is not actually broken, even if it is not perfect.12 The regions themselves are good enough' to be worth keeping. They do on the whole reflect what we have called city-states', anomalies notwithstanding. And the current system of regions, flawed though it may be, is at least one that people understand. It also has a certain historical provenance around which both public and private bodies have built expansive institutional eco-systems, the dismantling of which would probably do more harm than good. What is most obviously missing despite being delineated by the least controversial, least negotiable boundary of all, the coastline is a national spatial strategy to bring these issues together, a point already made by the TCPA in its recent report Connecting England.13 Planning at a national scale makes complete sense for what is after all a small, densely populated island. Lastly, there is far more to a national spatial strategy than a crude infrastructure framework. The point of looking at things nationally is to see the whole picture, a picture whose natural frame is in this case the coastline. Such an overview would provide the context without which the current regional approach is in effect crippled. This is particularly the case with regard to those issues that cross regional boundaries, as it is with regard to the tracts of space between these embryonic city-states'. The trend is clear enough and it may take us in unwelcome directions. And admittedly, a national spatial strategy won't solve every problem that arises. But it might at least stop us from getting hopelessly lost.
NOTES* Dr Nick Green is a Research Associate in the Centre for Urban and Regional Ecology at the University of Manchester and a member of the TCPA Policy Council. The views expressed here are personal. 1. M. Breheny (Ed.): The People: Where Will They Work? Town and Country Planning Association, 1997 2. M. Breheny and P. Hall: The People: Where Will They Live? Town and Country Planning Association, 1999 3. M. Batty: Polynucleated urban landscapes'. Urban Studies, 2001, Vol. 38 (4) 4. M. Parkinson, A. G. Champion, J. Simmie, I. Turok, M. Crookston and A. Park: State of the English Cities. Two Volumes. Office of the Deputy Prime Minister, 2006 5. For a full description, see N. Green: Functional polycentricity: a definition in terms of social network analysis'. Urban Studies, 2007, Vol. 44 (10) 6. P. Hall and K. Pain (Eds): The Polycentric Metropolis: Learning from Mega-City Regions in Europe. Earthscan, 2006 7. See, for example, C. Wong, A. Schulze Bäing and A. Rae: Uniting Britain: The Evidence Base Spatial Structure and Key Drivers. Royal Town Planning Institute, 2006 8. J. Ravetz: City Region 2020: Integrated Planning for a Sustainable Environment. Earthscan, 2000 9. P. Hall: The Containment of Urban England. Wiedenfeld & Nicolson, 1973 10. E. Howard: To-Morrow: A Peaceful Path to Real Reform. Swan Sonnenschein, 1898 11. P. Hall and C. Ward: Sociable Cities: The Legacy of Ebenezer Howard. John Wiley, 1998 12. T. Marshall: It works, so let's change it...'. Town & Country Planning, 2007, Vol. 76 (9), Sept., 296-8 13. Connecting England: A Framework for Regional Development. Final Report of the TCPA-Appointed Hetherington Commission on the Future Development Needs and Priorities of England. TCPA, 2006 14. Web Interface to Census Interaction Data. Census Interaction Data Service, 2005. http://census.ac.uk/cids/
Figure 1: Commuting bands
Figure 2: General functional polycentricity for all five commuting bands for the years 1981, 1991 and 2001
Although the theoretical limits of general functional polycentricity are 0 (complete monocentricity) and 1 (complete polycentricity), real-world values can be expected to fall between 0.001 and 0.3. Higher values of are indicative of a network that is both balanced and dense; lower values are indicative of a network that is either unbalanced, or not dense or both. Here, bands 1, 2 and 3 are quite balanced, but not at all dense, and so have low general functional polycentricity indices, whereas band 5 networks are unbalanced, but have relatively high densities owing to the high commuting flows. Band 4 values are for the primary' (i.e. largest) network. Band 5 values are averages of all band 5 network values. See text for an explanation of terms.
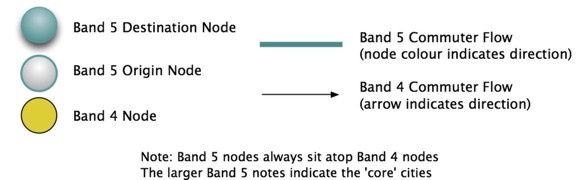
Legend for Figures 3 and 4
Figure 3: Network cartogram showing 1981 band 4 and band 5 networks for England and Wales
Nodes indicate the UK district; lines never connect to other lines; lines may run under a node; insets are purely to make the densest parts of the network easier to read
Figure 4: Network cartogram showing 2001 band 4 and band 5 networks for England and Wales
Nodes indicate the UK district; lines never connect to other lines; lines may run under a node; insets are purely to make the densest parts of the network easier to read
Figure 5: Dense band 4 (1,000-10,000) networks and current regional boundaries
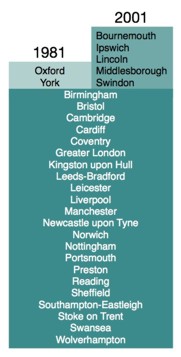
Figure 6: Band 5 networks listed by main district, 1981 and 2001
Edited and posted on the web on 1st August 2008
Note: This Research Bulletin has been published in Town & Country Planning, May 2008, 224-231 |
||