GaWC Research Bulletin 268 |
|
|
|
This Research Bulletin has been published in Regional Studies, 44 (9), (2010), 1149-1170. Please refer to the published version when quoting the paper.
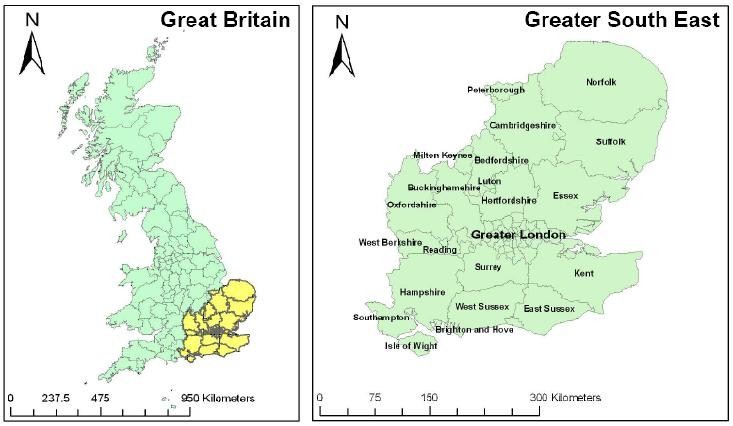
IntroductionRegional planners in the Netherlands, Belgium, Germany, and the United Kingdom increasingly view the development of urban networks as a method to stimulate local and regional economic development and growth (MEIJERS, 2005; HALL and PAIN, 2006). The concept has also been embraced by the EU ministers for spatial and regional planning (CSD, 1999)1. In particular, urban networks are promoted as methods that take advantage of positive externalities associated with large agglomerations, such as an enlarged labour market and major facilities like air- and seaports, while avoiding the negative externalities of urban sprawl and congestion (BAILEY and TUROK, 2001; PARR, 2004). In addition, the city and its surrounding region, is hypothesised to emerge as the new loci of international territorial competition (ROMEIN, 2004). The latter enhances the desire of policymakers to promote their city-regions as one entity, in order to position them more strongly at the international stage (MEIJERS, 2005). In the United Kingdom, the Greater South East – known as the conurbation around the city of London and extending from Porthsmouth to Peterborough (see Figure 1) – is perceived as a mega-city region which is increasingly evolving into an urban network (HALL et al., 2006; ALLEN and COCHRANE, 2007; PAIN, 2008). Figure 1: The Greater South East UK
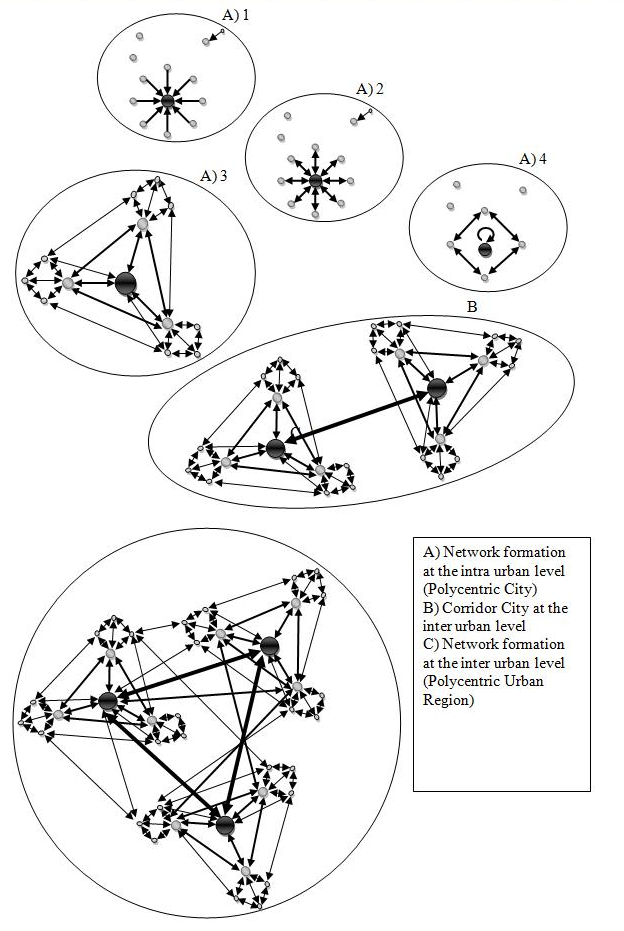
The debate on urban networks is fuelled by a larger literature on the changing spatial organization of cities at the intra-urban and inter-urban scales (BATTEN, 1995; KLOOSTERMAN and MUSTERD, 2001). In this literature, it is often argued that recent advances in transport and communication technology, the increasing connectivity of economies worldwide (globalisation), and the individualisation of production have had a significant impact on the spatial configuration of urban regions. At the local or metropolitan intra-urban scale, cities are developing from a monocentric urban city towards a more polycentric urban configuration. The traditional city has a strict city-hinterland separation, with a city center creating demand for labour and surrounding suburban areas providing the labour force (BURGESS, 1925). However, it is conjectured that suburban areas increasingly emerge into local centers that develop their own economic activities. Consequently, these ‘new’ local centers start competing with the original urban core (GARREAU, 1991). Concurrently , the geographical scope of social and economic processes (such as commuting, inter-firm relations, and business to consumer relations) is continuously increasing (VAN DER LAAN, 1998; FRANDBERG and VILHELMSON, 2003; URRY, 2004). The latter results in an increasingly complex formation of functional linkages between historically separated urban regions at the regional inter-urban scale. Hence, it is often argued that the traditional central place conceptualisation of urban systems, characterised by local urban hierarchies, is outdated and should be replaced by a regional urban network view that emphasises the criss-crossing pattern of interdependencies between spatial units at the intra-urban (local) and inter-urban (regional) scales (KLOOSTERMAN and MUSTERD, 2001). Academic literature and policy documents on urban networks are rich in their analytical descriptions of polycentric regions and urban networks. However, only a few empirical studies have quantitatively assessed how well the urban network model fits the reality of contemporary urban systems (DAVOUDI, 2003). Moreover, these studies suffer from two major difficulties. First, most of the available empirical evidence is based on node characteristics. Consequently, researchers use methods such as location quotients, rank-size relations, sufficiency indices, and employment-to-work ratios, rather than methods based on flow characteristics (LIMTANAKOOL et al., 2007). This is partly due to a lack of data regarding the network between cities. However, the focus on node characteristics is unsatisfactory in that it can only yield a proxy of spatial interaction; it cannot account for the actual structure of urban systems (IRWIN and HUGHES, 1992; SOHN, 2004). The existence of multiple centres in close proximity to each other does not necessarily mean that there are strong functional linkages between these centres (LAMBOOY, 1998; ALBRECHTS, 2001). Indeed, most of the theoretical foundations for the central place and urban network model are based on flows linked to the physical movement of goods, people and services (HALL, 2001; LIMTANAKOOL et al., 2007). Hence, polycentrism will be addressed in this article by looking at functional networks between cities, rather than by looking at the mere existence of multiple centres within one area (see MEIJERS, 2008) . As such, the term ‘(functional) polycentrism’ in the remainder of this article is synonymous with ‘urban network integration’.2 Second, the few studies on the configuration of urban systems using flow characteristics (see e.g., VAN DER LAAN, 1998; HALL and GREEN, 2005; VAN OORT et al., 2009) have predominantly assessed the central place model versus the network model at one point in time. Notable exceptions are recent studies by NIELSEN and HOVGESEN (2008) and LIMTANAKOOL et al. (2009). As a consequence, the ways in which the present situation is changing remain ambiguous. As BERTAUD (2004) rightly notes, cities are not born polycentric, they only evolve in that direction. Instead, a dynamic model based on flow characteristics would be a more accurate test of the existence and functioning of urban networks, while allowing for an investigation into the evolution of the structure of the urban system over time.3 The main contribution of this paper is to overcome some of the aforementioned limitations by providing an empirical assessment of changing urban systems, using flow data on commuting and looking at urban network development over time. Building on the POLYNET research outlined in HALL and PAIN (2006) and CATTAN (2007), the focus in this work is on urban network development in the Greater South East UK in the period 1981-2001. The representation of the Greater South East as an urban network is based on the assumption of a considerable regional cohesion in personal, occupational and corporate relationships of people, organizations and firms that transcends the boundaries of traditional metropolitan areas. Commuting patterns are useful data when investigating the development of urban networks, as journey-to-work trips constitute the majority of all trips, both at the inter- and intra-urban scales (WHITE, 1988; CLARK and KUIJPERS-LINDE, 1994) . The remainder of this paper is organised as follows. The next Section provides an overview of the theory on the evolution of the urban system in relation to economic and social changes. In Section 3, the case-study, the dataset, and research methods are introduced and an empirical model is employed to test the validity of the urban network concept. Section 4 contains an overview of the main empirical results, followed by a Discussion and Conclusion in Section 5. THE DYNAMICS OF URBAN SYSTEMSUrban systems are in constant flux. This section aims to give a brief overview of the literature on changing urban systems at the intra-urban and inter-urban levels. Specifically, the literature on how urban systems change and, what developments are driving these changes, is covered. In particular, attention is given to changing urban systems with respect to commuting in the Greater South East UK. From a Monocentric City to a Polycentric RegionIn urban systems theory, introduced by BERRY (1964) and PRED (1977), urban systems are generally referred to as functionally interdependent sets of cities. However, the structure of these urban systems can range from fully monocentric to fully polycentric. Also, the dominant structure can differ at various spatial scales (BATTEN, 1995). Yet,the traditional starting point for a treatment of the theory on urban systems is Burgess’ concept of the monocentric city (BURGESS, 1925), later extended by ALONSO (1964) and MUTH (1961). The concept of the monocentric city involves a central unit, the central business district (CBD), surrounded by a circular residential area whereby land is allocated according to its most profitable use. The general idea of the monocentric city is that most economic activities are based in the urban core, whereas suburbs only fulfill a residential function. Hence, the relationship between the urban core and its suburbs in the monocentric model is hierarchical-nodal or centralized in the sense that relatively speaking most commuting flows are directed from the suburban areas towards the central cities. A graphical representation of this idea is given in Figure 2-A1. However, the conceptualisation of urban systems as monocentric city regions is becoming increasingly problematic (CLARK and KUIJPERS-LINDE, 1993; KLOOSTERMAN and MUSTERD, 2001; MEIJERS, 2007). For a variety of reasons (i.e., cheaper land, a low level of amenities in the city centre, decreasing transportation costs), firms and households may increasingly choose to locate themselves in secondary employment centres, despite the advantages of the central city. As a result, suburban areas are emerging into local centres that develop their own economic activities and gradually become incorporated into an expanded but coherent metropolitan area (ANAS et al., 1998). The result is the development of cities with multiple centres, or polycentric cities, at the intra-urban scale (see Figure 2-A2) (KLOOSTERMAN and MUSTERD, 2001). In such a polycentric city, commuting is no longer centralized, but reciprocal in the sense that commuting is now not only directed from the suburbs to the urban core, but also from the urban core to the suburbs. In transport geography this phenomenon is better known as exchange commuting, while CHAMPION (1989) denotes this development as counter-urbanization. Figure 2: Urban Network development on the intra- and inter-urban scales (adapted from VAN DER KNAAP 2002; SCHWANEN et al. 2004)
Moreover, the suburbs become increasingly self-contained in the sense that many suburban residents are employed in the suburban area in which they live. These sub-centres may grow in importance over time, as people start relocating to these sub-centres in order to follow their employer, or for the benefit of cheaper land (VAN DER LAAN, 1998). As such, a territorial competition emerges between the original core and the new sub-centres, changing the image of the city to a network-city proper, as displayed in Figure 2-A3. In this situation, the central city has lost its pure primacy. Flows of goods, services and people become decentralized as the number of workers commuting between suburbs and bypassing the old urban core increases. Hence, in this state the functioning of the metropolitan area is not only dependent on the CBD but also on the functioning of its surrounding suburbs. In fact, one location may be regarded as ‘central’ in terms of one particular function, while other places might be central in terms of different functions. Finally, there is a third type of polycentric city region, which consists of multiple, self-contained centres (see Figure 2-A4); many suburban residents are employed in the suburbs and many urban residents are employed in the urban core (SCHWANEN et al., 2004). In this fashion, transportation costs are minimised. However, according to BERTAUD (2004), such polycentric urban structure, in which there is only network formation between the suburbs, is a utopian planning concept only and is hardly observed in reality. The focus of the contemporary debate on changing urban systems has increasingly shifted from the intra-urban scale to the inter-urban scale (KLOOSTERMAN and MUSTERD, 2001).4 Due to further advances in transportation and communication technologies, it is expected that significant functional linkages are formed at increasingly higher levels of scale than those of the ‘traditional’ city (VAN OORT et al., 2009). As a result, the catchment areas of different cities start to overlap. Metropolitan areas lose significance as an independently functioning ‘ daily urban system’ and could, instead, be perceived as forming part of an urban network. Much of the current literature is focused on this development; that is, the development of the Polycentric Urban Region (PUR). The PUR can be represented as an urban network of historically and spatially separate metropolitan areas comprising a region (see Figures 2 B and C) (BOURNE and SIMMONS, 1978; PARR, 2004). These metropolitan areas can be network-cities themselves, but this is not necessarily the case (i.e., the Urban System can be dominated by a polycentric structure at the inter-urban level and a monocentric structure at the intra-urban level or vice versa). Likewise, urban network formation at the inter-urban scale is not necessarily the next evolutionary step after the network-city (PARR, 2004). The degree of urban network formation differs between various polycentric urban regions. First, the distinction between nodalurban networks and fullyintegrated urban networks is important. Nodal urban networks (Figure 2-B; e.g., BATTEN, 1995) are characterized by urban network formation between the old urban cores of different metropolitan areas. In contrast, fully integrated urban networks also have functional linkages between 1) the suburbs and urban cores of different metropolitan areas, and 2) suburbs of different metropolitan areas (see Figure 2-C). Secondly, at the inter-urban level the urban spatial structure can be characterized either as centralized, exchange, or decentralized, depending on the existence or non-existence of a regional hierarchy of the different metropolitan relations. In the fourth section of this paper, we introduce formal tests for this. The Driving Forces behind Changing Urban SystemsBefore setting the specific conditions under which an urban system can be characterized as a polycentric urban region (section 3), a brief overview of the drivers behind changing urban systems is provided. The reasons given in the literature for changing urban systems can be broadly grouped under three different headers: the increased spatial mobility and flexibility of firms, the increased spatial mobility and flexibility of households and local and regional policies. 1. Increased Flexibility and Mobility of Firms The effect of increasing flexibility and mobility of firms on the urban system is known as the restructuring hypothesis. The central theme of the restructuring hypothesis is that trends in urban system dynamics are driven by changes in the spatial distribution of employment opportunities (RENKOW and HOOVER, 2000). These changes in the spatial distribution of employment opportunities are both caused and made possible by key advancements in information and communication technology (ICT) and are enhanced by the economic change of most western economies from being dominated by production to being dominated by services (AOYAMA and CASTELLS, 2002). There is a considerable academic debate on the precise spatial and economic effects of ICT. Some authors predict that developed economies will make a complete shift to a services and information economy, unbounded by physical distance, leading to a complete spatial disintegration of the economy (GILLESPIE and WILLIAMS, 1988; CAIRNCROSS, 1997). Other authors claim that ICT can be well integrated in production economies and physical goods are still bounded by physical distance despite vast improvements in transport technologies (CASTELLS, 2000). Moreover, service firms are also physically constrained by the necessity of face-to-face contact, usually locationally bounded to the ‘old’ CBD (COUCLELIS, 2000). As such, the old cores maintain strong contacts with the suburban areas, creating an ever more complex integrated urban network (GEYER, 2002). 2. Increased Flexibility and Mobility of Households The effect of increasing flexibility and mobility of people on the urban system is also known as the deconcentration hypothesis. The deconcentration hypothesis holds that urban system dynamics are the result of widespread changes in residential preferences (RENKOW and HOOVER, 2000). Where the increasing flexibility of firms has changed the nature of the demand for labour, the same advances in transport and communication technologies changed the nature of the supply of labour too (CLARK and KUIJPERS-LINDE 1994; VAN DER LAAN 1998). To some extent, these residential preferences are influenced by enhanced mobility and the increasingly flexible workplace (HALL, 2001). Even more profound are the changes in residential preferences, caused by developments within the demography of most developed economies; which have an impact on the urban structure through their effect on the choices of lifestyle and attitudes of households (CHAMPION, 2002).The full realm of the demographic changes mentioned are well summarized by HALL and WHITE (1995) and include the locational preferences of two-earner households, the increasing number of women working, a higher life expectancy, a markedly lower fertility, and an increasing number of single person households. The common factor in these demographic developments is that they have changed the residential wishes of large groups of people, changing residential patterns and causing disorder to the traditional monocentric urban system (VAN HAM, 2002). 3. Local and Regional Policy Local and regional policies can have the explicit intention of economic deconcentration and urban network formation, most commonly an unintended by-product. A well-known example of an intentional policy towards economic deconcentration was the ‘growth pole concept’ introduced by PERROUX (1955). The aim of this policy was to create economic development in peripheral areas by moving (semi-) governmental departments to, or by encouraging the establishment of industrial growth centres in, the periphery. Ultimately, this should have led to the development of the hinterlands of these growth centres, in turn spreading the benefits of economic development over a larger area. Similarly, by embracing the urban network concept, policymakers and urban planners attempt to actively develop suburban areas, with the objective of spreading economic prosperity. ROMEIN (2004) states that a regional urban network perspective of planning where cities and communities actively work together, will strengthen the territorial competitiveness of these systems. However, CAPELLO (2000) states planners should not automatically assume that cooperation within regional urban networks stimulates growth in each participating city. Paradoxically, it is suggested that those policies with urban network formation as an unintended by-product are the most efficient. In particular, restrictions on urban development have had a profound impact on the development of the urban structure (CULLINGWORTH and NADIN, 1997). Governments of many countries have introduced strict land-planning policies, mainly aimed against urban sprawl. The Town and Country Planning Act of 1947 in the United Kingdom is perhaps one of the best examples of such land-planning policies (BEST, 1981). Better known as the Abercrombie Plan, the core of this particular planning act was the formation of a ‘Green Belt’ around London and several smaller cities in the countryside, whereby new construction was only possible within the set city boundary, or at other designated key settlements (CHAMPION, 2002). It is apparent that the economic pressures on cities like London to grow did not stop after these laws were implemented. Consequently, much of the population and employment growth has been restricted to settlements beyond the Green Belt (LONGLEY et al., 1992). These settlements have maintained a very strong link with the original core, and combined with the developments previously mentioned; this has resulted in the development of polycentric urban regions. URBAN NETWORK FORMATION IN THE GREATER SOUTH EAST UKThe Greater South East as Policy InitiativeResearchers and policymakers increasingly identify the Greater South East in the UK as an integrated urban network. HALL (2006) states that the Greater South East region of England is a prime example of a “global mega-city region” in the same fashion as Jean Gottman’s Megalopolis on the north-eastern seaboard of the United States (GOTTMANN, 1961). The agglomeration (see Figure 1), which comprises the three Governmental Office regions of London, South East and East of England5, has about 21 million inhabitants and generates an annual GDP of 898 billion USD. The concept of the Greater South East features prominently among the British Regional Development Agencies (RDA), who have used the title to cooperate on several issues (e.g., the 2012 Olympic Games) (SEEDA, 2005). The development of the Greater South East occurred as described above: London needed locations for its expanding activities, the Green Belt policy ensured that the population and employment growth leapfrogged across the belt, and a well-developed transport network, together with technological advances, facilitated commuting and the mobility of firms (GORDON, 2004; HALL and GREEN, 2006). An interesting question arising herein is; what are the dynamics of the urban configuration of the Greater South East. Given the size of London, one would perhaps automatically assume that the Greater South East is a prime example of a monocentric region. However, HALL (2006) states that London, unlike other city-regions, should be characterised in a functional polycentric way, rather than in a morphologically polycentric way. Indeed, a region may geographically consist of more than one centre. However, this in itself does not constitute social and economic interaction between firms and people residing in them (LAMBOOY, 1998; ALBRECHTS, 2001; MEIJERS, 2008). HALL and GREEN (2006) and HALL and PAIN (2006) both state that South East England has only limited functional relations that are not related to London (p.126). This suggests a relatively high degree of complementarity amongst centres, especially compared to other polycentric regions in Europe (e.g., the Rhein-Ruhr region in Germany and Randstad Holland in the Netherlands). Results from recent research on data from the EU Communication Innovation Survey offer support for this conjecture. SIMMIE et al. (2002) found that the innovative capacity of the Greater South East is well above the EU average but that this is largely due to high concentrations of innovative activity outside London (e.g., Cambridge, Oxford). Yet, the crucial assets on which the companies in these concentrations rely (i.e., finance and skilled labour), tend to originate from organisations and institutions located on the regional, rather than the local, scale. Likewise, PAIN (2008) reports a high degree of interaction between different offices of advanced producer services firms in the Greater South East. These intra-firm network relationships vary from formal meetings to joint working and inter-office support. UK policymakers seem quicker than most researchers to embrace the idea of the Greater South East as a polycentric urban region. The East of England Development Agency states that ‘it is clearer than ever that the East of England doesn’t stand alone. Instead it is part of a highly integrated Greater South East’ (FINCH and MARSHALL, 2007). Likewise, the South East Development Agency identifies 21 towns and cities creating a network of centres of economic activity (SEEDA, 2006). A whole array of different local and regional initiatives has been employed to promote the Greater South East as an integrated polycentric region (ALLEN and COCHRANE, 2007; ODPM, 2003). These growth sub-regions, for instance the London-Stansted-Cambridge-Peterborough corridor, cut across the official regional boundaries promoting the integration of the Greater South East Region (see Table 1 for a summary of the different GSE growth centres and corridors proposed by different agencies). The Regional Development Agencies (RDA) of the three GORs also recently published a joint study titled “ The UK’s engine for growth and prosperity: A case for targeted investment in the Greater South East ” (SEEDA, 2005). In addition, the boards of the three different RDAs have decided to intensify their communication with each other and have started an annual Greater South East RDA boards meeting (LDA, 2007). Table 1: Growth Centres and Gateways in the Greater South East
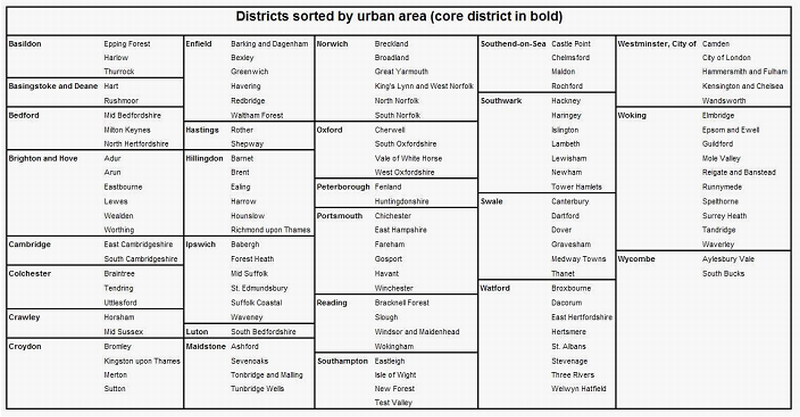
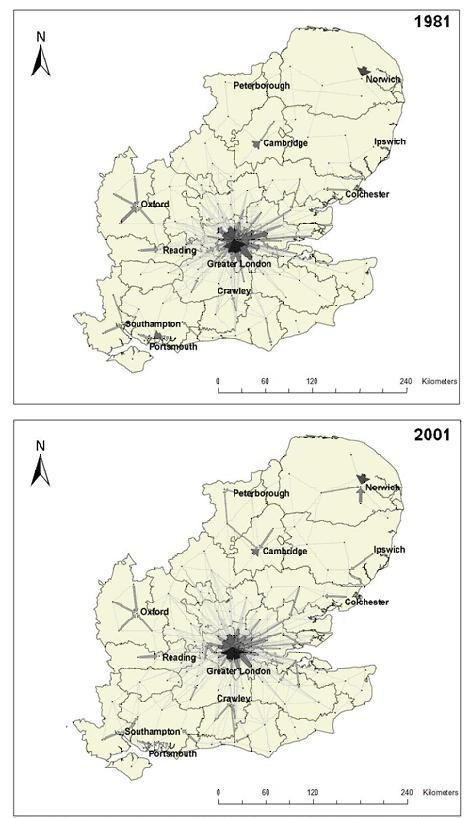
Visualising Commuting Linkages in the Greater South East Region Increasingly, research on urban systems shifts from the physical appearance of a city-region (morphological polycentricity) to functional flow characteristics between nodes in an urban system, as in the contemporary economy the dominance of cities is primarily determined by ‘what flows through them instead of what is fixed within them’ (LIMTANAKOOL et al., 2007). Focusing on linkages rather than nodes also facilitates the policy debate concentrated on the spatial integration of regions. For the analysis of the development of spatial linkages in the Greater South East, commuting interaction data between districts for the past twenty years (1981, 1991, and 2001) were used. These data were obtained from the Special Workplace Statistics (Set C) in the British census.6 The ‘CIDS 1991/2001 common geography’ was used to avoid potential problems with the changes of district-boundaries over the past twenty years (BOYLE and FENG, 2001). Using the common geography, the Greater South East can be divided into urban areas; the urban area here is a slightly adapted version of the conventional NUTS III definition (see Appendix A). Using these boundaries, there are a total of 146 districts in the Greater South East that account for 27 Urban Areas, each with 1 core-district (see Appendix B for more details). Figure 3 depicts the net commuting flows in 1981 and 2001 (flows above 50). Despite the obvious absolute increase in commuting numbers over the investigated twenty-year period, the relative net flows indicate that people still commute within their own urban region. Moreover, the commuting intensity between urban areas is primarily directed towards the London region, creating a hub-and-spoke system. In fact, there appears to be little activity between urban regions located in the Southeast England and East of England regions. Apart from changing local intensities (e.g., increasing around Norwich and Crawley and decreasing around Oxford and Portsmouth), no major changes in the period 1981-2001 can be visually observed from the plotted commuting data. Hence, at first sight, the data give little evidence for the existence of an urban network and the development of such a network over time. However, an obvious criticism of such a visual analysis is that it does not allow for differences in the absolute sizes of districts (in terms of population) and the physical distances between them. GREEN (2007) and HALL and PAIN (2006) did not address this issue the POLYNET research framework. For example, the London area is relatively small and densely populated. Probably, the large number of commuters within the London area is largely due to the large population of London, compared to other areas in the Greater South East, and the relatively small road distances and travel times compared to distances between other urban regions. Put more formally, the likelihood of a commuting flow directed to a large city with many jobs is larger than one directed to a smaller district with fewer jobs. Likewise, the likelihood of a commuting flow between two districts in close proximity to each other is larger than one between districts located far from each other (VAN OORT et al., 2009). FINGLETON (2003) states correctly that all locations and regions in the modern economy interact to some extent. Therefore, it is impossible to make robust inferences about (the development of) the urban system in the Greater South East simply through visualisation. Therefore, we introduce a model that controls for mass and physical proximity. Figure 3: Commuting Interaction within the Greater South East in 1981 and 2001
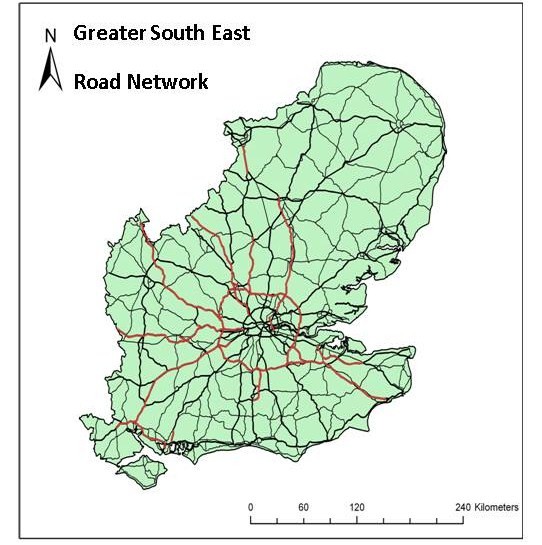
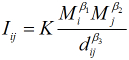
METHODOLOGYA Gravity Model of CommutingIn this section, a formal model is introduced to test the structure in spatial interaction patterns of commuting relations in the Greater South East. The objective is to investigate whether the Greater South East consists of network cities at the intra-urban scale and whether the adjoining districts form a fully integrated, larger-scale urban network. The fully integrated, larger-scale urban network can be viewed as the most extreme form of functional polycentricity at the inter-urban level. In general, we can conclude such a form exists when there is no effect of spatial context on commuting network intensities, other than the mass of sending and receiving localities and the physical distance between them. If the Greater South East functions as a spatially integrated cluster (from an economic point of view), the inter-urban network structure of commuting relations should be solely determined by these variables. Although this strict definition of an integrated network of commuters being randomly distributed over space is very demanding, we can test whether the interactions evolve over time towards this situation. A gravity model (HAYNES and FOTHERINGHAM, 1984) is employed to test for these conditions. In this model, Newton ’s law of universal gravitation is used to explain the interaction between spatial units, in our case commuting flows between districts. The contemporary use of the gravity model in geography and regional science originates from the work by STEWART (1948) and ULLMAN (1954).7 The model holds that the gravitational force between two spatial units is directly proportional to the product of the mass of the spatial units and inversely proportional to the physical distance between them. More formally, the gravity model can be expressed by (1): where Iij is the interaction intensity, or the number of commuters between areas i and j, K a proportionality constant, Mi the mass of the district of origin,Mj the mass of the district of destination, dij the physical distance between the two areas, β1 the potential to generate commuting flows, β2 the potential to attract commuting flows, and β3 an impedance factor reflecting the rate of increase of the friction of physical distance. In this, the physical distance between districts is measured as the actual road distance between districts i and j. The road distance is based on the road network in the Greater South East in 2005 and is obtained by linking an origin-destination cost matrix to the road network, where the cost was set to distance8. However, the overall average road distance between neighbouring districts is likely to be overestimated, as it measures the distance between the two centres of gravity. A dummy reflecting contiguity is included in order to correct for this measurement error in calculating the relevant road distances. Modified Poisson Specification of the Gravity ModelSpatial interaction data should be handled as count data, as they ‘count’ the number of times something has happened; in our case flow frequencies (number of commuters) between and within districts. Although equation (1) is often estimated here using Ordinary Least Squares (OLS), the application of the linear regression model here can lead to inefficient, inconsistent and biased results (LONG, 1997), as the underlying assumptions of normal distribution and homoskedasticity are often not satisfied. For this reason, the use of alternative regression techniques would be more appropriate (BURGER et al., 2009). Probably the most common regression model applied to count data is the Poisson regression, which is estimated by means of maximum likelihood estimation techniques. Using a Poisson model specification (FLOWERDEW and AITKIN, 1982; LONG, 1997), the multiplicative form (1) can be converted into the following testable equation (2), in which the probability of observing the value of Iij is expressed as: where the conditional mean μij is linked to an exponential function of a set of regression variables. Equation (2.2) is an unconstrained gravity model. This terminology reflects that the model does not take into account the constraints that the estimated number of commuters entering and leaving the district should be equal to the observed number of commuters. In order to satisfy this condition and because we are primarily interested in estimating the effects of the different interdependencies on the volume of commuting between and within districts, equation 1 is estimated including origin and destination fixed effects. Such doubly constrained gravity model ensures that the total number of observed commuters equates the total number of expected commuters and yields consistent parameter estimates for the variables of interest (BRÖCKER 1989a, FOTHERINGHAM and O’KELLEY, 1989). In equation (2.2), this implies the inclusion of district-specific origin and destination dummy variables. More formally, the fixed effects specification of the most basic gravity model (including physical distance) would look as follows:
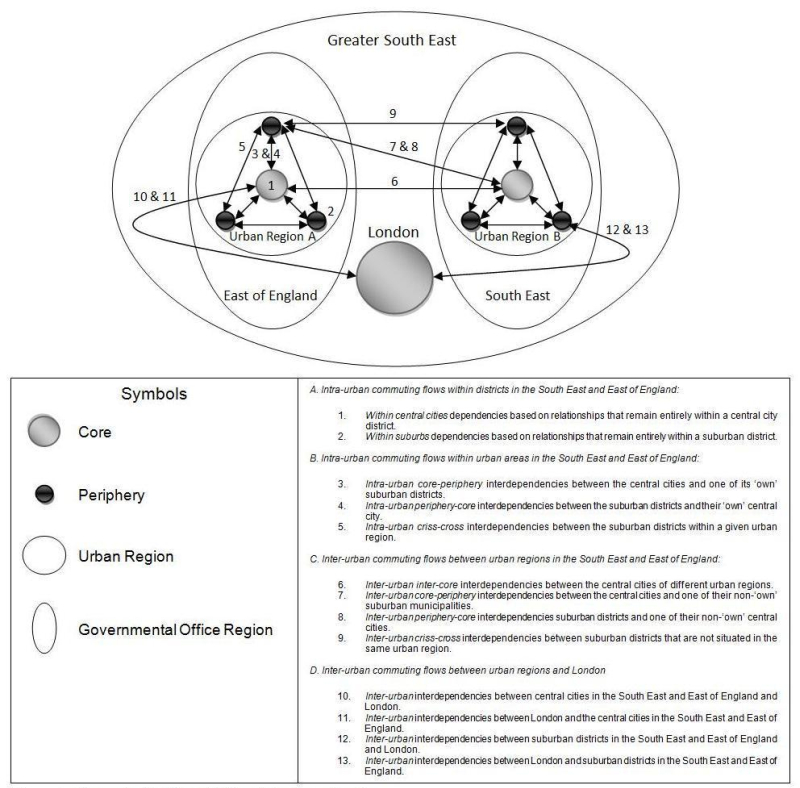
Where ηi is an effect specific to the district of origin (a residential-district specific effect) and γj is an effect specific to the district of destination (a work-district specific effect). These fixed effects terms replace the mass variables in equation 2.2 and control also for other district-specific characteristics. It is important to recognize that the aforementioned Poisson model assumes equidispersion Modelling Urban Network Conditions and Change over TimeThe model presented above is the gravity model in its most basic form. It can be extended to include other variables. In our model, dummy variables that express the spatial-functional context of the commuting interactions between different types of districts are included to examine the spatial structure of the commuting network in the Greater South East . These spatial-functional contexts are formally called regimes and build up the degree of spatial integration in the region. As stated previously, twenty-seven central city districts can be distinguished, each with their own suburban districts. A distinction is made between thirteen different regimes (types of relations) at the intra-urban and inter-urban scales. These regimes are displayed in Figure 4 and convey the spatial context of flows between districts.
Figure 4: Conceptualisation of Urban Interdependencies
At the intra-urban scale, an urban area can be characterized as a monocentric city when – controlling for the sizes of districts and the distance between them – the within central city interdependencies and the periphery-core interdependencies between suburban districts and their ‘own’ central city are strongest [see Figure 2-A1]. In contrast, the separate districts in the Greater South East can be characterized as network cities when, ceteris paribus, the within central city dependencies are not stronger than all other intra-urban interdependencies [see Figures 2-A2 and A3}. Moreover, no observable hierarchy in the different types of intra-urban interdependencies should be present. At the inter-urban scale, the Greater South East can be characterized as an urban network when – again controlling for mass and distance – the interdependencies between districts within urban areas in the Greater South East are not stronger than interdependencies between urban areas across these urban areas. In order to be classified as a fully integrated urban network , no observable hierarchy in the different types of inter-urban interdependencies should be present. In addition, one can distinguish between different types of regional interdependencies based on the presumption of a regional hierarchy. The Greater London region is here depicted as the centre in an inter-urban hub-and-spoke model. Hence, one can distinguish between four types of regional interdependencies (interdependencies 10 – 13 as displayed in Figure 4). In summary, we hypothesised that if the Greater South East can be characterized as a fully integrated decentralized urban network consisting of network cities at the intra-urban level, the network structure of commuting flows should be solely determined by the masses of the districts and the physical distances between them. Controlling for mass and size, commuting trips should be randomly distributed. Hence, there should be no significant relationship of the degree of interaction with any of the thirteen types of interactions distinguished. There should be no evidence for a regional hierarchy at the inter-urban scale. However, this can be considered the ultimate form of a polycentric urban region or urban network. As BERTAUD (2004) rightly notes, no region is fully monocentric or fully polycentric. In the subsequent analyses, the urban structure that fits the Greater South East best is examined. Besides testing the structure of the network, the aim of the analysis is also to examine in which direction the urban system evolves over time. By including time dummies and slope dummies in the gravity equation, changes of the relative strengths of the different spatial regimes (urban interdependencies) over time can be assessed (CAMERON, 2005). In other words, the change in the relative strengths of the different spatial regimes over time is captured by an interaction between the time variable and spatial regime variables (the different urban interdependencies). EMPIRICAL RESULTSChanging Urban Systems at the Intra-Urban ScaleModel 1 (displayed in Table 2) is used to test for the spatial structure in the South East and East of England at the intra-urban scale using a negative binomial regression. As expected, distance has a marked inverse correlation with commuting intensity. The coefficients can be interpreted as elasticities: when physical distance increases by 1%, commuting is predicted to decrease by 1.36%. Likewise, the volume of commuting between two districts that border each other is expected to be 2.85 times as high as the volume of commuting between districts that do not border each other.10 Taking intra-nodal dependency (the flows that remain entirely within a central city district) as the reference category (as it is conceptually the strongest type of urban interdependency), it is possible to compare the relative strength of the different types of urban interdependencies while controlling for the masses of districts and the distance between them. Table 2: Negative Binomial Regression on Commuting between Districts in the Greater South East UK at the intra-urban scale 1981-2001
Looking at the average spatial structure at the intra-urban scale in the period 1981-2001, it appears that the spatial structure of urban regions within the Greater South East (intra-urban scale) is best described by a mixture between the monocentric city model and the polycentric city model. Some of the results strongly point to the monocentric model: the within central cities dependencies in the Greater South East are significantly stronger than interdependencies between districts situated in the same urban region. Further, holding everything else constant, the predicted commuting intensity within central cities is about 4 times as high as the predicted flow between suburban districts (crisscross commuting) and between central cities and suburban districts (core-periphery relations) within the same urban region. In addition, holding everything else constant, the predicted commuting intensity between central cities is about 8 times as high as the predicted flow between suburban districts (crisscross commuting). Finally, testing for the equality of coefficients by means of a Wald test reveals that the periphery-core interdependencies are significantly stronger than the crisscross interdependencies (χ2=12.05, df=1, p<0.01). However, not all conditions of the monocentric model hold. First, the periphery-core interdependencies are significantly stronger than the crisscross interdependencies (χ2=0.03, df=1, p=0.85). Second and most importantly, the within suburban areas dependencies are not weaker than the within central cities dependencies. From this it can be inferred that suburban labeled districts are self-contained to a large extent; many suburban residents are employed in the suburban area in which they live . Many suburban labeled districts (meaning those surrounding larger, central cities and forming their hinterland) in principle are not suburban in character, but self-containing. These are strong arguments for the perception – to some extent – of urban areas in the Greater South East as polycentric spatial entities. Looking at the estimated linear trend over time (1981-2001) in Model 2 (Table 2), some development toward a more polycentric urban form at the intra-urban scale can be observed. The coefficients should be interpreted as the shift in the relative strength of the different urban interdependencies vis-à-vis within central cities dependencies, per period of 10 years. In 1981, holding everything else constant, the within central cities dependencies are about 5.4 times as strong as the core-periphery urban interdependencies. This number has decreased to 3.1 times in 2001. Likewise, the within central cities dependencies are in 1981 about 11.2 times as strong as the core-periphery urban interdependencies, while in 2001 this has dropped to about 7.2 times. However, even if this trend continued, it would take at least another 80 years before one could speak of a network city at the intra-urban scale. Additional evidence for decentralization of the urban system at the intra-urban scale is observed in the fact that, over time, the core-periphery and crisscross urban interdependencies are significantly increased relative to the within-suburb dependencies and periphery-core interdependencies. Additionally, the periphery-core interdependencies also increase in strength relative to the within-central cities dependency over time, although not significantly so. Changing Urban Systems at the Inter-Urban ScaleModel 3 (Table 3) tests for the average spatial structure of the Greater South East in the period 1981-2001 at the inter-urban scale using a zero-inflated Poisson regression. Recall that the Greater South East can be characterized as an urban network if the interdependencies between districts within (intra) urban areas in the Greater South East are not stronger than interdependencies between (inter) urban areas. Overall, it can be concluded that the dependencies within urban regions in the South East and East of England are stronger than the dependencies between urban regions. Holding mass and physical distance constant , the predicted flow between districts within the same urban region in the South East and East of England is, on average, 100% larger that the inter-district flows that exceed the level of the urban regions. Examining the different types of inter-urban interdependencies between urban regions in the South East and East of England, we can observe the presence of a hierarchy in the sense that the different types of interdependencies significantly differ in their relative strength. In general, the between central cities interdependencies are stronger than the inter-urban central city-suburb, inter-urban suburb-central city and between suburbs interdependencies. From this, it can also be concluded that although the degree of urban network formation is marginal, it is mainly occurring between the core districts of the separate urban areas (Figure 2B). Stronger evidence for urban network formation at the inter-urban scale can be found in the interdependencies between the urban regions of the South East and East of England (origin), on the one hand, and the London area (destination), on the other hand, is stronger than the dependencies within urban regions in the South East and East of England (compare HALL and PAIN, 2006). Controlling for mass and distance, the interaction intensity between the South East and East of England areas and the London area is, on average, not significantly smaller than within urban regions in the South East and East of England. Looking at the interaction intensity between London and the South East and East of England, it can be concluded that the urban network formation is one-sided. Ceteris paribus, there are many employees travelling from the South East and East of England to London, but relatively few employees travelling from London to the South East and East of England. Table 3: Zero-Inflated Poisson Regression on Commuting between Districts in the Greater South East UK at the inter-urban scale 1981-2001
Model 4 (Table 3) looks at the development of the urban system at the inter-urban scale over time.11 Overall, we find some evidence for the decentralization of the Greater South East at the inter-urban scale for the period 1981-2001. First, the interdependencies between South East/East of England and London lose relative strength, compared to dependencies within urban regions in the South East and East of England, while the interdependencies between the South East/East of England and London gain relative strength. Second, the interdependencies between regions within the South East and East of England do not gain any strength over the dependencies within urban regions, except for the inter-urban central city-suburb interdependencies. This leads to the conclusion that there is evidence for the decentralization of activities in the Greater South East at the regional level, but evidence for urban network development at the inter-urban scale (between regions) over the past 20 years is lacking. CONCLUSIONS AND DISCUSSIONCurrently, a plethora of research reports and policy documents on the development of urban networks worldwide and in the Greater South East, in particular, have been published. However, there are relatively few rigorous empirical assessments of the urban network concept. The shift from a location-based economy to a network-based economy can be seen as a continuum. As a consequence, the extent to which the urban network model is now a full substitute for the central place model remains unclear. There is a need for objective and quantitative input for this discussion. The structure and evolution of commuting flows in districts in the Greater South East between 1981 and 2001 were modelled with an extended version of the gravity model, incorporating functional regime dummies and time trends. The strengths of the different spatial interdependencies within the Greater South East were tested on both the intra- and inter-urban scales. The results indicate that the Greater South East does not (yet) constitutes a fully integrated urban network by our strict definition. However, the strength of the spatial interdependencies within suburban districts indicates that suburban nodes are increasingly operating in a manner independent to the central city. This is an indicator of the development of polycentric regions at the intra-urban scale. However, the time-trend analysis shows that using our gravity approach without external shocks (opening-up of infrastructure, job creation and (re-)location and the creation of new housing facilities), based upon the difference in magnitude observed over the past twenty years, it would take another 80 years before the Greater South East is fully polycentric at the intra-urban scale. At the inter-urban scale, there is less indication of development towards urban network formation. The results mostly support a monocentric interpretation of the Greater South East at the inter-urban scale, which is relatively stable over time. However, the absence of a hierarchy in the interdependencies on the regional inter-urban scale suggests that a development towards polycentricity is also possible at the inter-urban scale; however, this would require pointed investments in infrastructure and locational employment and housing planning. Although the model employed for this analysis is robust, a number of points should be made about the underlying data. First, commuting data is only one way to investigate the structure of urban systems. Several authors have pointed out that movements of people are not a perfect indicator for economic interaction and should be used alongside other forms of economic interaction to gain a realistic insight into the structure of urban systems (GLANZMANN et al., 2004). Although different groups of people exhibit various degrees of willingness to travel to work, most people prefer to live relatively close to their main place of work (TURNER and NIEMEIER, 1997; ROUWENDAL 1999). A similar analysis as performed in this article of data on buyer-supplier interactions or innovation collaboration could potentially offer a different view that would enable one to make more detailed conclusions on the structure of the urban system in the Greater South East. However, the data on such interactions that are currently available for the Greater South East are too weak to make statistically robust inferences and are difficult to obtain (HALL et al., 2006). Second, most currently available commuting data is based on survey questions asking for daily commuting behaviour. Hence, the choice of studying commuting trips means that we focus on the ‘daily urban space’ of people. However, when it comes down to urban network development, it might be more reasonable to assume that interactions over larger distances do not take place everyday and we should rather look at the ‘weekly urban space’ or ‘monthly urban space’ of people. GREEN et al. (1999) describe how weekly commutes over large distances are increasingly supplanting migration. These ‘super commutes’ are missing from or disturbing the currently available data, since people who commute weekly often have two places of residence. GREEN et al. (1999) estimate that in Britain the total number of people undertaking such super commutes is just over 1% of the total number of employed residents. Third, and related to the previous point, it is also important that future research on functional polycentrism and urban network development concentrates on less frequent types of trips, such as leisure and business trips (see also LAMBOOY, 1998; HALL and PAIN, 2006), and other types of functional relationships between cities, such as inter-urban trade (DAVOUDI, 2008; VAN OORT et al., 2009). Finally, the empirical results presented in this paper have implications for policy. . Our results indicate a development towards urban networks at the intra-urban scale and relatively little development at the inter-urban scale. Transport planning should therefore primarily focus on the intra-urban scale as well. This means that more focus of investments should be on secondary roads within the existing urban fabric than on high-speed roads linking urban regions. Recent studies suggest that there are little urban economic and labour force complementarities between nearby cities in Western economies (MEIJERS, 2005). Instead, cities try to compete on the same highbrow economic specializations, like business services, ICT and high-tech production (VAN OORT et al., 2009). This hampers a more integrated and synergetic ‘urban network’ approach. As this situation is unlikely to change, the spatial planning of housing and business sites should predominantly serves local demand at the level of daily urban systems. And as the employment location becomes more endogenous to population location within urban regions in Western counties (BOARNET, 1994) – meaning that “jobs follow people” more than that “people follow jobs” – the planning of population development becomes more steering in this planning process. Urban network development can gain from high-speed infrastructure that bypasses London, when the places connected show marked economic complementarities. The extent to which these inter-regional infrastructure investments foster the potential economic advantages of positive agglomeration economies should be outweighed against negative ones (as congestion avoidance and growth-pole effects). Notes and Acknowledgements We thank two anonymous referees for their useful comments on an earlier version of this article. All errors remain ours. Frank van Oort’s research was funded by the British Council Amsterdam and the Dutch Science Council NWO (Research Grant PPS 856). An earlier version of this paper was circulated under the title ‘Polycentric Urban Configuration and Urban Network Development in the Greater South East UK 1981- 2001’. REFERENCESALBRECHTS L. (2001) How to proceed from image and discourse to action: as applied to the Flemish Diamond, Urban Studies 38, 733-745. ALLEN J. and COCHRANE A. (2007) Beyond the territorial fix: regional assemblages, politics and power, Regional Studies 41, 1161 – 1175. ALONSO W. (1964) Location and Land Use. Harvard University Press, Cambridge (MA). ANAS A., ARNOTT A. and SMALL K.A. (1998) Urban spatial structure, Journal of Economic Literature 26, 1426 – 1464. AOYAMA Y. and CASTELLS M. (2002) The informational society, an empirical assessment: employment and occupational structures of G-7 countries in the 1990s, International Labour Review 141, 123 – 159. BAILEY N. and TUROK I. (2001) Central Scotland as a polycentric urban region: useful planning concept or chimera?, Urban Studies 38, 697 – 715. BATTEN D.F. (1995) Network cities: creative urban agglomerations for the 21 st century, Urban Studies 32, 313 – 327. BERRY B.J.L. (1964) Cities as systems within systems of cities, Papers in Regional Science, 13, 147-163. BERTAUD A. (2004) The spatial organization of cities: deliberate outcome or unforeseen consequence?, Working Paper 2004 – 01, Institute of Urban and Regional Development, University of California, Berkeley, CA. BEST R.H. (1981) Land Use and Living Space. Methuen, London. BOARNET M.G. (1994) The monocentric model and employment location, Journal of Urban Economics 36, 79-97. BOURNE J. S. and SIMMONS J. W. (Eds) (1978) Systems of Cities. Oxford University Press, Oxford. BOYLE P. and FENG Z. (2002) A method for integrating the 1981 and 1991 British census interaction data, Computers, Environment and Urban Systems 26, 241 – 256. BRÖCKER J. (1989a) Partial equilibrium theory of interregional trade and the gravity model, Papers of the Regional Science Association 66, 7-18. BRÖCKER J. (1989b) How to eliminate certain effects of potential formula, Environment and Planning A 21, 817 – 830. BUCK N.H., GORDON I.R., HALL P., HARLOE M. and KLEINMAN M. (2002) Working Capital: Life and Labour in Contemporary London. Routledge, London. BURGER M.J., VAN OORT F.G. and LINDERS G.J.M. (2009) On the specification of the gravity model of trade: zeros, excess zeros and zero-inflated estimation, Spatial Economic Analysis 4, 161-183. BURGESS E.W. (1925) The Growth of the City. University of Chicago Press, Chicago. CAIRNCROSS F. (1997) The Death of Distance: How the Communications Revolution Will Change Our Lives. Harvard Business School Press, Boston, MA. CAMERON A.C. and TRIVEDI P.K. (1986) Econometric models based on count data: comparisons and applications of some estimators and tests, Journal of Applied Econometrics 1, 29 – 53. CAMERON S. (2005) Econometrics. New York, McGraw-Hill. CAPELLO R. (2000) The city network paradigm: measuring urban network externalities, Urban Studies, 37 (11), 1925 – 1945. CAREY H.C. (1858) Principles of Social Science. Philadelphia, Lippincott. CASTELLS M. (2000) The Rise of the Network Society. The Information Age: Economy, Society and Culture, Volume 1, Second Edition. Blackwell Publishers, Malden. CATTAN N. (2007) Introduction, in CATTAN N. (Ed.), Cities and Networks in Europe, pp. IX-XIV. John Libbey Eurotext, Esher. CHAMPION A.G. (Ed) (1989) Counterurbanization: The Changing Pace and Nature of Population Deconcentration. Edward Arnold, London. CHAMPION A.G. (2002) Population change and migration in the British urban system, in: GEYER, H.S. (Ed) International Handbook of Urban Systems, pp. 87-120. Edward Elgar, Cheltenham UK. CLARK W.A.V. and KUIJPERS-LINDE M. (1994) Commuting in restructuring urban regions, Urban Studies 31, 465 – 483. COUCLELIS H. (2000) From sustainable transportation to sustainable accessibility: can we avoid a new ‘tragedy of the commons’?, in JANELLE, D.G. and HODGE, D.C. (Eds) Information, Place, and Cyberspace: Issues in Accessibility, Berlin: Springer Verlag. CSD (1999) European Spatial Development Perspective: Towards Balanced and Sustainable Development of the Territory of the EU. Office for Official Publications of the European Communities, Luxembourg. CULLINGWORTH J.B. and NADIN V. (1997), Town and Country Planning in the UK, 12 th edition. Routledge, London. DAVOUDI S. (2003) Polycentricity in European spatial planning: from an analytical tool to a normative agenda?, European Planning Studies 11, 979 – 999. DAVOUDI S. (2008) Conceptions of the city-region: a critical review, Urban Design and Planning 16, 51-60. ESF (2006) European Social Fund supports employment and skills development for London 2012, European Union – European Social Fund, Press Release 1 st March 2006, London. FALUDI, A. and B. WATERHOUT (2002) The making of the European Spatial Development Perspective. Routledge, London. FINGLETON B. (2003) Externalities, economic geography and spatial econometrics: conceptual and modelling developments, International Regional Science Review 26, 197 – 207. FINCH D. and MARSHALL A. (2007) Urban Promise: Cities and the Economic Future of the East of England. Histon, East of England Development Agency. FLOWERDEW R. and AITKIN M. (1982) A method of fitting the gravity model based on the Poisson distribution, Journal of Regional Science 22, 191 – 202. FOTHERINGHAM A.S. and O’KELLEY, M.C. (1989), Spatial Interaction Models: Formulations and Applications. Kluwer, Dordrecht. FRANDBERG B. and VILHELMSON L. (2003) Personal mobility: a corporeal dimension of transnationalisation. The case of long-distance travel in Sweden, Environment and Planning A, 35, 1751-1761. GARREAU J. (1991) Edge City: Life on the New Frontier. New York, Doubleday. GEYER H.S. (2002) On urban system evolution, in GEYER, H.S. (Ed) International Handbook of Urban Systems, pp. 39-66. Edward Elgar, Cheltenham, UK. GILLESPIE A., WILLIAMS H. (1988) Telecommunications and the reconstruction of regional comparative advantage, Environment and Planning A 20, 1311 – 1321. GLANZMANN L., GRILLON N., KRUSE C., THIERSTEIN A. (2004) Polycentricity and metropolitan governance: a Swiss case-study. Paper presented at the 44 th European Congress of the European Regional Science Association, Porto, Portugal. GORDON I.R. (2003) Three into one: joining up the Greater South East, Town and Country Planning 72, 342 – 343. GORDON I.R. (2004) A disjointed dynamo: the Greater South East and inter-regional relationships, New Economy 11, 40 – 44. GOTTMAN J. (1961) The Urbanized Northeastern Seaboard of the United States, The Twentieth Century Fund, New York. GOURIEROUX C., MONTFORT A. and TROGNON A. (1984) Pseudo maximum likelihood methods: applications to Poisson models, Econometrica, 52, 701 – 720. GREEN A.E., HOGARTH T. and SHACKLETON R.E. (1999), Long distance commuting as a substitute for migration in Britain: a review of trends, issues and implications, International Journal of Population Geography 5, 49-67. GREEN N. (2007) Functional polycentricity: a formal definition in terms of social network analysis, Urban Studies 44, 2077-2103. GREENE W.H. (1994) Accounting for excess zeros and sample selection in Poisson and negative binomial models, Working Paper 94 – 10, Stern School of Business, New York University, New York. HAGUE, C. & K. KIRK (2003) Polycentricity Scoping Study. Office of the Deputy Prime Minister: London. HALL P. (2001) Global city regions in the twenty-first century, in SCOTT, A.J. (Ed) Global City Regions, pp. 59-77. Oxford University Press, Oxford, UK. HALL P. (2006) The Polycentric Mega-City, in KARSSENBERG, H. (Interview) http://www.erasmuspc.com/index.php?id=18046&type=article, accessed at 29/04/2008. HALL P. and GREEN N. (2005) South East England: Commuting and Definition of Functional Urban Regions. Institute of Community Studies / The Young Foundation & Polynet Partners, London. HALL P., PAIN K. and GREEN N. (2006) The informational geography of Europolis: mapping the flow of information, in HALL, P. and PAIN, K. (Eds) The Polycentric Metropolis. Earthscan, London. HALL P. and PAIN, K. (2006) From Metropolis to Polyopolis, in HALL, P. and PAIN, K. (Eds) The Polycentric Metropolis. Earthscan, London. HALL R. and WHITE, P. (1995) Europe’s Population: Towards the Next Century. London, University College London Press. HAYNES K.E. and FOTHERINGHAM A.S. (1984) Gravity and Spatial Interaction Models. Sage, London. IRWIN I. and HUGHES M. (1992), Centrality and the structure of urban interaction, Social Forces 71, 17-51. KLOOSTERMAN R.C. and MUSTERD S. (2001) The polycentric urban region: towards a research agenda, Urban Studies 38, 623 – 633. LAMBOOY J.G. (1998) Polynucleation and urban development: the Randstad, European Planning Studies 6, 457 – 467. LDA (2007) Report: Greater South East – Update on Joint Boards Meeting, part 2 item 4.2. London Development Agency, London. LIMTANAKOOL N., DIJST M. and SCHWANEN T. (2007) A theoretical framework and methodology for characterizing national urban systems on the basis of flows of people: empirical evidence for France and Germany, Urban Studies 44, 2123 – 2145 . LIMTANAKOOL N., SCHWANEN T. and DIJST M. (2009) Developments in the Dutch urban system on the basis of flows, Regional Studies 43, 179-196. LIN G. (1999) Assessing changes in interstate migration patterns of the United States elderly population 1965-1990, International Journal of Population Geography 5, 411-424. LONG J.S. (1997) Regression Models for Categorical and Limited Dependent Variables, Sage, Thousand Oaks, CA. LONGLEY P., BATTY M., SHEPHERD J. and SADLER G. (1992) Do Green Belts change the shape of urban areas? A preliminary analysis of the settlement geography of South East England, Regional Studies 26, 437-452. MEIJERS E. (2005) Polycentric urban regions and the quest for synergy: is a network of cities more than the sum of its parts?, Urban Studies 42, 765 – 781. MEIJERS E. (2007) From a central place to a network model: theory and evidence of a paradigm change, Tijdschrift voor Economische en Sociale Geografie 98, 245-259. MEIJERS, E. (2008) Measuring polycentricity and its promises, European Planning Studies 16, 1313-1323. MUTH R.F. (1961) The spatial structure of the housing market, Papers in Regional Science, 7, 207-220. NIELSEN T.A.S. and HOVGESEN H.H. (2008) Exploratory mapping of commuter flows in England and Wales, Journal of Transport Geography 16, 90-99. ODPM (2003) Sustainable Communities: Building for the Future, Office of the Deputy Prime Minister, London. PAIN K. (2008) Examining ‘core-periphery’ relationships in a mega-city region: the case of London and South East England, Regional Studies 42, 1161-1172. PARR J.B. (2004) The polycentric urban region: a closer inspection, Regional Studies 38, 231 – 240. PERROUX (1955) Notes sur la notion de ‘pôle de croissance’, Économie Appliquée 7, 307-320. PRED A. (1977) City Systems in Advanced Economies: Past Growth, Present Processes and Future Development Options. Hutchinson, London. RAVENSTEIN E.G. (1885) The laws of migration, Journal of the Statistical Society 48, 167 – 235. RENKOW M. and HOOVER D.M. (2000) Commuting, migration and rural-urban population dynamics, Journal of Regional Science 40, 261 – 287. ROMEIN A. (2004) Spatial planning in competitive urban regions: some practical lessons from Northwest Europe, in HAMBLETON R. and SMITH, J. (Eds) City Futures: An International Conference on Globalism and Urban Change. University of Illinois, Chicago. ROUWENDAL, J. (1999) Spatial job search and commuting distances, Regional Science and Urban Economics 29, 491-517. SABRE (2007) Roaders Digest, http://www.sabre-roads.org.uk/roadlists/, accessed on 30/04/2008. SCHWANEN T., DIELEMAN F.M. and DIJST M.J. (2004) The impact of metropolitan structure on commute behavior in the Netherlands: a multilevel approach, Growth and Change 35, 304-334. SEEDA (2005) The UK’s engine for growth and prosperity: A case for targeted investment in the Greater South East, South East England Development Agency, East of England Development Agency, and London Development Agency, Guildford UK. SEEDA (2006) A Clear Vision for the South East: the South East Plan, Executive Summary, South East England Development Agency, Guildford UK. SIMMIE J., SENNETT J., WOOD D. and HART D. (2002) Innovation in Europe: a tale of networks, knowledge and trade in five cities, Regional Studies 36 (1), 47-64. SOHN, J. (2004) Are commuting patterns a good indicator of urban spatial structure?, Journal of Transport Geography 13, 306 – 317. STEWART J.Q. (1948) Demographic gravitation: evidence and applications, Sociometry 11, 31 – 58. TURNER, T. and NIEMEIER, D. (1997) Travel to work and household responsibility: new evidence, Transportation 24, 397 – 419. ULLMAN E.L. (1954) Geography in spatial interaction, in REZVAN D. and ENGELBERT E.S. (Eds) Interregional Linkages, Proceedings of the Western Committee on Regional Economic Analysis, UCLA, Berkeley, CA: UCLA. URRY J. (2004) Social networks, travel and talk, British Journal of Sociology, 54, 155-175. VAN DER KNAAP G.A. (2002) Stedelijke Bewegingsruimte: Over Veranderingen in Stad en Land. Den Haag, SdU Uitgevers. VAN DER LAAN L. (1998) Changing urban systems: an empirical analysis at two spatial levels, Regional Studies 32, 235 – 247 . VAN HAM, M. (2002) Job Access, Workplace Mobility, and Occupational Achievement. Delft, Eburon Publishers. VAN OORT, F.G., BURGER, M.J., RASPE, O. (2009), On the economic foundation of the urban network paradigm. Spatial integration, functional integration and economic complementarities within the Dutch Randstad, Urban Studies (forthcoming). VUONG Q.H. (1989) Likelihood ratio tests for model selection and non-nested hypotheses, Econometrica 57, 307 – 333. WHITE M.J. (1988) Location choice and commuting behaviour in cities with decentralized employment, Journal of Urban Economics 24, 129-152.
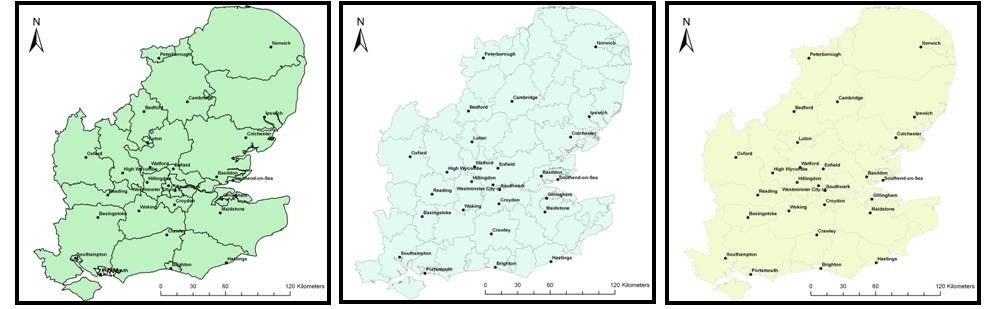
APPENDIX A: Urban AreasIn order to investigate the hypotheses further, it was necessary to define different ‘Urban Areas’ within the Greater South East, each with one ‘core-county’ and several ‘periphery-counties’. The analyses performed in this paper allow for a rather simple definition of ‘Urban Areas’. In almost all instances, the most recent version of NUTS III areas was used to define Urban Areas in the Greater South East. The NUTS III geography is useful here for two reasons: first, it can be used with the ‘CIDS 1991/2001 common geography’, and second, NUTS III is a commonly accepted definition of an ‘Urban Area’. However, in a number of instances the NUTS III area geography causes problems in that some counties (the unit of analysis) are a NUTS III area on their own. In these cases, another definition of an Urban Area, the Travel-to-Work-Areas (TTWA), was used to assign counties to an Urban Area (see Figures A1-A3). The core of each Urban Area was defined as the county with the largest city in terms of population. The rationale behind the choice for the most populous city as the core of an ‘Urban Area’ is based on the historical role of the city as a ‘ Central Place’. However, for Urban Areas located in the Greater London Area this rule does not apply as London as a whole could be considered a core. For these Urban Areas, the county (London Borough) with the highest demand for labour was chosen as the urban core. The role of the Greater London Area as a core on its own in the Greater South East urban network is investigated separately. Figure A1-A3: Creation of Urban Areas From left to right: GSE NUTS III areas, GSA TTWA areas, and the used Urban Areas in this paper with their urban cores
APPENDIX B: Districts in the Greater South East UK |
||||||||||||||||||||||||||||||||||||||||||||||||||||||||||||||||||||||||||||||||||||||||||||||||||||||||||||||||||||||||||||||||||||||||||||||||||||||||||||||||||||||||||||||||||||||||||||||||||||||||||||||||||||||||
 (1)
(1)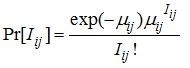 , Iij = 0,1..., (2.1)