GaWC Research Bulletin 266 |
|
|
|
This Research Bulletin has been published in Transport Policy, 16 (5), (2009), 240-250, under the title 'World maritime cities: from which cities do container shipping companies make decisions?' doi:10.1016/j.tranpol.2009.08.002 Please refer to the published version when quoting the paper.
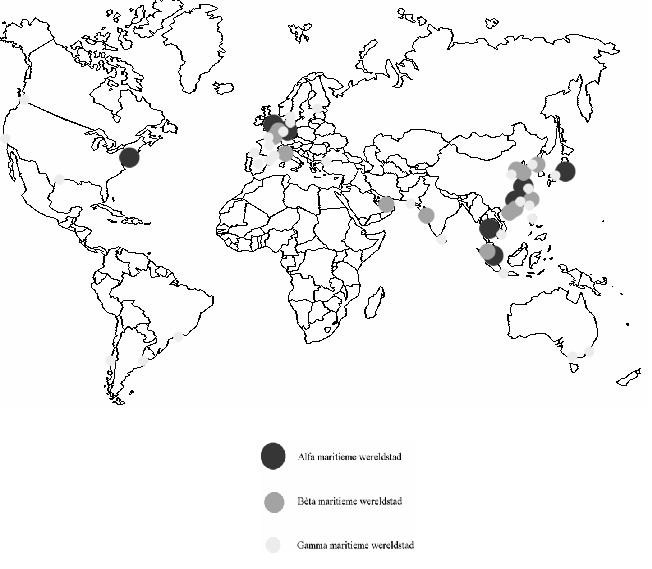
IntroductionWorld cities and their networks have been well-researched. Yet, within this field of study, there is a noticeable void when it comes to world cities in the maritime sector. Indeed, there is precious little literature to be found on this subtopic: unlike other sectors of the economy, it has hitherto not been extensively studied. Yet Friedmann (1986), in his initial list of world cities, already suggests implicitly that seaports are significant. After all, he refers to Rotterdam Europort, not Amsterdam, as a world city. Hence, the purpose of the present paper is to fill the aforementioned lacuna. This contribution consists of two main parts. Part I encompasses a survey of the literature on world cities. As we have previously pointed out, much research has already been conducted into global cities, albeit in relation to other industries than the maritime sector. Part II consists mainly in empirical research whereby the world maritime cities are identified and the network that connects them is analysed. In this part we also consider the consequences of globalisation on the maritime networks and we ascertain what are the world’s leading ports. Once the latter are identified, we are able compare the hierarchy of global ports with that of world maritime cities. WORLD CITIESIn this section, we consider the work of a number of authors who put forward distinct perspectives on the subject of world cities. Our literature survey will provide insight into the foundations of other scholars’ approach to world cities research and the various methodologies applied in this field. Demographic Versus Functional ApproachWorld cities research has been approached in different ways. A clear distinction can be made between the demographic approach and the functional approach. In the former, great significance is attributed to city size, while in the latter cities are considered more in the context of the network to which they belong. The functional approach focuses on cities’ global capacity, i.e. the number of services offered or, if you will, the relative concentration of knowledge and expertise they represent (Beaverstock, Smith en Taylor, 1999). It is this approach that we shall take to determine from which cities the global maritime sector is commanded. After all, the scope and extent of maritime services provided in a city largely determine the position that it occupies within the network of world maritime cities. The New International Division of LabourThe 1970s marked the beginning of a significant reorganisation of the world economy, a process commonly referred to as globalisation. Investment and production was no longer confined to national contexts, but became increasingly dispersed across the globe. The emergence of new information technologies and evolutions in the transport sector gave rise to a new international division of labour. It became possible for companies to decentralise production and yet retain central control. Moreover, transport was proceeding increasingly rapidly and/or efficiently. Production processes that did not require skilled workers were the first to be transferred to low-wage countries. According to Friedmann (1986), the general model of world cities is a response of those locations to the new international division of labour. The leading cities are, to all intents and purposes, the command and control centres of the world economy. They are important for the successful integration of the globally distributed production sites. Power relationships determine how they are connected with each other and the rest of the world. According to Friedmann, the most important world cities are London, New York and Tokyo (Beaverstock, et al., 1999; Beaverstock, et al., 2002; Knox et al., 1994). Globalisation has also generated new goods flows and given rise to shifts within the maritime sector. Following Friedmann’s hypothesis, we assume world maritime cities to be characterised by a dense concentration of leading corporate headquarters in the maritime industry. The Space of FlowsAccording to Castells (2001), networks constitute the new social morphology of our societies. The many innovations that have occurred in communication science have been conducive to a structural change in the world and its economy. Today’s societies are formed around networks of financial and information flows. In this context, Castells asserts that a passage has taken place from a “space of places” to a “space of flows”. Therefore, cities’ hierarchical position is determined not only by their hinterland, but also by their status within networks of flows. These flows, argues Castells, exert a strong attractive force. The world cities function as large hubs within the space of flows: they are nodes where a multitude of economic sectors meet. Hence, these cities serve as information centres for companies from those different sectors (Bosworth, 1996; Taylor, 2004). The maritime sector, too, is organised as a network, built around maritime freight flows. Innovations in transport and logistics have fundamentally altered the classical networks of these flows. In the case of maritime services companies, it is paramount to their commercial success that they should be present in certain nodes within the network of maritime flows. Advanced Producer ServicesAccording to Sassen (1993), world cities are defined by the presence of not only headquarters of large multinational corporations, but also “advanced producer services”. World cities, she argues, are essentially services centres. Advanced producer services consist mainly in specialised assistance (financing, market research, accountancy, insurance, advertising, public relations, legal counsel, management, consulting, etc) to both the private and the public sectors. Such specialised companies are necessary in order for the globalised world economy to function optimally (Beaverstock, et al., 2002; Knox, et al., 1994). Sassen’s work also includes a study of New York, London and Tokyo – her so-called “Global Trilogy” – in their capacity as global cities. According to Sassen, the evolution that has unfolded in telecommunication and information technology has led to two opposite yet complementary trends, namely decentralisation and concentration of economic activity. The dispersion of production has given rise to a need for new forms of control and organisation. These functions are now found in corporate headquarters in world cities, which in turn has resulted in increased demand for financial and business services. When multinationals – the principal customers of companies providing specialised services – began to operate more globally, service providers followed them to the leading cities. This way, world cities developed into clusters of specialised knowledge (Sassen, 1993; Knox, et al., 1994). Sassen’s analysis is in line with previous definitions of world cities, though it represents a shift in emphasis. According to her, world cities are more than just command centres; they are, first and foremost, global service centres (Taylor, 2004). In the present study, we explore the role of the maritime services sector within these global service centres and vice versa. Leading research in the field of world cities is conducted by the Globalisation and World Cities Study Group & Network, or GaWC. It has devised a general inventory of world cities using Sassen’s criterion of the presence of companies offering advanced producer services (accountancy, advertising, banking / finance and law). For companies operating globally, it is important to locate in the most appropriate world cities. These firms disperse their professionals across the world, selecting cities where they feel they need to have an office in order to achieve their commercial ambitions. Hence, the presence of such companies provides us with a measure of a city’s global capacity (Beaverstock, et al. 1999). Figure 1 provides an overview of the GaWC inventory of world cities. At the highest level, we find New York, London, Paris and Tokyo. Importantly, the leading world cities (Alpha and Beta cities) are concentrated in three regions, namely North America, Western Europe and Asia-Pacific. It is no coincidence that these are also the world’s most globalised regions (Beaverstock, et al., 1999). World Maritime CitiesInternational world cities are pivotal in the ongoing globalisation process. According to Cartier (1999), nowhere is the impact of this evolution felt as profoundly as in port cities. As the globalisation trend took off in the final quarter of the previous century, the distances to be bridged became greater than ever before. Between 1960 and 1990, there was a fourfold expansion in the volume of maritime trade. Still according to Cartier, many of today’s world cities grew out of coastal settlements. As a result of historical migratory patterns and maritime bartering, these locations became cities of great cultural diversity and economic power, which further enhanced their appeal to population groups who shaped global activity. In this manner, they were able to develop into large coastal conurbations. However, in the contemporary perception, maritime activity is not as central as it used to be, to the extent that it is not a condition for a city to be classified as a world city. Cities such as London and New York are important economic centres and they are indeed located near or on the coast, yet their role as ports is secondary to their function as services centres (Ducruet, 2004). In the mercantile era, maritime transportation was the only means of conducting trade across seas and oceans. In other words, the economic heart of a city was its port. More recently, however, air transport has arrived on the scene. While the bulk of freight is still transported by ship, air transport has become the choice mode in passenger transport, where travel time is obviously a crucial consideration. So even though freight continues to be transported mainly by sea because of the lower cost, the economic heart of the city has partly shifted from seaport to airport (Cartier, 1999). In contrast to Cartier, Bosworth (1996) argues that a growing proportion of world cities are ports. He proposes that this is a consequence of ports’ greater capacity to engage in global trade. Port cities, unlike continental cities, are able to attract such commodity flows as rice, coffee, oil, automobiles and textiles. Moreover, the rise of ports would appear to be a historical trend: by the year 2000, approximately 80% of the world’s 25 largest cities were ports, compared to 60% in 1925 and 50% back in 1500. In other words, Bosworth feels that the world city network is becoming not only increasingly global, but also increasingly maritime in nature. Figure 2 presents the world’s top 30 container ports for the years 1985 and 2005. The ports have been ranked by TEUs handled in those respective years. Comparing the two rankings, we notice that Rotterdam and New York have been overtaken primarily by Asian ports, with Hong Kong and Singapore now occupying the top two positions. The ports of China in particular have come to the fore: they feature hardly at all in the list for 1985, but twenty years on they are already among the leading ports. Most European and American ports also recorded growth over the period considered, but far less so than their Asian counterparts. The spectacular rise of Asia’s ports is driven by the enormous increase in exports that the region has experienced in consequence of globalisation. In addition, China’s economic development has made the country a large importer of raw materials, cargo which must of course pass through the country’s seaports (YAP, et al., 2006). If we compare the top 30 of world ports and the GaWC inventory of world cities (Figure 1), we notice that a number of locations feature in both lists. Clearly, then, quite a number of world cities have a maritime focus. It should however also be noted that the study by GaWC dates from 1999, while the table of port cities pertains to 2005. The Consequences of Globalisation for the Maritime NetworkGlobalisation has occasioned some important developments in the maritime sector. First and foremost, the volume of cargo has grown substantially. Moreover, the worldwide dispersion of production and consumption has resulted in the emergence of global supply chains. These changes have given rise to a need for improved maritime access of ports and greater efficiency in freight handling and hinterland transportation services. The advent of containerisation and palletisation signified a revolution in this respect: the transportation of general cargo in standard units has speeded up the entire distribution process. While in the past it may have taken months to ship cargo to its destination, it is now usually a matter of only days. The introduction of the container has also revolutionised both land-based transport and liner shipping, and it has had a profound impact on the traditional port hierarchy (Notteboom, et al., 2005; Stopford, 2000). Today, a shipping company will call at a particular port with a view to serving an extensive area beyond it and because that port constitutes a node in the global network of goods flows. Besides being transported to the hinterland, goods are also transshipped onto other vessels to be carried to ports further afield. Increasingly, ports are specialising in one or the other activity. Ports with a sizeable hinterland will tend to focus on improving their transport links with that area; ports that are optimally located to attract maritime container flows will tend to manifest themselves as transshipment hubs and concentrate on improving their links with the foreland. Hinterland ports, more so than transshipment hubs, tend to be located in the vicinity of urban centres. If this urban centre is large enough, one speaks of a port metropolis. Such port metropolises are internationally-oriented cities, with a strong presence of tertiary sector activities. They are the economic “cornerstones” of globalisation (Ducruet, 2004). Of great importance to the success of a port city is its connection to shipping lines operated by the leading maritime carriers. The greater the number of liner shipping networks a port belongs to, the more favourable its prospects for the future (Ducruet, 2004). Identifying World Maritime Cities and Their NetworksWe shall try to ascertain empirically which sites may be regarded as world maritime cities and how they are connected through networks. Our approach shall be based on an assessment of maritime services offered. The method applied in this study is the same as that used by Beaverstock, Smith and Taylor to construct their so-called “Roster of World Cities” and it is discussed extensively in various GaWC Research Bulletins. Research Bulletins 5, 23 and 43 in particular contain good methodological descriptions (Taylor, 2001; Taylor, et al., 2002; Beaverstock, et al., 1999). Information GatheringShipping companies are obviously important players in maritime transport. In today’s market, we even observe a shift in the power balance away from port authorities and towards shipping companies. Port authorities will go to great lengths to be included in the network of an important shipping company or to ensure that a shipping company or terminal operator chooses to locate in their port. It is necessary for ports to adapt to shipping companies’ strategies and to offer them the best locations (Ducruet, 2004). The starting point for our research consists in an extensive list of major firms in the maritime services sector (75 shipping companies and 19 container terminal operators). From this list, we select companies with a global locational strategy. According to Taylor et al, a company may be deemed to pursue a global locational strategy if it has offices in at least 15 different cities, including one or more cities in each of the prime globalisation arenas, i.e. Northern America, Western Europe and Asia- Pacific. We must also take account of the fact that a number of shipping companies belong to larger groups or partnerships. Indeed, the maritime sector is characterised by increasing market concentration. On the one hand, takeovers have resulted in corporate structures consisting of a core firm and subsidiaries. On the other, medium-sized firms are increasingly entering into partnerships in order to be able to offer global services and compete with the largest players in the sector. Examples of such large groups are Maersk, CMA CGM, MOL, IRISL, COSCO CSAV and Hanjin. As a consequence, shipping companies such as Safmarine (Maersk Group), Norasia (CSAV Group), ITS (Evergreen Group) and Delmas (CMA CGM Group) do not appear in the list of companies considered, yet their offices are incorporated into the analysis, as they are part of a group network (Taylor, et al., 2002). It is noticeable that container terminal operators are often far less globally-oriented. Moreover, many are part of a shipping company. Consequently, they are filtered out of the list. If we were to apply the same criteria for container terminal operators as we do for shipping companies, just two operators would be retained, and the two largest – Hutchison Port Holdings and PSA Corporation – would actually be disregarded. However, as these operators are the market leaders, they are included in our study nonetheless. After an extensive study of the websites of 75 shipping companies and 19 container terminal operators, and taking due account of our selection criteria, a total of 35 firms were retained. The largest firms are represented in hundreds of different locations. Maersk Line, for example, has 325 offices distributed across more than a hundred countries. However, we restricted our study to the most important cities. These generally feature in the aforementioned Roster of World Cities (see Figure 1) or in the list of major port cities (see Figure 2). In addition, we have included a number of capital cities and other cities of economic importance in our study. Subsequently, information was collected on the significance of a particular city to the global services provision of a particular firm. Two types of information are required in this respect. First, we need information relating to the size of a firm’s presence in a given city. By this we mean the number offices and the number of professional staff that a firm has in that location. Second, information is needed on the so-called extra-locational functions of a firm’s office in a given city. This is determined by the relative importance of an office in the overall corporate organisation. A distinction is made between headquarters, regional offices and subsidiary headquarters. This approach is in line not only with Sassen’s advanced producer services theory, but also Friedmann’s functional hypothesis. On the basis of all this information, one is able to determine a service value for each firm and city. In order to convert this information into data, a “service value” was attributed to each city for each of the firms. To this end, we used a relatively simple scoring system, with an initial scale from 0 to 5. A city was obviously awarded score 0 if a firm was not present in that location. A score of 5 was awarded to a city if it hosted a firm’s headquarters. It was far less straightforward to decide when to award scores 2, 3 or 4, as here we had to rely on available corporate information. Between the extreme scores of 0 and 5, three boundary lines needed to be defined: the boundaries between respectively 1 and 2, 2 and 3, and 3 and 4. We invariably started from the assumption that a city scores 2, i.e. that a firm has a regular office in that location. Whether or not that score needed adjusting depended entirely on external information on the office in question. If contact with the office is referred to an office in a different city, then a score of just 1 was awarded. A score of 1 was also awarded if the number of professional staff was very limited. Likewise, the boundary between scores 2 and 3 is based on size factors. A score of 3 was awarded to cities housing an office with an exceptionally large staff. Cities hosting a regional HQ score 4 points. If a city hosted not only offices of a particular firm but also a container terminal operated by a subsidiary, which was considered to enhance the importance of being present in that location, its score was augmented by up to two points. In this manner, we were able to take adequate account of the presence of container terminals. We thus obtain a scale from 0 to 7 points. In this respect our approach differs from that applied by Taylor et al in other sectors of industry, where the maximum score is set at 5. Hence we arrive at a 35 x 130 matrix. MethodologyMaritime Service Status of Cities In this paragraph, we draw from an early GaWC study, as reported in Research Bulletin 5
(Beaverstock, et al., 1999). We start from the basic matrix V with 35 rows representing firms and 130
columns representing cities. Each vij, where i represents a firm and j a city, may assume a value from 0
to 7. We can hence calculate the following aggregate: Analysis of the World Maritime City Network Next, we analyse the network of world maritime cities. To this end, we consider the importance of the links that exist between the cities in that network. The more relationships that a city has with other cities, the greater its importance as a node within the network. The method applied in this analysis is described extensively in GaWC Research Bulletins 23 and 43. The starting point is the 35 x 130 matrix V. In the first instance, calculations are made for the top 5 firms in terms of quantity of service value and the Alpha (see 3.3.1) world maritime cities (limited 5 x 8 matrix). Subsequently, the analysis is repeated, but this time the Beta world maritime cities are also included (5 x 20 matrix). Global Connectivity of a City First we consider the importance of the relationships between the world maritime cities. In other
words, we ascertain to what extent the city functions as a services node within the network. For each
pair of cities a and b, we can derive the relational element from matrix V: So for each firm i, we calculate the interlock link between cities a and b. We do so by multiplying the
individual scores via and vib of cities a and b. When we have made this calculation for every firm
separately, the values obtained can be added up: On the basis of the resulting table, we can now make an egocentric analysis for each city separately.
By this we mean that, for each city, the values of its relations with other cities are added up. This
yields Na , which may be regarded as a measure of the global situational status of a city within the
network of world maritime cities: Complete Network Specification The egocentric approach is the simplest level of network analysis. In order to arrive at a model that
considers all nodes and important linkages, we need to take our analysis one step further. We begin by
creating a square (n x n) elemental relational matrix E. As we have 8 cities, in this instance it will be
an (8 x 8) matrix. To create this matrix, we use the calculated interlock links between two cities, rab.
As rab equals rba, , E is a symmetrical matrix. All we need to do now is calculate the diagonal elements The elemental relational matrix E is more readily interpretable if transformed into a proportional
relational matrix P, where linkages are given as proportions of the maximum possible linkage. The
elements of the proportional relational matrix P are obtained by means of the following formulas: where 0 ≤ pab ≤ 1 and H = ∑hi2 where h is the highest service value provided by firm i from across all cities. In other words, for each firm i, we select the highest service value from matrix V and square it. In the resulting proportional relational matrix P, pab defines the relative degree of quality of mutual services between cities a and b. So pab may be interpreted as the predicted relative quality of service a client can expect when doing business in a pair of cities a en b. Relations in proportional relational matrix P can be converted into social distances by taking the
complement of the proportional links in P: In the resulting matrix D, relations between cities are defined in terms of the social distance to be bridged. Hence, the diagonal values of matrix D are obviously 0. Matrix D relates to the mix of firms in a given city. Pairings of cities with a similar mix of firms will have lower values in the matrix, as the “distance” between such cities is “shorter”. As all the above matrices are symmetrical (rab = rba), they are not suitable for identifying hierarchical
tendencies in the relations. We therefore need an asymmetrical matrix A where the relation between
city a and city b can be different from that between city b and city a. For matrix P, the common total of
all linkages was H. Now we apply an H that is specific to each link: In these equations, hi still represents the highest service value for firm i, and via and vib are the service
values for firm i in cities a and b respectively. So to obtain the new denominator H, we first take the
service value for firm i for the city that is first mentioned in the link. Next, we multiply this value by
the highest service value for firm i. We repeat this procedure for all firms and calculate the aggregate.
If we calculate H in this manner, it is characteristic for the city that is first mentioned in the inter-city
link. Now we take values rab from the elemental relational matrix E and divide them by the
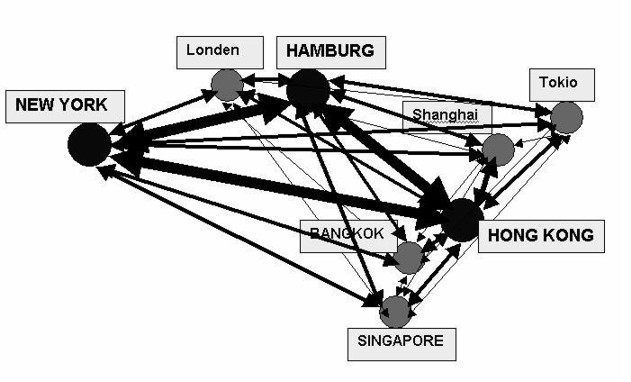
corresponding H to obtain the values for the asymmetrical matrix: qba = rba / Hba The resulting qab may be interpreted as the level of service one may expect if one does business in city b from city a. ResultsMaritime Site Service Status It speaks for itself that offices, particularly important ones, are located most commonly in the most globalised regions (Northern America, Europe and Asia-Pacific), as is reflected in the table (Figures 4 and 5). The top two positions are occupied by Hong Kong and Hamburg, which emerge very clearly from our research as the two most important world maritime cities. Many shipping companies have their headquarters at Hamburg or Hong Kong. Hamburg owes its status as a leading maritime services centre primarily to a number of large German shipping concerns (e.g. Hapag-Lloyd, Hamburg Sud), which have made the city their home base. Hong Kong hosts the headquarters of a number of Asian shipping companies (including OOCL) and it is also the market leader among container terminal operators (e.g. Hutchison Port Holdings). Singapore, the third most important world maritime city, hosts the headquarters of, among others, PSA Corporation. The top 5 is completed by Shanghai in the People’s Republic of China and Tokyo in Japan. Clearly, then, Asia is strongly represented with 4 out of the 5 leading cities. The Alpha level of world maritime cities further includes New Jersey / New York, Bangkok / Laem Chabang and London. Further down the ranking, Rotterdam and Antwerp are tied in tenth place. The top fifty of world maritime cities includes many Asian cities. China in particular is well represented. By contrast, there are few Northern American cities that make it into the ranking, which is largely attributable to the fact that New York occupies such a dominant position in the United States. We had already observed this in finance, and it now transpires also to hold for the maritime sector. Figure 6 provides an overview of all Alpha, Beta and Gamma world maritime cities. It shows strong concentrations of such locations in Europe and Southeast Asia. Five Alpha world cities from the GaWC inventory also appear in our top 10: Hong Kong (1), Singapore (3) Tokyo (5), New York (6) and London (8). Los Angeles occupies place 36, with Paris down in 37th. Chicago, Frankfurt and Milan do not even make the top 50 of world maritime cities. Still, most Alpha world cities from the GaWC inventory also rank high in the hierarchy of world maritime cities. In other words, they are not only leading centre in finance, but also in maritime trade. Conversely, one could say that few of the truly high-ranking world maritime cities do not appear in the GaWC inventory. However, Hamburg, one of the truly important world maritime cities, has no more than Gamma status in the GaWC inventory. The “new” Chinese seaports (Qingdao, Tianjin, Guangzhou, Shenzhen,...) can rightly claim to be world maritime cities, but they do not feature in the list of world cities as far as finance is concerned. Another striking observation is that all Alpha cities are also global legal services centres (Beaverstock, et al., 1999). If one subsequently compares the list of world maritime cities with the list of global ports, there are again a number of observations to be made. We may distinguish between three categories. First and foremost, there are the cities of Hong Kong, Singapore and Shanghai: they are the world’s leading ports and, moreover, Alpha world maritime cities. Hamburg, too, may be regarded as belonging to this category. Second, there is a series of mostly Asian global ports that are not Alpha world maritime cities. Examples include Shenzhen, Busan and Kaohsiung. Third, there are cities that are not global ports, but which are nevertheless classed as Alpha world maritime cities, London being the prime example. New York, Bangkok / Laem Chabang and Tokyo are all in the global port top 30, but may also be considered to belong to this category. Keeping in mind the above observations, it would appear that a city is able to become a leading world maritime centre if a number of conditions are fulfilled. First, the city must have a port, and second, it must also have a strong presence of financial and legal service providers. Maritime firms are attracted by the presence of a financial and legal services sectors. All enterprises require capital for investments. In global financial centres, potential clients and investors are never far away. Moreover, it would seem that maritime companies have a tendency to locate in cities where general maritime policy and regulations are given shape. As in the financial sector, the most important decisions in the maritime sector are taken in those cities where the most comprehensive information is available. Besides the financial and maritime sectors, the media and the legal services sector are, for example, also strongly represented in those locations. Of course, there are some exceptions to this rule. London is a global financial and legal centre even though its port no longer ranks among the world’s largest. London does, however, have a great tradition in shipping. After all, Britain was for centuries a true maritime nation that dominated the world’s oceans. Moreover Hong Kong used to be governed from London. Hence, maritime firms deem it important to have offices in London, as well as in New York and Tokyo, the world’s other leading financial centres. Should London have had a strategically important port alongside its strong financial sector, then it would most probably have ranked right at the top. The importance of London as a world maritime city is underscored by the presence of a number of important organisations. Both the International Maritime Organisation (IMO) and the Baltic Exchange are based in London. The International Maritime Organisation is a specialised United Nations agency that imposes a number of standards on the shipping industry. It is, in other words, concerned primarily with legal aspects of the industry. The Baltic Exchange is a membership organisation that maintains the global market for shipbrokers, charterers and shipowners. It provides daily freight market prices and maritime shipping cost indices, and a market for Forward Freight Agreements (FFAs). Forward Freight Agreements offer a means of protection against fluctuating freight rates. Clearly, then, legal and financial service providers in London cater specifically for the maritime sector. Hamburg, too, is in fact an exception to the rule. Financially and legally, Hamburg is by no means a leading global centre, yet in maritime affairs it most definitely is. Despite a less outspoken presence of financial and legal service providers, Hamburg does house a substantial number of HQs and regional HQs. Network Status of World Maritime Cities The egocentric analysis is based on (5 x 8) matrix V (Figure 7). Strikingly, there is not a single 0 value to be found in matrix V, implying that all firms incorporated into the matrix have offices in all Alpha world cities. We find that Hong Kong is the main node within the maritime network. Hong Kong, Hamburg and New York are, by some margin, the most important world maritime cities. Each of these top-3 cities lies in a different continent. In fact, they represent the world’s three most globalised regions (Asia-Pacific, Europe and Northern America). Hong Kong is the central node of maritime information and goods flows in Asia, Hamburg fulfils that role in Europe, and New York does so in Northern America. When we compare with the general ranking in figure 5, we find that New York has climbed from position 6 to position 3 and that Singapore is no longer the third most important world maritime city. This implies that, despite its lower maritime site service status (because of the limited presence of firms), New York gains in importance within the network because of its greater connectivity. When we repeat this analysis with Alpha as well as Beta world cities in the maritime sector, there are similar observations to be made, with certain Beta cities leapfrogging Alpha cities. Antwerp emerges as the fourth most important node. Likewise, Guangzhou and Rotterdam occupy a higher position in the rankings than one might have assumed. Despite being Beta world maritime cities, they are important nodes. Conversely, an Alpha world maritime city such as London drops down to seventeenth. The three inter-city matrices each contain various specifications of the network of world maritime cities. Let us first consider the proportional relational matrix P. In this matrix, pab provides an indication of the relative degree of quality of mutual services between cities a and b. In other words, pab may be interpreted as the predicted relative quality of service that a customer may expect when doing business in the pair of cities a and b. The highest non-diagonal value in matrix P is 0.66. It represents the pair of Hong Kong and Hamburg. The second (0.63) and third (0.56) highest values are found for the links Hong Kong / New York and Hamburg / New York. These three cities also emerged from the simple preliminary analysis as the three most important nodes within the network of world maritime cities. Subsequently, we consider the social distance matrix D. This matrix relates to the comparative mix of firms in a given city. Pairings of cities with roughly the same mix of firms will exhibit lower values in the matrix, as the “distance” between such cities is “shorter”. As far as the presence of offices is concerned, the sample shows an identical mix for all cities, as all firms are present in all cities. Nonetheless, there may be differences in terms of the size of those offices. In this respect, the lowest value (0.34) in matrix D represents the Hong Kong / Hamburg link. The second (0.37) and third (0.44) lowest values are, not surprisingly, found for the Hong Kong / New York and Hamburg / New York links. The fact that the picture to emerge from matrix D is the same as that emerging from matrix P is due to the nature of dab. To calculate dab, we have after all used the complement of pab. Finally, we look at the asymmetrical relational matrix A. In this matrix, qab may be interpreted as the quality of service one may expect when doing business in city b from city a. When we look at the columns in matrix A, we find the highest values for Hong Kong, Hamburg and New York. These values represent the expected quality of service when doing business in these cities from a different city. Apparently, then, when doing business in Hong Kong, Hamburg or New York, one may always expect a high quality of service, irrespective of the city from where one is operating. All other cities are well-connected with Hong Kong, Hamburg and New York because of these three cities’ importance in the network. By contrast, if one calls on an office in, say, Hong Kong, Hamburg or New York to do business in another world city, then the quality of service one may expect is lower. After all, many firms do not find it necessary to have an equally strong presence in the less important world maritime cities. If we also include the Beta world maritime cities in our full network specification, we obtain more or less the same results. Matrix P then indicates the same top 3 of important linkages. Rather surprisingly, the fourth most important link is that between Hong Kong and Antwerp. The social distance matrix D again yields the same results as matrix P because of the calculation method. In the asymmetrical matrix A, the highest values are, not unexpectedly, found in the columns for Hong Kong, Hamburg and New York. One may also expect relatively good quality of service when conducting business in Shanghai and in the Beta cities of Antwerp, Guangzhou and Rotterdam, irrespective of the city from where one is operating. On the basis of this study, we may conclude that the three leading world maritime cities, in order of importance, are Hong Kong, Hamburg and New York. Figure 9 represents a map of the world maritime city network. It is based on our data regarding the network connections between the Alpha world maritime cities as represented in the proportional relational matrix P. ConclusionIt transpired from our literature review that world cities research may be approached in different ways. The researchers of the Globalisation and World Cities Study Group & Network have developed a method for ranking world cities and for analysing the networks that connect them. On the basis of location strategies of firms from a number of service sectors, they arrive at an inventory of world cities. Hitherto, the method had not been applied to the maritime sector. Yet after some interpretation and minor adjustments, it can also provide insight into the network of world maritime cities, as has been demonstrated in the present study. We have been able to ascertain that many world cities also have a maritime focus. This is due in part to the fact that globalisation processes tend first to manifest themselves in port cities and in part to these cities’ long histories as pivotal transport nodes. Globalisation has also been conducive to a number of other important evolutions within the maritime sector. Volume of cargo has, for example, expanded very substantially. This has in turn created a need for greater efficiency and speed, resulting in, among other things, standardisation of loading units. Transport connections between ports and hinterlands have also come under greater pressure. Our study has shown that the leading world maritime cities, in order of importance, are Hong Kong, Hamburg, Singapore, Shanghai, Tokyo, New Jersey / New York, Bangkok / Laem Chabang and London. In other words, a number of cities (London, New York, Tokyo, Hong Kong and Singapore) are not only absolute world cities, but also world maritime cities. Strikingly, London, which has no world port, still ranks among the world’s leading maritime centres. It emerges from our network analysis that Hong Kong, Hamburg and New York are the most important service nodes in the network of world maritime cities. Each of these three world cities is located in one of the three most globalised regions in the world Asia-Pacific, Europe and Northern America). In the ranking of world maritime cities, Antwerp is tied in tenth place with Rotterdam. However, because of its central location, Antwerp is a strategically important maritime hub. Hence, most large maritime firms have offices in Antwerp, even though they are often small and of limited importance within the corporate structure of those companies. This is due to the relative absence of the financial and legal services sectors in Antwerp. In the leading world maritime cities, unlike in Antwerp, multisectoral clusters have emerged that represent vital sources of information for firms.
REFERENCESBeaverstock, J., Smith, R., Taylor, P., 1999, Research Bulletin 5: A Roster of World Cities, Cities, vol. 16, no. 6, pp. 445-458. Beaverstock, J., Smith, R., Taylor, P., 2000, Research Bulletin 11: "World-City Network: A New Metageography?", Annals of the Association of American Geographers, vol. 90, no. 1, pp. 123-132. Beaverstock, J., Doel, M., Hubbard, P., Taylor, P., 2002, Research Bulletin 20: Attending to the world: competition, cooperation and connectivity in the World City network, Global Networks, vol. 2, no. 2, pp. 111-132. Bosworth, A., 1996, The World-City System by the Year 2000, Journal of Developing Societies, vol. 12, no. 1, pp. 52-67 Cartier, C., 1999, Cosmopolitics and the Maritime World City, The Geographical Review, vol. 89, no. 2, pp. 278-289 Castells, M., 2001, The rise of the network society, Oxford, Blackwell CEMT: European Conference of Ministers of Transport, 2001, Land access to seaports: Round Table 113, Paris, Ducruet, C., 2004, Les Villes-ports: Laboratoires de la mondialisation, Université du Havre; Friedmann, J., 1986, The world city hypothesis. Development and Change, 17, 69-83. GaWC: Globalisation and World Cities, 23 November 2005a, Inventory of World Cities; Knox, P., Agnew, J., M., 1994, The geography of the world economy, London, Edward Arnold. Notteboom, T., Rodrigue, J.P., 2005, Port regionalization: towards a new phase in port development, Maritime Policy & Management, vol. 32, no. 3, pp. 297-313. Sassen, S., 1993, The Global City, Princeton : Princeton University Press. Stopford, M., 2000, Maritime Economics, London, Routledge. Taylor, P.J., 2001, Research Bulletin 23: Specification of the World City network, Geographical Analysis, vol. 33, no. 2, pp. 181-194; Taylor, P.J., Catalano, G., Walker, D.R.F., 2002, Research Bulletin 43: Measurement of the World City Network, Urban Studies, vol. 39, no. 13, pp. 2367-2376. Taylor, P.J., 2004, World city network: a global urban analysis, London, Routledge. Yap, W.Y., Lam, J.S.L., Notteboom, T., 2006, Developments in Container Port Competition in East Asia, Transport Reviews, vol. 26, no. 2, pp.167–188
NOTE* Ann Verhetsel and Steve Sel, Department of Transport and Regional Economics, University of Antwerp, Prinsstraat 13, B-2000 Antwerp, Belgium. Email: ann.verhetsel@ua.ac.be (corresponding author)
Figure 1: GaWC Inventory of World Cities
Source: GaWC: Globalisation and World Cities, 23 November 2005, Inventory of World Cities
Figure 2: The world’s largest container ports in 1985 and 2005 (by total TEU handled)
Source: Ci-online: Containerisation International, 7 March 2006, Container Traffic
Figure 3: Overview of firms included in the study
Figure 4: The 50 most important world maritime cities
Figure 5: Inventory of World Maritime Cities
Figure 6: Geographic Distribution of World Maritime Cities
Figure 7: Total connectivity per city Matrix V
Aggregated links rab
Egocentric analysis
Figure 8: Global connectivity Proportional relational matrix P
Social distances matrix D
Asymmetrical relational matrix A
Figure 9: Map of the World Maritime Cities Network (Alpha level)
Note: This Research Bulletin has been published in Transport Policy, 16 (5), (2009), 240-250 |
||||||||||||||||||||||||||||||||||||||||||||||||||||||||||||||||||||||||||||||||||||||||||||||||||||||||||||||||||||||||||||||||||||||||||||||||||||||||||||||||||||||||||||||||||||||||||||||||||||||||||||||||||||||||||||||||||||||||||||||||||||||||||||||||||||||||||||||||||||||||||||||||||||||||||||||||||||||||||||||||||||||||||||||||||||||||||||||||||||||||||||||||||||||||||||||||||||||||||||||||||||||||||||||||||||||||||||||||||||||||||||||||||||||||||||||||||||||||||||||||||||||||||||||||||||||||||||||||||||||||||||||||||||||||||||||||||||||||||||||||||||||||||||||||||||||||||||||||||||||||||||||||||||||||||||||||||||||||||||||||||||||||||||||||||||||||||||||||||||||||||||||||||||||||||||||||||||||||||||||||||||||||||||||||||||||||||||||||||||||||||||||||||||||||||||||||||||||||||||||||||||||||||